Nov 16, 2015 - availability in the basin and current and future demands. ... maximum temperature ranges from 24°C to 40°C and the ..... Chandrapur district.
Available Online at http://journalijcar.org International Journal of Current Advanced Research Vol 4, Issue 11, pp 465-469, November 2015
ISSN: 2319-6505
RESEARCH ARTICLE
International Journal of Current Advanced Research ISSN: 2319 - 6475
ASSESSMENT OF GROUNDWATER QUALITY IN SARABANGA SUB-BASIN, CAUVERY RIVER, TAMIL NADU, INDIA Boobalan C1, Gurugnanam B2 and Suresh M3 1Department
of Geology, Government Arts College (Autonomous), Salem-7 for Applied Geology, Gandhigram Rural Deemed University, Dindigul, Tamil Nadu 3Department of Civil Engineering, Jayalakshmi Institute of Technology, Thoppur, Dharmapuri District 2Center
AR T IC L E
I NF O
Article History: th
Received 9 September, 2015 Received in revised form 21st September, 2015 Accepted 10thOctober, 2015 Published online 16th November, 2015 Key words: Ground water quality, Sarabangasub-basin, Cauvery river, crystalline terrain
AB ST RA CT Sustainable water management in a river basin requires knowledge of the water availability in the basin and current and future demands. An attempt has been made to study determine the groundwater quality in Sarabanga sub basin, Cauvery river basin of crystalline terrain (Archaean age), Salem district, Tamil Nadu, south India. Groundwater quality analysis results were compared with the WHO standards of drinking water quality limits with the following the water quality parameters namely pH, Ec, TDS, Ca, Mg, Na, Cl, HCO3, SO4, TDS and TH etc., Hydrogeochemical facies of groundwater quality in study area reveals that fresh to brackish and alkaline in nature. Piper's plot shows that the groundwater samples fall in the field of CaHCO3, mixed CaMgCl, NaCl respectively, according to the order of their dominance. From the plot, it is observed that nearly 60% of samples fall in alkaline earths Ca2+, HCO3– exceed the other anions. The physical and chemical parameters of the Sarabanga sub-basin, results show that all the samples are under their commended limit for agricultural and drinking purposes. © Copy Right, Research Alert, 2015, Academic Journals. All rights reserved.
INTRODUCTION Water is basic human need and precious nature. Water is elixir of life but it also cause of more than 80% of the diseases affecting mankind (DevBurman et al., 1995; SubbaRao, 2003; Chandra Sekhar Reddy et al., 2014). Groundwater quality appraisal is gaining importance, due to intense urbanisation, industrialization and agricultural activities putting the soil and groundwater to greater risk of contamination (Ackah et al., 2011;Sayyed and Wagh, 2011; Tiwari, 2011). According to (Milovanovic, 2007) Water pollution also threats human health, economic development and social prosperity. The chemical composition of groundwater is controlled by many factors, including the geological structure, mineralogy, composition of the precipitation, aquifers, and geological processes within the aquifer along with influence of external pollution agencies like effluents from agricultural return flow, industrial and domestic activities. An understanding the geochemical evolution of groundwater is important for a sustainable development of water resources in the present state of art. Demarcating the character of the groundwater in varied space, was proved to be an important technique in solving different geochemical problems (Chebotarev, 1955; Hem 1959; Back and Hanshaw, 1965; Srinivasamoorthy et al., 2011). Study Area The study area, lies between the latitudes 11°46’ N to 12°09’39” N and longitudes78°12’27” E to 78°36’65” E
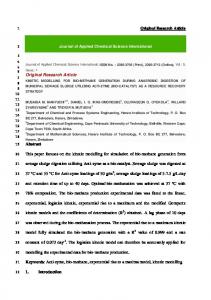
covering an area of 1175.44 Km2. Out of which plain land coversan area of 1015.79 km2(Fig.1). The study area falls in Salem district of Tamil Nadu. The climate of the study area is mainly sub-tropical climate with moderate humidity and temperature. The weather is quite pleasant from November to February and becomes hot from March to June. The maximum temperature ranges from 24°C to 40°C and the minimum temperature ranges from 13°C to 28°C with a mean annual rainfall of 1002 mm of which nearly 80% is received during the southwest and northeast monsoon period (June December).The study area is underlaid by the Archaean crystalline rocks surrounded by wavyhills and hillocks.
METHODOLOGY The drainage network of the basin was traced on transparency and digitized as available on toposheets nos. 57L/4, 8, 58 I/1, and 5 of (1:50,000) and some of the first-order steams were updated with the help of satellite sensor data. Base map preparation and groundwater sample locations located on the study area boundary in Geospatial technology platform. The current study was designed to investigate the conditions of groundwater quality in the study area. The hydrogeochemical study was undertaken by equal grid method to collect in various locations 90 groundwater samples from dug wells and bore wells during March 2014. Samples were drawn with a pre-cleaned plastic polyethylene bottle. Prior to sampling, all the sampling containers were washed and rinsed thoroughly with the groundwater. Water quality parameters such as pH and electrical conductivity (EC) were analyzed immediately.
International Journal of Current Advanced Research Vol 4, Issue 11, pp 465-469, November 2015 Other parameters were later analyzed in the laboratories of Tamil Nadu Water Supply and Drainage Board (TWAD) chemistry laboratory. Ca and Mg were determined titrimetrically using standard EDTA method and chloride was determined by silver nitrate titration (Vogel, 1968) method. Carbonate and bicarbonate were estimated with standard sulphuric acid. Sulphate was determined a gravimetrically by precipitating BaSO4 from BaCl2. Na and K were determined by Elico flame photometer using APHA, 1995 procedure. All parameters are expressed in milligrams per liter (mg/l) and milli-equivalents per litre (meq/l), except pH (units) and electrical conductivity (EC). The electrical conductivity (EC) is expressed in micromohs/cm (μS/cm) at 250C. The analyzed parameters were taken into GIS environment to prepare the individual element spatial distribution maps with respect to WHO standard.
given in the table 1. The groundwater chemistry was used to determine the suitability of groundwater in the study area for drinking purpose by comparing it with the standard guideline values as suggested by the World Health Organization (WHO 1996) in Table 2. The table shows the most desirable limits and maximum allowable limits of various parameters Table 1. Statistical summary of chemical parameters in Groundwater Samples(All values in the table are expressed in ppm except EC in µScm-1 and pH) Variables EC TDS pH TH Ca Mg Na K HCO3 CO3 SO4 Cl K.Ratio SSP RSC SAR Mg hazards Na%
The Total Hardness (TH) of the groundwater was calculated using the formula (Hem 1985), TH= (Ca + Mg) x 50 The Sodium Adsorption Ratio (SAR) was calculated by the following equation given by (Richards 1954) as SAR= [Na+] / {([Ca2+] + [Mg2+])½}1/2
The Residual Sodium Bicarbonate (RSC) was calculated according to (Gupta and Gupta 1987):
Parameters pH
2+
Mean 3062.86 2144.00 8.37 236.80 209.63 74.73 242.08 32.32 641.94 27.17 133.48 492.86 0.63 35.06 -5.18 3.51 38.28 35.06
Std.Dev. 1867.73 1307.41 0.76 171.47 150.04 36.32 247.98 35.92 431.37 29.41 111.23 419.93 0.48 18.80 7.02 2.90 7.04 18.80
Table 2 Groundwater samples of the study area exceeding the permissible limits prescribed by WHO for drinking purposes and the undesirable effect on human system
Na% = [(Na++ K+) / (Ca2++ Mg2++ Na++ K+)] 100
-
Maximum 10644.00 7450.80 9.36 1203.46 1022.40 195.84 1075.20 264.42 3314.44 181.06 624.00 2112.00 2.31 70.87 11.21 11.89 49.27 70.87
EC* – Electrical conductivity, SSP* -Soluble sodium percentage, RSC* – Residual Sodium Carbonate,SAR* – Sodium Adsorption Ratio.
Where all the ions are expressed in meq/L The sodium percentage (Na %) is calculated using the formula given below (Raghunath1984)
2-
Minimum 760.00 532.00 5.92 65.60 53.20 17.55 10.00 1.00 135.74 0.00 15.48 65.52 0.01 2.43 -29.99 0.12 15.48 2.43
2+
RSC= (CO3 + HCO3 ) – (Ca + Mg )
TDS
Where, RSC and the concentration of the constituents are expressed in meq/L.The Permeability Index (PI) was calculated according (Doneen 1964) employing the following equation:
TH Na+ Ca2+ Mg2+ ClNO3-
PI=Na+ {(HCO3 x 100)} 1/2 / Ca2++ Mg2++Na+
SO42F-
where, all the ions are expressed in meq/L.
WHO international No. of wells exceeding standard permissible limits Undesirable effect Most desirable Maximum Pre-monsoon limit allowable limit 6.5-8.5 56 Taste Gastro 500 1,500 57 intestinal irritation Scale 100 500 7 Formation 200 38 75 200 34 Scale 50 150 26 Formation 200 600 44 Salty taste 45 37 Blue Baby Laxative 200 400 78 effect 1.5 41 Fluorosis
Table 3 Suitable areas of groundwater for drinking based on pH Sl. Limiting No. Values
RESULTS AND DISCUSSION Drinking water quality criteria
1
< 6.5
The present research work is mainly focused on the groundwater quality for drinking and irrigation purpose. The groundwater quality studies in Sarabanga sub-basin, Cauvery River, analyzed water chemistry data correlation with respect to world health organization standard 1996. Irrigational quality parameter's well as well as graphical representation as Sodium Absorption Ratio (SAR), Kelley’s ratio (KR), Soluble Sodium Percent (SSP), Residual sodium carbonate (RSC), Sodium Percentage and Magnesium Ratio, doneen’s classification. The results of physico-chemical parameters are
2
6.5 – 8.5
3
> 8.5
Potable Class Not Permissible limit
Total No of Wells Pre Monsoon 5
4,6,7,26,20,21,33,19,1,27,32,48,47,17,21,4 9,52,3,31,50,59,18,34,44,45,75, 1,70,16,23,36,80,62,46 2,8,9,10,11,12,13,14,15,22,24,25,28,29,30, Not 35,37,38,39,40,41,42,43,51,53,54,55,56,57 Permissible ,58,60,61,63,64,65,66,67,68,69,72,73,74,7 limit 6,77,78,79,81,82,83,84,85,86,87,88,89,90, Desirable limit
Evaluation of groundwater quality for drinking use Hydrogen ion concentration (pH) Maximum groundwater initiate the Sarabanga sub-basin has
466
International Journal of Current Advanced Research Vol 4, Issue 11, pp 465-469, November 2015 pH value of the groundwater during pre-monsoon ranged from 5.92 to 9.36 with the average value of 8.37 indicating the overall acid to basic natureof the groundwater due to monsoonal effect. The pre and pH results are given in Table 3. Total Dissolved Solids (TDS) Total Dissolved Solids (TDS) is meant that total amount of all inorganic and organic substances including minerals, metals, salt, cations or anions that are dispersed within a volume of Table 4 Nature of groundwater based on TDS values Sl. No. 1 2 3 4
Limiting Nature of Total No of Wells Values water Pre Monsoon < 1,000 Fresh water 7,8,9,22,25,32,51, 67 1,000 – Brackish All The Samples Excepted Above 10,000 water Mensioned Location(82) 10,000 – Saline water Nil 1,00,000 > 1,00,000 Brine water Nil
Table 5 Drinking water quality based on TH values Sl. No.Limiting Values 1
500
Potable Class Most desirable limit Maximum allowable limit Not permissible limit
Total No of Wells Pre Monsoon 7,48,51,67
Fig.1 Location map of the study area
83 63,71,81
Table 6 Drinking water quality based on EC value 1
Limiting Values < 1500
2
>1500
Sl. No.
Total No of Wells Pre Monsoon Desirable limit 7,8,9,22,25,32,51,54,67 All The Samples Not Permissible Excepted Above Mensioned Location (81) Potable Class
Table 7 Classification of groundwater based on sodium adsorption ratio (Richard 1954) Sl. No.Sodium Absorption RatioClassification 1 2 3 4
Excellent Good Fair Poor
< 10 10 - 18 18 - 26 >26
Total No of Wells Pre Monsoon 87 03 Nil Nil
Table 8 Suitability of groundwater samples for irrigation based on Wilcox’s plot Season
Irrigation Water Class
Pre-monsoon
Excellent to Good Good to Permissible Permissible to Doubtful Doubtful to Unsuitable Unsuitable
Total No. Percentage of Samples 01 1.11 % 27 30 % 02 2.22 % 31 34.44 % 29 32.22%
Fig. 2 Doneen’s Diagram
Table 9 Classification of groundwater based on Residual sodium carbonate Sl. No.
RSC Limiting Values
Category
1 2
< 1.25 1.25 – 2.5 > 2.50
Good Doubtful Unsuitable
Total No of Wells Pre Monsoon 78 06 06
Table 10 Doneen’s Classification of ground water Category of Irrigation Water Class - I Pre-monsoon Class - II Class - III Season
Total No. of Samples 83 6 1
Percentage 92.22 6.66 1.11
Fig. 3 Piper trilinear Diagram
467
International Journal of Current Advanced Research Vol 4, Issue 11, pp 465-469, November 2015 water. For the suitability of groundwater for any purpose, it is essential to classify depending upon its hydro chemical properties, based on the TDS values (Freeze & Cherry 1979). The pre-monsoon TDS results are given in Table 4. Most of the groundwater samples are within the maximum permissible limit for drinking as per the WHO international standard, except three samples. In the study area, 82 samples fell under brackish water and 8 of samples falls under fresh water during pre-monsoon. Water is not considered to be desirable for drinking when TDS in the groundwater affects human health, induces unfavourable physiological reaction, and aesthetically unsatisfactory for bathing. (Abduljameed 2002).
for its management in the area. Hence, air and water circulation is restricted during wet conditions and such soils are usually hard when dry (Collins and Jenkins 1996; Saleh et al., 1999) Residual sodium carbonate The water having excess of carbonate and bicarbonate over the alkaline earth mainly calcium and magnesium, in excess of allowable limits affects agriculture unfavorably (Richards 1954). The classification of irrigation water based on the RSC values is presented in Table 9 (78 nos.s) of groundwater samples fall under good, (6 nos.) of samples fall under doubtful and the remaining (6 nos.)of samples falls under unsuitable category for irrigation in pre-monsoon season. Irrigation water with high RSC is considered to be deleterious to the physical properties of the soils as it decreases the soil permeability (Omkarsingh et al 2005).
Total hardness (TH) Groundwater classification (Table. 5) based on the total hardness (TH) indications that a majority of the samples fall in the hard water category. The maximum allowable limit of TH for drinking is 500 mg/l. The most desirable limit is 100 mg/l as per the WHO international standard. Groundwater sample out of 83 exceeded the maximum allowable limits (Table.5).
Permeability Index (PI) The soil permeability is affected by long term use of irrigation water. It is influenced by sodium, calcium, magnesium and bicarbonate contents of soil. Doneen’s (1948) evolved a criterion for assessing the suitability of water for irrigation based on Permeability Index (PI). Analytical data of PI values reveal that 92 % of the groundwater samples fall in Class- I (Fig. 2 and Table 10). It indicates that groundwater is good for irrigation in pre-monsoon season.
Evaluation of groundwater quality for agricultural use Electrical Conductivity (EC) Electrical conductivity is an important indicator of water quality assessment. The groundwater samples of EC values ranged from 760 to 10644 µs/cm (average of 3062) during pre-monsoon period. As per the WHO (1996) standard, EC values were found to be high in 81 stations Not Permissible limit during the pre-monsoon. This was noticed near the downstream region. The pre monsoon EC results are given in Table 6. The high values of EC denote the impact of industrial effluents (Subramanyam & Yadaiah 2001).
Graphical presentation of chemical data Techniques used to display the chemical character of the waters in a useful way include andPiper plots (Piper 1994). As there are three separate aquifer units, it is possible that the waters of each aquifer might have different chemical characteristics.
Sodium Absorption Ratio (SAR) Piper Trilinear Diagram Richard (1954) classified water quality based on Sodium Absorption Ratio. According to Richard’s classification, 87 of the samples were excellent and 3samples was good during the pre-monsoon season. Sodium concentration in groundwater is very important, since the increase of sodium concentration in water causes deterioration of the soil properties reducing permeability (Tiwary 1994). SAR values which less than 10 denote excellent category of water for irrigation (Table 7).
One of the most useful graphs for representing and comparing water quality analyses is the trilinear diagram by Piper shown in Fig.3. Here cations, expressed as percentages of total cations in milli equivalents per liter, plot as a single point on the left triangle; while anions, similarly expressed as percentages of total anions, appear as appoint to the right triangle. These two points are then projected into the central dimond-shaped area parallel to the upper edges of the central area. This single point is thus uniquely related to the total ionic distribution; a circle can be drawn at this point with its area proportional to the total dissolved solids. The trilinear diagram conveniently reveals similarities and differences among groundwater samples because those with similar qualities will tend to plot together as groups. Further, simple mixtures of two source waters can be identified. The plot shows that the groundwater samples fall in the field of CaHCO3, mixed CaMgCl, NaCl respectively, according to the order of their dominance. From the plot, it is observed that nearly 60% of samples fall in alkaline earths Ca2+, HCO3– exceed the other anions. One of the most interesting aspects of hydrochemistry is the occurrence of water bodies with different water chemistry in very close proximity to each
Sodium Percentage (Na %) The analytical data plotted in US salinity diagram (Richards 1954) illustrates that most of the groundwater samples fall within the field of C3S1 (58%), C4S1(21%) samples are good, C4S2 (21%) moderate and C4S4 (6%) indicating high salinity and low sodium water, which can be used for irrigation on almost all types of soil, with little danger of exchangeable sodium. The analysis of ground water in Sarabangasub-basin was of excellent to good for irrigation (1 nos.) samples and good to permissible(27 nos.) (Table.8). Irrigation water with high Na% may cause sodium accumulation and calcium deficiency in the soil leading to a breakdown of its physical properties. Therefore, good drainage, high leaching and use of organic matter are required
468
International Journal of Current Advanced Research Vol 4, Issue 11, pp 465-469, November 2015 other. This has been variously attributed to the subsurface geology (Offiong&Edet 1998).
4.
CONCLUSION 5.
1. Groundwater from the study, carried out in the Sarabangasub-basin areas follows. The ranges from EC value 760 to 10644 µS/cm in groundwater samples. The maximum value of 10644 µS/cm was recorded in wells near the hill. pH value ranges from 5.92 to 9.36. The study area has high pH values, which represents the acid to basic nature of groundwater. 2. The Na% indicates that the groundwater is not suitable for irrigation except 30 samples. The classification of irrigation water according to the RSC values shows that where the category of groundwater is good except 12 sample. 3. Interpretation of hydrochemical analysis reveals that the groundwater in Sarabangasub-basin is fresh to brackish and acidic in nature. The plot shows that the groundwater samples fall in the field of CaHCO3, mixed CaMgCl, NaCl respectively, according to the order of their dominance. From the plot, it is observed that nearly 60% of samples fall in alkaline earths Ca2+, HCO3– exceed the other anions. 4. Total hardness shows an increasing trend during postmonsoon and summer seasons. As per the classification of water for domestic and irrigation purposes, water is fit for irrigation purposes with minor exceptions irrespective of seasons. 5. In south eastern part of the study area alkali values are slightly higher but it is within WHO’s tolerable limits. The physical and chemical parameters of the Sarabangasub-basin results shows that all the samples are under recommended limit for Irrigation and Drinking purposes.
6.
7. 8.
9. 10. 11.
12.
13. 14. 15.
16.
References 1.
2.
3.
Ackah M, Agyemang O, Anim AK, et al. 2011. Assessment of groundwater quality for drinking and irrigation: irrigation: the case study of Teiman-Oyarifa Community, Ga East Municipality, Ghana. Proceedings of the International Academy of Ecology and Environmental Sciences, 1(3-4): 186-194. APHA (1995) Standard methods for the examination of water and wastewater. American Public Health Association, Washington, DC. Back W, Hanshaw B. 1965. Chemical Geohydrology Advances in Hydroscience (Back W, Hanshaw B, eds).Academic Press, USA
17.
18.
19.
*******
469
Chandra Sekhar Reddy, L., DeshPande, S.M., and Aher, K.R., (2014). Hydrogeochemical characterization and evaluation of groundwater quality in Lingala of Kadapa district, Andhra Pradesh, India. Journal of Geochemistry, Vol. 16, No.3, Pp.288-295. Cheboterev II. 1955. Metamorphism of natural waters in the crust of weathering-I. Geochimicaet Cosmochima Acta, 8(1-2): 22-48 DevBurman, G.K., Singh, B., and Khatri, P., (1995). Fluoride in environment: hydrogeochemical studies groundwater having high fluoride contents in Chandrapur district. Gowndwana geology magazine, Vol.9, Pp.71-80. Doneen LD (1948) The quality of irrigation water. California Agriculture Department, Davis 4–11, 6–14. Doneen, L.D. (1964) Published as a water science and engineering, Department of Water Science and Engineering, University of California, paper 4001. Freez RA, Cherry JA (1979) Groundwater. Prentice Hall, Englewood Cliffs. Gupta, S.K. and I.C (1987) Gupta, Oxford and IBH Publication Coy, New Delhi, India, pp:399. Hem JD. 1959. Study and interpretation of the chemical characteristic of natural water. Water Supply Paper2254, USGS, USA Piper AM (1994) A graphic procedure in the geochemical interpretation of water analysis. Am Geophys Union Trans 25:914–923. Raghunath, I.M. (1987) Wiley Eastern Ltd., New Delhi, India, Richards, L.A. (1954) USDA and IBH Pub. Coy Ltd., New Delhi, India, pp: 98-99. Sayyed MRG, Wagh GS. 2011. An assessment of groundwater quality for agricultural use: a case study fromsolid waste disposal site SE of Pune, India. Proceedings of the International Academy of Ecology and Environmental Sciences, 1(3-4): 195-201. Srinivasamoorthy K, Nanthakumar C, Vasanthavigar M, et al. 2011. Groundwater quality assessment from ahard rock terrain, Salem district of Tamilnadu, India. Arabian Journal of Geosciences, 4(1): 91-102 SubbaRao, N., (2003). Groundwater quality: Focus on fluoride concentration in rural parts of Guntur district, Andhra Pradesh, India. Hydro. Sci. Jour. - des sciences Hydrologiques, Vol.48 (5), Pp.835 – 847. Tiwari RN. 2011. Assessment of groundwater quality and pollution potential of Jawa Block Rewa District, Madhya Pradesh, India. Proceedings of the International Academy of Ecology and Environmental Sciences,1(3-4): 202-212 WHO (1996) Guidelines for drinking water quality. Geneva 1:53–73.