Jan 16, 2010 - reduced sediment yield by 80%; parallel terraces, 10 m (32.8 ft) filter strips, and grassed waterways reduced sediment .... water quality in a 7.3 km2 (2.8 mi2) Smith Fry. Agricultural ..... indicates a perfect fit. Percent bias (PBIAS).
RESEARCH SECTION doi:10.2489/jswc.70.2.75
A modeling approach to evaluate the impact of conservation practices on water and sediment yield in Sasumua Watershed, Kenya J.K. Mwangi, C.A. Shisanya, J.M. Gathenya, S. Namirembe, and D.N. Moriasi
Key words: calibration—conservation—ecosystems—soil erosion—Soil and Water Assessment Tool (SWAT)—validation Proper watershed management is essential for the provision of products such as food, timber, fuel wood, fresh water, and nontangible benefits such as flood regulation, sediment retention, and water
JOURNAL OF SOIL AND WATER CONSERVATION
purification. While watershed managers have various management options, the effectiveness of each option in mitigating the negative impacts on water quality and quantity needs to be assessed before prac-
Copyright © 2015 Soil and Water Conservation Society. All rights reserved. Journal of Soil and Water Conservation 70(2):75-90 www.swcs.org
Abstract: Degradation of agricultural watersheds often reduces their capacity to provide ecosystem services such as sediment retention, flow regulation, and water quality improvement. Soil and water conservation practices can be used to enhance the capacity of watersheds to produce these services. The objective of this study was to evaluate the impact of agricultural conservation practices on water and sediment yield using the Soil and Water Assessment Tool (SWAT) model. The study area was Sasumua Watershed (107 km2 [43 mi2]), where land degradation has affected watershed’s capacity to regulate flow and maintain water quality. The model was calibrated and validated for streamflow at the watershed outlet. Data on annual average erosion rates for the area was used to constrain soil erodibility factor (KUSLE) and practice erodibility factor (PUSLE) parameters during sediment calibration while measured three month sediment concentration data was used for validation. Model performance was assessed using the coefficient of determination (r 2), Nash-Sutcliffe efficiency coefficient (ENS) and percent bias (PBIAS). Results gave monthly streamflow r 2 values of 0.80 and 0.85, ENS values of 0.74 and 0.81, and PBIAS values of ±5% and ±6% during the calibration and validation. The model also satisfactorily simulated daily sediment concentrations with an r 2 value of 0.54. However, ENS and PBIAS values were low, which was attributed to the short duration of measurement. The validated model was used to simulate sediment yield for the period 1970 to 2010. Mean annual watershed sediment yield was 40,934 t y–1 (90,243,096 lb yr–1). The impacts of filter strips, contour farming, parallel terraces, grassed waterways, and their combinations on water and sediment yield were simulated by adjusting relevant model parameters. The effectiveness of filter strips increased nonlinearly with width being optimum at 30 m (98.4 ft). A combination of 30 m (98.4 ft) wide filter strips and grassed waterways reduced sediment yield by 80%; parallel terraces, 10 m (32.8 ft) filter strips, and grassed waterways reduced sediment yield by 75%; 10 m (32.8 ft) filter strips and grassed waterways reduced yield by 73%; contour farming and grassed waterways reduced yield by 66%; and grassed waterways reduced yield by only 54%. Parallel terraces reduced surface runoff by 20% and increased base flow by 12%, while contour farming reduced surface runoff by 12% and increased base flow by 6.5%. Implementation of conservation practices can reduce sediment yield and increase water yield marginally. The results give an insight into the implications of the present land use management practices and can be used to devise ecologically sound watershed management and development plans.
tices are implemented. For higher success rate, information is also required on where to optimally intervene to best dedicate efforts and resources. Implementation of conservation practices, also known as best management practices (BMPs), can reduce soil erosion and improve water quality by reducing sediments, nutrients, chemicals, and microorganisms that are washed by runoff from cultivated fields. These BMPs increase infiltration and thus reduce peak runoffs that cause flooding. Because their effectiveness cannot be evaluated in all situations, watershed managers rely on models to provide an estimate of the impact of particular BMPs on water quality improvement at watershed scale. The Soil and Water Assessment Tool (SWAT) has been used to evaluate water quality benefits of agricultural conservation practices (Arnold and Fohrer 2005). It offers the greatest number of management options for modeling agricultural watersheds (Kalin and Hantush 2003). Bracmort et al. (2006) provide detailed description of the procedure used to represent field borders, filter strips, parallel terraces, and grassed waterways in SWAT at watershed scale. Some of the conservation practices that have been studied for their effectiveness in abating nonpoint source pollution (NPS) include vegetative filter strips, contour farming, parallel terraces, and grassed waterways. A vegetative filter strip (VFS) is a strip or area of herbaceous vegetation that removes contaminants from overland flow (USDA NRCS 2009). Sediments, nutrients, and pesticides in surface runoff are reduced as the runoff passes through the filter strip (Lovell and Sullivan 2006). The effectiveness of the filter strip in reducing NPS pollution is based on its trapping efficiency, which depends mainly on its width (Yuan et al. 2009). Other factors that influence trapping efficiency include slope, vegetation, inflow rate, and particle size. Trapping efficiency has also been found to increase with an increase in vegetation cover and to decrease with an John. K. Mwangi and Chris. A. Shisanya are professors at Kenyatta University in Kenya. John. M. Gathenya is a professor at Jomo Kenyatta University of Agriculture and Technology in Kenya. Sara Namirembe is a research analyst in Environmental Services at the World Agro-forestry Centre in Kenya. Daniel N. Moriasi is a hydrologist at the Grazinglands Research Laboratory with the USDA Agricultural Research Service.
MARCH/APRIL 2015—VOL. 70, NO. 2
75
76
MARCH/APRIL 2015—VOL. 70, NO. 2
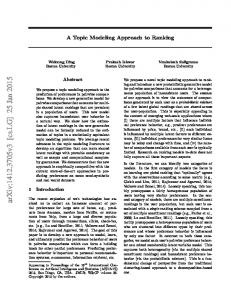
Wakarusa Watershed (950 km2 [366.8 mi2]) in northeast Kansas to evaluate the effectiveness of vegetative filter strip lengths applied at the edge of fields to reduce sediment yield and fecal bacteria concentration. Santhi et al. (2006) evaluated the impact of contour farming, grade stabilization structures, manure and nutrient related BMPs, forage harvest management, and other BMPs on water quality in West Fork Watershed in Texas, using SWAT. In Black Brook Watershed in Canada,Yang et al. (2009) used SWAT to assess the efficiency of flow diversion terrace systems on maintaining surface water quality at watershed level. Arabi et al. (2008) developed and evaluated a method for representation of BMPs in SWAT. They considered 10 conservation practices including contour farming, filter strips, field borders, parallel terraces, strip cropping, and residue management, all of which are applied in upland areas. The method included conservation practices that can be implemented within small streams, namely, grassed waterways, lined waterways, and grade stabilization structures. The method was applied to evaluate the impacts of conservation practices on water quality in a 7.3 km2 (2.8 mi2) Smith Fry Agricultural Watershed in Indiana. Studies of SWAT applications to African conditions are limited; therefore, this study sought to evaluate the impact of agricultural BMPs on water and sediment yield in Sasumua Watershed, a medium size agricultural watershed in central Kenya using the SWAT model. Materials and Methods Study Area. Sasumua Watershed, a subbasin of the Tana basin, is an agricultural and forested watershed located in Kinangop subcounty of Nyandarua County in central Kenya. It lies between longitudes 36°34′48″ E and 36°40′48″ E and latitudes 0°39′0″ S and 0°46′48″ S at an altitude of between 2,200 to 3,850 m (7,218 to 12,631 ft) above mean sea level (figure 1). The watershed feeds Sasumua reservoir which provides 20% of the water requirements of Nairobi—the capital city.The topography of the watershed is characterized by steep slopes in the northern forested part (bordering the Aberdares National Park) and along the lower banks of major rivers that drain into the reservoir (figure 2). The southwestern and central parts of the watershed are flat and prone to soil erosion and flash flooding. These areas generate high volumes of surface runoff because they are dominated by poorly drained planosols which allow very little infil-
tration of water into the ground. During the wet season they contribute significantly to the total flow to Sasumua reservoir (about 67%) through surface runoff which is often laden with sediments and other pollutants from the nearby farms and urban centers. However, during the dry season the reservoir depends on flow from the forested Chania and Kiburu subwatersheds through tunnel and pipe diversions. Hydrologically these subwatersheds are not part of the watershed (figure 3).These rivers are perennial with water of comparatively higher quality than that of Sasumua subwatershed. The total reservoir catchment area is about 107 km2 (66.5 mi2), half of which is in gazetted forest reserve (Gathenya et al. 2009); the rest is under intensive cultivation by small holder farmers. Major land uses in the watershed derived from a 2007 Aster satellite image are 42% forests, 40% agriculture, 7% woodlots, 3% grassland, and 3% moorland. Urban areas comprise only about 0.5% of the watershed. Farming is the main socioeconomic activity in the watershed with horticultural produce grown on small land holdings (average 1 ha [2.5 ac]) for the Nairobi urban market. The ready market for these products has led to intensive cultivation and increased use of inorganic fertilizers and pesticides making water pollution from agrochemicals a major challenge. Degradation of reservoir water quality can be attributed to runoff containing eroded sediments from farmlands and nutrients from applied fertilizers making their way into the reservoir through surface runoff. This has had a bearing on the cost of treating water at Sasumua treatment plant located downstream of the reservoir (figure 3).The steep slopes coupled with high intensity rainfall makes the watershed vulnerable to erosion under intensive cultivation. In recent years, population in the watershed has increased tremendously, leading to conversion of formerly noncultivated areas into agricultural lands. Demand and competition for natural resources such as land, water, and energy has also increased heightening the risk of land degradation. Unplanned and upcoming urban centers without functional solid and liquid waste collection systems also pose a pollution challenge. Climate in the watershed varies with altitude with rainfall increasing and temperature decreasing with increasing altitude. Mean annual rainfall varies from 1,000 to1,600 mm (39.4 to 63 in) and is bimodal in pattern with
JOURNAL OF SOIL AND WATER CONSERVATION
Copyright © 2015 Soil and Water Conservation Society. All rights reserved. Journal of Soil and Water Conservation 70(2):75-90 www.swcs.org
increase in inflow rate (Fox et al. 2010) and increase in slope (Gilley et al. 2000). Contour farming is a form of agriculture where farming activities—ploughing, planting, cultivating, and harvesting—are done along the slope rather than up and down the slope. It increases infiltration and reduces soil erosion and sedimentation thus improving water quality. Contour farming has been studied (Arabi et al. 2008; Stevens et al. 2009), and the results indicate that has a positive impact in reducing sediments and other water pollutants from agricultural lands. It is a popular means of reducing soil losses in many parts of the world (Stevens et al. 2009). Terraces are structural BMPs installed on sloping land. They reduce soil erosion by reducing long slopes into shorter ones that allow runoff water to infiltrate into the ground thus reducing surface runoff and its capacity to cause erosion. Terraces have been studied (Arabi et al. 2008; Santhi et al. 2006) and found to be very effective in reducing diffuse pollution from agricultural lands, especially on steep slopes. Grassed waterways are channels or drainage ditches covered with grass in order to reduce surface runoff (Fiener and Auerswald 2005) and water pollution (Evrard et al. 2008; Gassman et al. 2006). The grass slows down runoff, traps sediments, and absorbs chemicals and nutrients washed down by runoff water from agricultural lands. By reducing surface runoff, they reduce channel erosion and increase sediment deposition. Evaluating the effectiveness of BMPs at a watershed scale is an expensive exercise, and models are often used to identify the most effective BMPs for implementation to mitigate water quality problems. The SWAT model (Arnold et al. 1998) has been used extensively to evaluate the effectiveness of various BMPs (Gassman et al. 2007). Bracmort et al. (2006) modeled the impact of structural BMPs in different conditions on water quality in Black Creek Watershed in Indiana, United States. In their study, grassed waterways, grade stabilization structures, field borders, and parallel terraces were represented in SWAT by relevant parameters. Sahu and Gu (2009) used SWAT in 51.3 km2 (19.8 mi2) of the Walnut Creek Watershed in Iowa to examine the effectiveness of contour and riparian buffer strips in reducing nitrate nitrogen (NO3-N) outflows from cropped fields. Parajuli et al. (2008) used SWAT in Upper
Figure 1 Location of Sasumua Watershed.
220000
240000
33400 00
33400 00
N
Kinangop
Kinangop Nyandarua Central Provinces Kenya Provinces 0
long rains from March to May and short rains from October to December (Gathenya et al. 2009). Mean monthly temperature and potential evapotranspiration are 12°C (54°F) and 1,250 mm (49.2 in), respectively (Woodhead 1968). Major soils in the watershed include histosols, nitisols, acrisols, and phaeozems in the northeastern part with steep terrain and planosols on the lower southwestern plateau.The agricultural part of the watershed is composed mainly of planosols and phaeozems. Planosols have low infiltration rates and periodic high water table conditions with areas under them showing clear signs of poor drainage and forcing farmers to use parallel surface drainage channels to reduce waterlogging. Currently there are no gauges installed to measure inflow to the reservoir except on Kiburu diversion. Stream flow to the reservoir was therefore deduced from reservoir water balance equation 1: Vinflow = (Vend – Vbeginning) + Vflowout + Vevap + Vseep – Vpcp, (1)
JOURNAL OF SOIL AND WATER CONSERVATION
500,000 m
220000 0
240000 12,500
where Vinflow is the volume of water entering the reservoir during the day (m3), Vend is volume of the water at the end of the day (m3), Vbeginning is volume of water in the reservoir at the start of the day (m3), Vflowout is the volume of water leaving the reservoir during the day (m3), Vpcp is volume of rainfall falling on the reservoir during the day (m3), Vevap is volume of water lost from the reservoir through evaporation during the day (m3), and Vseep is volume of water lost from the reservoir through seepage (m3). This was possible because Sasumua, Chania, and Kiburu subwatersheds drain to the reservoir, which has good storage and abstraction data. Applying equation 1 entailed installing a hypothetical gauge at the entrance to the reservoir and computing the defined water balance components. The volume of water lost through seepage and overspill during high flows was input as seepage flow and measured by a weir downstream of the reservoir. The storage capacity of the reservoir is 16 × 106 m3 (565 × 106 ft3), which is usually full during the long rains
39000 00
33200 00 39000 00
Legend
25,000 m
that occur in the months of April and May. When the reservoir is full, Chania and Kiburu diversions are closed, and water allowed back into the respective rivers, which do not flow to the reservoir. The diversions also have maximum carrying capacities that cannot be exceeded, and any excess flow is allowed back into the rivers. During heavy rains, the reservoir is flushed regularly to remove accumulated sediments and to reduce potential damage of overspill water to downstream communities. The sediment laden water is returned back to the river downstream of the reservoir. During low flows, flow from all rivers is diverted into the reservoir except for the legal 10% environmental flow. In the flat areas of the watershed are several water pans constructed to retain water and trap sediments. Within the watershed, there are several licensed abstractors, e.g., community water projects and individuals abstracting water for domestic and irrigation use. There are also illegal abstractors whose exact location and volume of abstraction is unknown. The effect of all this is to reduce the volume
MARCH/APRIL 2015—VOL. 70, NO. 2
Copyright © 2015 Soil and Water Conservation Society. All rights reserved. Journal of Soil and Water Conservation 70(2):75-90 www.swcs.org
Sasumua Watershed
33200 00
N
77
78
MARCH/APRIL 2015—VOL. 70, NO. 2
The Universal Soil Loss Equation (USLE) is the method commonly used to estimate field long term soil erosion rates under different management practices. The method was developed by Wischmeier and Smith (1965) using data from experimental plots in the United States, but the method has since been applied globally (Sonneveld and Nearing 2003). SWAT estimates soil erosion and sediment yield using the Modified Universal Soil Loss Equation (MUSLE) (Williams 1975). While MUSLE uses runoff amount to simulate erosion and sediment yield, the USLE (Wischmeier and Smith 1978) uses rainfall as an indicator of erosive energy.This modification reportedly increases prediction accuracy, eliminates need for a sediment delivery ratio, and enables computation of sediment yield estimates for single storms (Wang 2009). Sediment yields of each HRU are routed to the channel of the corresponding subbasin with sediment transport in the channel being controlled by simultaneous operation of two processes: erosion, and deposition. SWAT uses Williams (1980) simplified version of the Bagnold (1977) definition of stream power to develop a method for determining channel degradation as a function of channel slope and velocity. The maximum amount of sediment transportable from a channel segment is simulated as a function of the peak flow rate. Borah and Bera (2004) in their evaluation of watershed-scale models concluded that SWAT is suitable for continuous simulations in agricultural watersheds. The flexible framework in SWAT allows simulation of a wide range of conservation practices—filter strips, grassed waterways, and grade stabilization structures—most of which are simulated with straightforward parameter changes (Gassman et al. 2007). Arabi et al. (2007) proposed standardized approaches for simulating specific conservation practices in the model. SWAT was selected for this study because it is in the public domain, is user-friendly in handling input data, simulates actual land management processes in watersheds, has good user support, and integrates both water and sediment yield, which were of interest in this study. The model has also been successfully applied in large watersheds and in data poor regions of the world (Schuol et al. 2008). After calibration, the model can be applied at different spatial resolutions and levels of details providing a semispatially
distributed output of sediment sources and sinks. This gives the model strong potential for use in scenario studies of changing land use and management scenarios (Tripathi et al. 2003). The objective of this paper is to demonstrate how distributed erosion modeling together with limited measured sediment data and field surveys can be used to evaluate the impacts of land use and management scenarios on water and sediment yield. It presents an assessment of the potential of various BMPs to reduce sediment inflow to Sasumua Reservoir. Weather, Streamflow, and Sediment Data. Three stations within the watershed, Njabini Farmers Training Centre (9036152), South Kinangop Forest Station (9036164), and Sasumua Dam Station (9036188) (figure 3), with daily records spanning 1970 to 2010, were used in the simulation. Relative humidity and wind speed data needed for the calculation of potential evapotranspiration by the Penman-Monteith method were obtained from Sasumua Dam Station. Daily maximum and minimum temperature and solar radiation data for use with the model’s weather generator were obtained from Kimakia Meteorological Station (9036233) located about 30 km (19 mi) from the center of the watershed but within the same climatic zone. The weather generator enabled simulation of missing data, filling of data gaps, and extension of time series of daily data based on monthly statistics. Daily changes in reservoir volume and abstractions to Sasumua water treatment plant (table 1 and figure 3) were obtained from Sasumua Dam office. No measured long-term sediment data exists for the rivers draining the watershed. However, a previous modeling study using SWAT in the Upper Tana basin in which Sasumua Watershed is located which gave erosion rates of 18 t ha–1 y–1 (16,059 lb ac–1 yr–1) for cropped areas (Hunink et al. 2011). This was used to limit the MUSLE parameters (table 2) during sediment simulations until the simulated erosion rate closely matched 18 t ha–1 y–1. Other studies on sediment yield using different approaches have yielded almost similar results for areas under mixed cultivation: 12.5 t ha–1 y–1 (11,152 lb ac yr–1) (Mbugua 2009) and 134 t ha–1 y–1 (119,551 lb ac–1 yr–1) (Angima et al. 2002). Other SWAT Inputs. The Digital Elevation Model (DEM) required for watershed boundary delineation and modeling
JOURNAL OF SOIL AND WATER CONSERVATION
Copyright © 2015 Soil and Water Conservation Society. All rights reserved. Journal of Soil and Water Conservation 70(2):75-90 www.swcs.org
of water entering the reservoir. To account for all upstream abstractions (legal and illegal) and known and unknown sinks of water, we assumed that only 60% of water simulated from the three subwatersheds enters the reservoir. The streamflow simulated by the model was therefore reduced by 40% at the reservoir inlet. Daily inflow volumes were converted to flow rates in order to generate streamflow values for use in model calibration and validation. A staff gauge was also installed on Sasumua River at the Nairobi-Njabini Bridge as part of the study, and current meter gauging was done during different flow conditions in order to develop a rating equation for the gauge. Flow measurements were then carried out over a one year period from January 16, 2010, to January 16, 2011, to further validate the model. Modeling Approach. The SWAT model (Arnold et al. 1998) was used to predict stream flow, soil erosion, and sediment yield. The model allows simulation of erosion processes based on soil type, topography, land use, and climatic data with a relatively high level of spatial detail necessary for decision support. For spatial discretization of the watershed, the model applies the concept of hydrological response units (HRU) (Neitsch et al. 2002)— portions of a subbasin possessing unique land use, management, and soil attributes. The model applies the water balance equation as a driver of all processes in a watershed (Neitsch et al. 2005); hence adequate calibration of water balance is a prerequisite for its successful application. Watershed hydrological cycle is divided into land and routing phases.While the land phase controls the amount of water, sediments, nutrients, and pesticides entering the main channel, the routing phase controls their movement through the channel network to the outlet (Neitsch et al. 2005). Surface runoff for each HRU is calculated in SWAT using the Soil Conservation Service (SCS) curve number method (USDA SCS 1972) aggregated for each delineated subbasin and routed though the stream network using a variation of the kinematic model. The method indicates the runoff potential of an area for a combination of land use characteristics and soil types. Runoff peak rate is calculated with the rational method modified for the HRU concept (Neitsch et al. 2002).
Table 1 Climate and reservoir inflow data used Source/station code and name
Variable
Start year
End year
Years of record
9036188– (Dam) 9036233– (Kimakia) 9036 [152,164,188]– Farmers Training Center, Forest and Dam stations Sasumua Dam office records Kiburu exit pipe records Gauge SA1 records SA1
Relative humidity Wind speed Solar radiation Max and minimum temperature Rainfall
1985 1985 1974 1974 1970
2010 2010 1984 1984 2010
26 26 11 11 41
Reservoir inflow Reservoir inflow Flow data Flow data Total suspended sediments concentration
1985 1970 1987 January of 2010 January 16, 2010
1996 1977 1992 December of 2011 April 26, 2010
12 8 6 2 100 days
A 10 m resolution digital elevation model of the watershed. 240000
9928000
232000
9928000
Legend Reservoir Rivers Watershed
Elevation (m) 99200000
232000
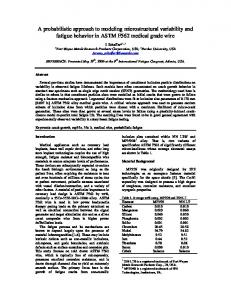
with SWAT was derived from 20 m (65.6 ft) interval contour lines using ArcGIS 9.3 (Cadell 2002). The contour lines were digitized from 1:50,000 survey of Kenya topographic map sheets, which was the finest resolution available. The result was a 10 m (32.8 ft) resolution DEM. The fine resolution DEM was intended to improve watershed delineation results and dimensioning of geomorphological parameters in order to properly capture topographic
JOURNAL OF SOIL AND WATER CONSERVATION
240000
Low: 2,200 0
2,500
5,000 m
N
9912000
9912000
99200000
High: 3,900
Copyright © 2015 Soil and Water Conservation Society. All rights reserved. Journal of Soil and Water Conservation 70(2):75-90 www.swcs.org
Figure 2
variability within the watershed. After identification and infilling of sinks, the watershed boundary was delineated from the larger DEM using SWAT2005.The DEM was used in the analysis of land surface characteristics and drainage patterns (figure 2). While delineating the watershed using the DEM, a digitized rivers layer was used to segment the watershed into hydrologically connected subwatersheds. The rivers layer helped predict stream locations where the DEM was
unable to accurately predict their location, especially in the flat areas of the watershed. Watershed delineation was performed by the preprocessing module of SWAT using a user defined critical source area (CSA) of 200 ha (494.2 ac) which provided a balance between sufficient detail and number of subbasins that could be handled comfortably. The CSA controls the number of subbasins and channel network density. The result was a watershed of 13,481 ha (33,251 ac), with
MARCH/APRIL 2015—VOL. 70, NO. 2
79
Table 2 Ranges and values of flow and sediment calibration parameters. Parameter
Description
Range
Calibrated/value used
CN
Initial SCS runoff curve number to moisture condition II
30 to 100
53 to 88
EPCO
Soil evaporation compensation factor
0.01 to 1.00
GW_DELAY
Groundwater delay (days)
0 to 500
36
GWQMN
Threshold depth of water in shallow aquifer required before groundwater flow will occur (mm)
0 to 5000
500
CUSLE
USLE cover factor
0.001 to 0.5
0.30 to 0.35
PUSLE
USLE support practice factor
0.00 to 0.65
0.30 to 0.35
80
MARCH/APRIL 2015—VOL. 70, NO. 2
resolution to be critical for SWAT simulations of the 21.3 km2 (13.2 mi2) Goodwin Creek Watershed in Mississippi. Chaplot (2005) found SWAT surface runoff and sediment predictions to be sensitive to the choice of DEM mesh size for the Walnut Creek Watershed in central Iowa. Spatial information on land cover was obtained from a 1995 Landsat image at 30 × 30 m (98.4 × 98.4 ft) horizontal resolution in GIS format obtained from the World Agroforestry Centre (ICRAF). This was georeferenced to remove any spatial displacement and radiometrically corrected to eliminate any atmospheric anomalies. Using a combination of fieldwork data, local knowledge, and data from several sources, training sites were selected and used in maximum likelihood classification method (Richards 1999) to produce 12 classes of land cover in the watershed and adjacent areas (figure 4). This image period was selected because coincident weather, rainfall and reservoir volume, and abstraction data were available, and there was need to adopt a common data period for model development. Land cover being an important input in SWAT should be contemporaneous with flow data (Wu and Johnston 2007). Di Luzio et al. (2005) found land use resolution to have significant effects for SWAT simulations of the 21.3 km2 (13.2 mi2) Goodwin Creek Watershed in Mississippi. The land cover map resolution used in this study was considered accurate enough to give realistic sediment yield data and to help pinpoint land management strategies. The digital soil map used for this study was clipped from the soil and terrain based map of Kenya developed by the International Soil Reference and Information Centre (Batjes and Gicheru 2004) at a scale of 1:1,000,000 and included data on soil depth, texture of each soil layer, and available water capacity. Although high-resolution soil maps generate more accurate sediment estimations,
they are costly to obtain because of the numerous soil observations and laboratory analysis required in making them. SWAT requires soil property data for different layers of each soil type (Setegn 2008). The soils data was processed into GIS layers for use with the model, and a user table specific for Sasumua Watershed soil layer was appended to the soil table in the SWAT database. This was because the soil types found in the study area are not included in the US soils database. Di Luzio et al. (2005) found soil input resolution effects for SWAT simulations of the 21.3 km2 (13.2 mi2) Goodwin Creek Watershed in Mississippi to be insignificant. They concluded that the scale of the soils map used in model simulations had little impact on model results. Model Setup. The SWAT ArcView interface (DiLuzio et al. 2002) was used to derive model parameters from GIS data layers, create parameter files, partition the watershed into subbasins, and to delineate the channel network. These together with climatic data were used to prepare SWAT input parameters. The interface was also used to specify the CSA that controlled the number of subbasins and channel network density. Each subbasin was further subdivided into one or more HRUs representing unique combinations of land use and soil types. HRUs are defined based on user specified land use and soil area distribution thresholds (Arnold et al. 1998). Multiple HRUs approach was used in this study, and for computational efficiency, HRUs that covered less than 20% of each subbasin were merged with others, which resulted in 66 HRUs distributed over 41 subbasins. Modeling accuracy increases when subbasins are modeled with multiple HRUs (Haverkamp et al. 2002). Jha et al. (2004) found stream flow simulation in SWAT to be insensitive to changes in the number of subbasins but to be affected by HRUs characteristics since both surface and subsurface runoff are generated at HRU level.
JOURNAL OF SOIL AND WATER CONSERVATION
Copyright © 2015 Soil and Water Conservation Society. All rights reserved. Journal of Soil and Water Conservation 70(2):75-90 www.swcs.org
an average subbasin area of 2.4% and 41 subbasins. Jha et al. (2004) demonstrated that to adequately predict sediment yields average subbasin area should be 2% to 5% of the total watershed area. Subbasin size affects the homogeneity assumption, since large subwatersheds are likely to have variable conditions. Bingner et al. (1997) found predicted sediment yields to be sensitive to the number of subbasins. Goodrich (1992) showed changes in drainage density to affect accuracy of runoff predictions. A low drainage density means only a small proportion of detached material reaches the river channel. A drainage density of 0.78 km km–2 was adopted in this study. Mamillapalli et al. (1996) obtained improved accuracy of flow predictions by increasing the number of subbasins. They reported that different thresholds are required for different indicators. Water and sediment yield were the indicators of choice in this study. The delineated watershed boundary was used to clip the watershed specific DEM. The choice of DEM resolution is important because of its effect on topographic parameters, runoff, and sediment yield. High resolution DEMs give a more realistic definition of subbasin boundaries, topographic input, and simulated outputs (Blöschl and Sivapalan 1995). Zhang and Montgomery (1994) suggested a spatial resolution of 10 m (32.8 ft) to represent hydrologic processes based on simulations with TOPMODEL. Bosch et al. (2004) found SWAT streamflow estimates for a 22.1 km2 (13.7 mi2) subwatershed of the Little River Watershed in Georgia to be more accurate when using high resolution topographic data versus low resolution data obtained from BASINS. Cotter et al. (2003) reported that DEM resolution was the most critical input for a SWAT simulation of the 18.9 km2 (11.7 mi2) Moores Creek Watersheds in Arkansas, and provided minimum DEM resolution recommendations to obtain accurate flow and sediment estimates. Di Luzio et al. (2005) found DEM
0.95
Figure 3 Subwatersheds contributing to Sasumua Reservoir.
Chania 20.23 km2
9928000
240000
9928000
232000
Legend Intake Gauging stations T/Works Rain gauges Chania tunnel
SA1 MIN1
Sasumua Chania Kiburu Watershed
KIB1 9036188
Rivers 9920000
9036164
Kiburu diversion
Reservoir
9036152
Kiburu 19.30 km2
0
232000
2,500
5,000 m
N
240000
Figure 4 Land cover and land use types based on a 1995 Landsat image. 240000 9930000
232000
9930000
Legend Town Roads Watershed
Copyright © 2015 Soil and Water Conservation Society. All rights reserved. Journal of Soil and Water Conservation 70(2):75-90 www.swcs.org
9920000
Sasumua 67.44 km2
9920000
9920000
1995 land cover types Agriculture Bare land Dam boundary Degraded forest Forest Moorland Riverine Roads Swamp Urban Water Woodlots 0
232000
JOURNAL OF SOIL AND WATER CONSERVATION
3,100
N
6,200 m
240000
MARCH/APRIL 2015—VOL. 70, NO. 2
81
82
MARCH/APRIL 2015—VOL. 70, NO. 2
erosion rate closely matched the estimated annual rate of 18 t ha–1 y–1 (16,059 lb ac–1 yr–1) (Hunink et al. 2011) for the area which was achieved by constraining MUSLE parameters during calibration. In addition, daily total suspended sediment (TSS) concentration measurements were taken (100 days) at station SA1 (figure 3) simultaneous to flow measurements and compared with simulated sediment values at the same point. Model Performance Evaluation Methods. Three performance indicators commonly used for the evaluation of watershed models (Moriasi et al. 2007) were used. These were the r 2, ENS (Nash and Sutcliffe 1970), and percent bias (PBIAS) (Gupta et al. 1999). The r 2 indicates the strength of the relationship between observed and simulated values, while ENS measures how well the simulated and observed data correspond. A value of one indicates a perfect fit. Percent bias (PBIAS) measures the average tendency of simulated data to be larger or smaller than their observed counterparts (Gupta et al. 1999). For PBIAS, values of 10% to 20% are considered acceptable depending on the desired level of accuracy. The coefficient of determination and ENS values equal or greater than 0.65 and 0.5 are considered satisfactory during the calibration and validation, respectively (Moriasi et al. 2007). Percent bias values suggested by Moriasi et al. (2007) were used in this study. The validated model was used to simulate annual erosion rates in farmed areas of the watershed for a 41-year period (1970 to 2010) based on coincident period of available data. This formed base scenario for simulation of BMPs. Urban areas in the watershed were not adequately simulated by the model as the focus of the study was to quantify the effectiveness of agricultural BMPs, and they covered only a small part of the watershed. Identification of Hot Spots. The baseline scenario represents current land use and land management conditions and was based on the previously described data sets and calibration efforts. The baseline erosion rate and sediment yield is calculated from the 41-year model output (1970 to 2010). Two indicators were used to characterize sediment dynamics in the watershed and to identify and prioritize erosion hot spots. These were erosion rate (t ha–1 y–1) and sediment yield in stream network (t y–1). Hot spots identified on the basis of average annual sediment yields simulated using SWAT were
validated with random measurements of TSS concentration and catchment transects walks. Simulated annual erosion rates for each subbasin were ranked according soil erosion classes described by Singh et al. (1992). The model was then used to simulate appropriate management practices based on literature review on past similar studies, existing site conditions, and farmer preferences as indicated during a past socioeconomic study in the area. Simulation of Best Management Practices. The potential of the proposed conservation interventions to reduce soil erosion and reservoir sediment inflow was assessed by incorporating the corresponding parameter changes into the model. The output was compared with the baseline scenario to assess the effectiveness of each measure. Impacts of conservation practices on water quality were evaluated in terms of impacts on erosion rates at subbasin level and sediment yield at the reservoir inlet. In general, the practices were classified into two groups: practices installed on upland areas, such as contour farming, parallel terraces, and vegetative filter strips; and those installed within channel network, such as grassed waterways. Upland practices were implemented in steep cultivated areas of the watershed while within-channel practices were installed within drainage ditches/streams with different geomorphologic characteristics. Filter Strips. Filter strip width parameter (FILTERW) in SWAT was adjusted to simulate this conservation practice. Sasumua reservoir has a buffer strip upstream of Sasumua and Ming’utio rivers managed by Nairobi City Water and Sewerage Company (NCWSC), which is uncultivated, and subbasins falling in it were not simulated with BMPs. A sensitivity analysis on the effect of filter strip width on surface runoff and sediment yield was carried out by varying the filter strip width at intervals of 5 m (16.4 ft). During each simulation, sediment loading at reservoir inlet (outlet of subbasins 35 and 36) was determined. The effectiveness of filter strips in sediment yield reduction in SWAT is based on the trapping efficiency (Neitsch et al. 2005; Arabi et al. 2008), which is computed as: trapeff_sed = 0.367 × FILTERW 0.2967, (2) where trapeff_sed is the efficiency of trapping sediments and FILTERW is the width of the filter strip (m).
JOURNAL OF SOIL AND WATER CONSERVATION
Copyright © 2015 Soil and Water Conservation Society. All rights reserved. Journal of Soil and Water Conservation 70(2):75-90 www.swcs.org
Hydrological response unit modifications that affect distribution of simulated land use, soils, and other landscape characteristics will therefore affect predicted stream flows. Model Calibration and Validation. The calibration and validation of erosion models is difficult due to the dynamic and nonlinear responses that characterize basin-scale sediment transport. Issues of concern when setting up such a model are: scarcity of data on extreme events; different levels (temporal and spatial) of available data; model representation of all relevant erosion processes; and field measurement of all forms of sediment transport, including bedload and mass movement. Addressing these issues requires a multistep calibration approach in which field data on discharge and sediment transport from various points in time and space are taken into account. The first step involved calibrating the model for stream flow as this dominates the erosion and sediment transport to Sasumua reservoir. This was done based on a monthly time-series calculated from the reservoir water balance (1989 to 1992). Parameters were systematically varied during calibration as guided by sensitivity analysis results, which identified parameters most responsive to the ratio of fast runoff/ baseflow. Calibration was done manually and followed the procedure outlined in the SWAT user manual (Neitsch et al. 2002), with calibration for water balance and stream flow being done initially for average annual conditions and parameters later fine-tuned using monthly data.The first two years (1987 to 1988) were used as a “warm-up” period in which the model conditions were established. Calibration parameters adjusted for surface runoff were mainly the curve number (CN) and soil evaporation compensation factor (ESCO), while those for base flow proportioning were threshold depth of water in the shallow aquifer required for return flow to occur (GWQMN), plant uptake compensation factor (EPCO), and ground water delay (GW_DELAY). Flow calibration consisted of ensuring (a) the simulated flow matched the estimated flow; (b) there was proper proportioning of the simulated flow between surface runoff and base flow (30:70); and (c) simulated evapotranspiration closely matched the mean annual value of 1,100 mm (43.3 in) (Woodhead 1968). Sediment calibration consisted of ensuring that the simulated
Table 3
JOURNAL OF SOIL AND WATER CONSERVATION
PUSLE Land slope (%)
Contour farming
Strip Terracing cropping Type 1
Type 2
1 to2 0.60 0.30 0.12 0.05 3 to 5 0.50 0.25 0.10 0.05 6 to 8 0.50 0.25 0.10 0.05 9 to 12 0.60 0.30 0.12 0.05 13 to 16 0.70 0.35 0.14 0.05 17 to 20 0.80 0.40 0.16 0.06 21 to 25 0.90 0.45 0.18 0.06 Notes: Type 1 = graded channel sod outlet. Type 2 = Steep backslope underground outlets.
Table 4 Typical dimensionless variable y values (NRCS 2009).
Soil erodibility factor (K)
Ground cover
0 to 0.2
0.2 to 0.28
0.28 to 0.64
10% 40% 80%
0.75 0.98 1.20
0.53 0.75 0.98
0.30 0.53 0.75
were reduced by six units from calibration values. The value of six was selected based on the values for curve numbers for different practices given in Neitsch et al. (2005). The CN values obtained were more or less equal for the contoured and terraced values in Neitsch et al. (2005), which are based on treatment and hydrologic soil group. Arabi et al. (2008) reduced CN by six units to represent terraces, while Bracmort et al. (2006) used the values for contoured and terraced conditions from the SWAT users’ manual (Neitsch et al. 2002), which are the same as that in Neitsch et al. (2005). PUSLE values for terracing type 1 (graded channels sod outlets) were used depending on the average HRU slope (table 3). Spacing is an important consideration in the design of terraces, and slope length is equal to terrace spacing (Neitsch et al. 2005) and horizontal interval. The horizontal interval method commonly used in the calculation of terrace spacing (USDA NRCS 2009) was adopted in this study to adjust HRUs slope length: HI = (xs + y)×(100/s), (3) where HI is the horizontal interval (m) equal to SLSUBBSN, s is slope of the HRU, and x is a dimensionless variable ranging from
0.12 to 0.24. A low value 0.12 is used for high rainfall areas and a high value of 0.24 for low rainfall areas. A dimensionless variable y with values of 0.3 to 1.2 is also used. A low value of 0.3 is used for highly erodible soils with tillage systems that provide little or no residue cover while a high value 1.2 is used for erosion resistant soils with tillage systems that leave a large amount of residue on the surface (USDA NRCS 2009; Arabi et al. 2008).This variable is related to the USLE erodibility factor (KUSLE) and USLE cover management factor, (CUSLE). Typical y factor values are as given in table 4. Sasumua subwatershed comprises of planosols, acrisols, and phaeozems with soil erodibility factors of 0.30 to 0.38 (Batjes and Gicheru 2004). The major crops—cabbages and potatoes— provide little ground cover, while hand tillage, the most common form of land preparation, leaves no residue. The little residue available is used as livestock feed. A y value of 0.5 extrapolated from an assumed ground cover of 40% was adopted in this study. Since the watershed receives a high rainfall an x value of 0.18 was adopted. Grassed Waterways. To represent implementation of grassed waterways, channel width (CH_W2), channel depth (CH_D), channel Manning’s roughness coefficient (CH_N2), and channel cover factor (CH_
MARCH/APRIL 2015—VOL. 70, NO. 2
Copyright © 2015 Soil and Water Conservation Society. All rights reserved. Journal of Soil and Water Conservation 70(2):75-90 www.swcs.org
Contour Farming. To simulate the effect of contour farming, CN and USLE practice factor (PUSLE) were modified. Soil Conservation Service curve number models the processes of infiltration and generation of surface runoff (Sahu and Gu 2009). A decrease in CN reduces surface runoff and sediment yield. The PUSLE defines the ratio of soil loss with a specific support practice to the corresponding loss with up and down cultivation. Support practices include contour tillage, strip cropping on the contour, and terrace systems.This parameter has been found to be sensitive to sediment yield (Ullrich and Volk 2009) with a decrease in PUSLE resulting in sediment yield reduction. To represent this conservation practice, the CN was decreased by three units from calibration values (Arabi et al. 2008). PUSLE was adjusted depending on HRU slope according to table 3 adapted from Wischmeier and Smith (1978) that gives recommended PUSLE values for contour farming, strip cropping, and terracing. Transect walks in the watershed revealed existing conservation practices, such as rows of grass planted on contour bunds. A PUSLE value of 0.9 rather than 1 was therefore adopted at base simulation to account for these existing soil conservation measures. PUSLE values for the target subbasins were therefore reduced from the base simulation value of 0.9 during simulation to represent various conservation practices. One often-cited challenge in the adoption of contour farming is that on very steep slopes water can accumulate at low points and then break through to form large rills or gullies (Quinton and Catt 2004). The USDA (USDA NRCS 2006) therefore recommends implementation of contour farming on land slopes of 3% to 10%. Contour farming was therefore simulated where mean subwatershed slope was 11%. Parallel Terraces. Parallel terraces were simulated by adjusting slope length within subbasins (SLSUBBSN), PUSLE, and CN (Arabi et al. 2008). In SWAT, slope length is represented by parameter SLSUBBSN and adjusting it downwards represents reduced slope length. The reduced soil loss was factored in by reducing USLE practice factor in the MUSLE equation. Improved infiltration of water in the soil is represented by reducing the CN. Implementation of terraces affects all these processes together, thus all the parameters were adjusted simultaneously in a single simulation. Curve number values
Universal Soil Loss Equation practice (PUSLE) factor values for contour farming, strip cropping, and terracing (Wischmeier and Smith 1978).
83
84
MARCH/APRIL 2015—VOL. 70, NO. 2
Apr. 26, 2010
Apr. 16, 2010
Apr. 4, 2010
Mar. 27, 2010
Mar. 17, 2010
Mar. 7, 2010
Feb. 25, 2010
Feb. 15, 2010
Feb. 5, 2010
Jan. 26, 2010
200 180 160 140 120 80 60 40 20 0
Jan. 16, 2010
(a)
Sediment concentration (mg L–1)
Validation hydrograph for sediment simulation based on 100 days total suspended sediments (TSS) measurements.
Day of measurement/simulation Legend Measured
(b)
Simulated sediments (mg L–1)
Results and Discussion The range of parameter and calibrated values used in this study are presented in table 2. The calibrated ESCO, CN, GWQMN, and GW_DELAY values were based on water balance component proportions for evapotranspiration and surface and baseflow stated in the methods section in addition to optimizing simulated streamflow for r 2, ENS, and PBIAS statistics.These calibration parameters and the rest of the parameters used in this study resulted in average simulated evapotranspiration value of 973 mm (38.3 in) against an annual value of 1,100 mm (43.3 in), which is 81% of the average annual precipitation of 1,200 mm (47.24 in). They also resulted in simulated surface runoff of 199 mm (7.8 in) and baseflow of 470 mm (18.5 in). The simulated annual surface runoff and baseflow were 30% and 70% of the measured mean annual streamflow, respectively. The simulated average annual erosion rate for the agricultural HRUs was 18.4 t ha–1 y–1 (7.4 tn ac–1 yr–1 ), while the average for the entire watershed was 10.3 t ha–1 y–1 (4.2 tn ac–1 yr–1), which are within estimated erosion rates for the area (Hunink et al. 2011; Archer 1996). The average annual watershed sediment yield was 9 t ha–1 (3.6 tn ac–1), which is within the range of reported annual sediment yield of 5 to 14 t ha–1 (2 to 5.7 tn ac–1) (Hunink et al. 2009). The calibrated KUSLE and PUSLE ranged from 0.3 to 0.35 and 0.9 to 1, respectively. Model validation using measured TSS concentration also gave good
Figure 5
240 220 200 180 160 140 120 100 80 60 40 20 0
Simulated
y = 1.2427x + 16.101 r 2 = 0.54
0
30
60
90
120
150
180
Measured sediments (mg L–1)
results with an r 2 of 0.54 although the duration of measurement was short (figure 5).The reservoir water balance approach adopted for estimating reservoir inflow was satisfactory as shown by calibration and validation results. Simulated and measured flow hydrographs (figures 6 and 7) show the model predicted monthly average flows well. The reservoir volume graph shows high peaks preceded by drought when the reservoir volumes are low before the onset of rains (figures 6 and 7). Calibration statistics were 0.8, 0.74, and ± 4.6%, for r 2, ENS, and PBIAS, respectively. The mean and standard deviations for the observed and simulated flows were 1.27
and 1.33 m3 s–1 (44.85 and 47.67 ft3 s–1) and 1 and 1.13 m3 s–1 (35.31 and 39.91 ft3 s–1), respectively. Simulated flows matched measured values better during validation (figure 7) with higher r 2, ENS, and PBIAS values of 0.85, 0.81, and ±5.7%, respectively. Spatial Distribution of Sediment Yield. The erosion rates were used to produce an erosion map, which was overlaid on a land cover map to show the prevailing land cover/ uses in hot spot areas (figure 8). As can be seen, large spatial differences exist in erosion rates with forested areas having least erosion rates, while a small area contributes most of the sediments (figure 8). Of the
JOURNAL OF SOIL AND WATER CONSERVATION
Copyright © 2015 Soil and Water Conservation Society. All rights reserved. Journal of Soil and Water Conservation 70(2):75-90 www.swcs.org
COV) were adjusted in channel segments where grassed waterways were to be installed. Channel Manning’s roughness coefficient was adjusted to represent the type and density of vegetation expected in the waterway. Fiener and Auerswald (2006) assumed CH_ N2 values of 0.3 to 0.4 over the year, while a value of 0.1 was suggested for grassed waterways under poor conditions. These values are typical in cases of dense grass and herbs under nonsubmerged conditions (Abu-Zreig 2001). Channel cover factor was adjusted to 0.001 (to represent fully covered condition). This value was chosen arbitrarily to avoid using default SWAT values. Channel width and depth were selected based on site conditions. Channel Manning’s roughness coefficient of 0.3 (0.98 ft), CH_W2 of 2.5 m (8.2 ft), and CH_D, of 0.3 m (0.98 ft) were adopted in subbasins 21, 22, and 26; but in subbasin 24, the channel width CH_W2 was increased to 3 m (9.84 ft) to accommodate increased flows. However, the depth was kept constant at 0.3 m.
Figure 6 6.00 5.00 4.00 3.00 2.00
July 1992
Oct. 1992
Apr. 1992
Jan. 1992
July 1991
Oct. 1991
Apr. 1991
Jan. 1991
July 1990
Oct. 1990
Apr. 1990
Jan. 1990
July 1989
Oct. 1989
Apr. 1989
1.00 Jan. 1989
18.0 16.0 14.0 12.0 10.0 8.0 6.0 4.0 2.0 0.0
Stream flow (m3 s–1)
(a)
Reservoir volume (million m3)
Calibration hydrograph and scatter plot at reservoir inlet.
0.00
Legend
(b)
Simulated flow (m3 s–1)
Res_Volume
5.5 5.0 4.5 4.0 3.5 3.0 2.5 2.0 1.5 1.0 0.5 0.0 0.0
Observed
Simulated
y = 1.0073x + 0.0496 r 2 = 0.80
1.0
2.0
3.0
4.0
5.0
6.0
Observed flow (m3 s–1)
agricultural subbasins, 52% fell under very high soil loss class (20 to 40 t ha–1 y–1 [8 to 16 tn ac–1 yr–1]), while 48% fell under high erosion class (Singh et al. 1992; table 5). No subbasin fell under the severe or very severe classes. This may be attributed partly to the moderate slopes in the watershed and the stabilization of the watershed by the existing soil and water conservation practices. A similar trend was noted during measurements of TSS concentration at various points in the watershed during the wet season where Ming’utio River fed by subbasins 21, 22, and 24 showed the highest TSS values. Subbasins with high sediment yields were not located entirely on steep slopes as might be expected. Rather, the low lying areas subbasins 21, 22, 24, and 26 (table 5 and figure 8) generated the highest amount of sediments (>10 t ha–1
JOURNAL OF SOIL AND WATER CONSERVATION
y–1 [4 tn ac–1 yr–1]). This is due to the presence of poorly drained planosols, which have a high surface runoff and hence erosion rate. Forested subbasins (5, 6, 8, and 9) generated least sediment yields (< 7.3 t ha–1 y–1 [2.5 tn ac–1 yr–1]), highlighting the importance of tree cover in protecting the soil from erosion (World Agroforesty Centre 2006). Similar results were reported by Hunink et al. (2013) who found erosion rates of 10 t ha–1 y–1 (4 tn ac–1 yr–1) for areas under subsistence farming in the Upper Tana basin. An earlier study by Archer (1996) in the same area also reported similar trends and values. These erosion rates and sediment yields show that vegetative and agronomic measures can be adequate to reduce erosion rate and sediment yield to acceptable levels, and structural measures may not be necessary.
MARCH/APRIL 2015—VOL. 70, NO. 2
Copyright © 2015 Soil and Water Conservation Society. All rights reserved. Journal of Soil and Water Conservation 70(2):75-90 www.swcs.org
Simulation month
Impact of Filter Strips. Reduction in sediment yield as a function of VFS width was not linear (figure 9). There was higher reduction in sediment loading in the initial 5 m (16.4 ft) wide adjustments than in the last ones.This trend is similar to results from other studies (Arabi et al. 2008;Yuan et al. 2009). It showed the optimum width for effective reduction in sediment loading to be about 30 m (98.4 ft). Other factors that influence sediment trapping efficiency include slope, vegetation, inflow rate, and particle size. Trapping efficiency has been found to increase with increase in vegetation cover and to decrease with an increase in inflow rates (Fox et al. 2010) and slope (Gilley et al. 2000). By altering some of these variables, the effectiveness of the filters can be enhanced. Based on equation 2, a filter width of 30 m (98.4 ft) has a trapping efficiency of 1 (Parajuli et al. 2008), representing a sediment yield reduction in the target subbasins of 100%. This is possible if the filter strips are implemented in the entire watershed. In this study, BMPs were implemented only in the agricultural part of the watershed, excluding forests and uncultivated riparian areas. Implementation of a 10 m (32.8 ft) filter strip reduced sediment inflow to the by 35%, while a 30 m (98.4 ft) filter strip reduced by 48% (table 6) from the baseline value of 40,934 t y–1 (90,243,096 lb yr–1). A combination of 10 m filters strips in the sloping areas and a grassed waterway in the flat areas reduced sediment inflow by 73% (table 6) and is recommended for the watershed due to small land holdings. This implementation is represented by (figure 10) and excludes the riparian area. Impact of Grassed Waterway. Simulation of a grassed waterway installed in the flat planosols area (subbasins 20 to 26) reduced sediments entering the reservoir by 54% (table 6) showing its potential as a conservation measure. However, grassed waterways occupy relatively big areas and are therefore not popular with farmers where land parcels are small as they take agricultural land out of production. Grassed waterways showed no impact on subbasin sediment yield (table 7) and surface runoff, and their impact in reducing soil erosion at HRU level was minimal. Their main impact was in reducing channel erosion and increasing sediment deposition. This is because they are installed within the channel network. Terraces and grass filter strips were most effective at subbasin level and hence may be more useful to farmers in reducing soil erosion.
85
Figure 7
Apr. 1996
Jan. 1996
Oct. 1995
July 1995
Apr. 1995
Jan. 1995
Oct. 1994
July 1994
Apr. 1994
Jan. 1994
Oct. 1993
July 1993
Apr. 1993
Jan. 1993
18.0 16.0 14.0 12.0 10.0 8.0 6.0 4.0 2.0 0.0
5.00 4.50 4.00 3.50 3.00 2.50 2.00 1.50 1.00 0.50 0.00
Stream flow (m3 s–1)
(a)
Reservoir volume (million m3)
Validation hydrograph and scatter plot at reservoir inlet.
Legend
(b)
Simulated flow (m3 s–1)
Res_Volume Res Vol
5.0 4.5 4.0 3.5 3.0 2.5 2.0 1.5 1.0 0.5 0.0 0.0
Observed flow
Simulated flow
y = 1.0058x + 0.0653 r 2 = 0.85
Acknowledgements This study was funded by Jomo Kenyatta University of Agriculture and Technology and the Pro-Poor Rewards for Environmental Services (PRESA) project of the World Agro
1.0
2.0
3.0
4.0
5.0
Observed flow (m3 s–1)
forestry Centre (ICRAF) at Nairobi, Kenya.
References Abu-Zreig, M. 2001. Factors affecting sediment trapping in vegetated filter strips: Simulation study using VFSMOD. Hydrological Processes 15:1477-1488.
Impact of Contour Farming and Grassed Waterway. Contour farming reduced surface runoff by 12% and achieved the least (24%; table 6) reduction in sediment inflow to the reservoir. A combination of contour farming implemented in the sloped areas and a grassed waterway implemented in the flat areas showed a combined reduction of sediment inflow to the reservoir of 66% from base simulation (table 6). Impact of Parallel Terraces, 10 m (32.8 ft) Vegetative Filter Strip and Grassed Waterway. Terracing combined with 10 m VFS and grassed waterways reduced sediment inflow by 75% (table 6). Terraces enhance ponding of water on the surface and allow higher rates of infiltration. They reduce surface runoff velocity and hence
86
MARCH/APRIL 2015—VOL. 70, NO. 2
erosive power of water. Terraces also reduce slope length and reduce the peak runoff rate (Arabi et al. 2008), which is directly proportional to soil erosion rate. Implementation of terraces reduced surface runoff by 20% and increased base flow by 12% with only marginal change in total water yield. The enhanced infiltration recharges the shallow aquifer which then releases water to streams as base flow.These results show that terracing would have marginal effect on water yield but a significant effect on partitioning of water balance components.
Angima, S.D., D.E. Stott, M.K. O’Neill, C.K. Ong, and G.A. Weesies. 2002. Use of Calliandra–Napier grass contour hedges to control erosion in Central Kenya. Agriculture, Ecosystems, and Environment 91:15-23. Arabi, M., J.R. Frankenberger, B.A. Engel, and J.G. Arnold. 2008. Representation of agricultural management practices
with
SWAT.
Hydrological
Processes
22:3042-3055. Arabi M., R.S. Govindaraju, and M.M. Hantush. 2007. A probabilistic approach for analysis of uncertainty in the evaluation of watershed management practices. Journal of Hydrology 333:459-471. Archer, D. 1996. Suspended sediment yields in the Nairobi area of Kenya and environmental controls. In Erosion
Summary and Conclusions To effectively target and implement soil erosion control measures to reduce soil erosion and reservoir sedimentation, distributed
and Sediment Yield: Global and Regional Perspectives. Proceedings of the Exeter Symposium, Exeter, UK, July 15-19, 1996, IAHS Publ. no. 236,37–48, eds D.E.Walling and B.W. Webb. IAHS Press: Wallingford.
JOURNAL OF SOIL AND WATER CONSERVATION
Copyright © 2015 Soil and Water Conservation Society. All rights reserved. Journal of Soil and Water Conservation 70(2):75-90 www.swcs.org
Simulation month
erosion modeling can be used as a decision support tool. However, sufficient and accurate data is required to calibrate and validate stream flow and sediment dynamics for the results to be reliable. Calibration and validation results for SWAT show that the adopted approach provides relatively good results, allowing its use in scenario analysis. Evaluation of the impacts of implementation of erosion control measures is a cost-effective way to provide decision makers with information on the effectiveness of certain measures before implementation, potentially leading to higher success rates. In the absence of measured sediment data for calibration and validation, simulations were found to be reasonably good, plausible, and realistic. However, there is need for an aggressive campaign to collect primary flow and sediment data in order to improve plausibility of results. A socioeconomic survey and benefit cost analysis should also be carried out to determine farmers’ preferences and the cost effectiveness of each intervention option. Despite their limitations, the results can be used to guide development of watershed management programs and to evaluate existing management strategies.
Table 5 Simulated baseline subbasin sediment yield classification based on Singh et al. (1992). Subbasin number Area (ha)
Sediment yield (t ha–1 y–1)
17 24* 22* 21* 38 16 07 13 26* Total *Flat slope area.
29.21 27.82 26.07 20.70 14.71 11.77 11.04 11.02 10.14 162.48
0.63 269.77 316.78 400.85 222.81 217.26 47.15 30.35 388.90 1,894.50
Rank Remarks 1 2 3 4 5 6 7 8 9
Very high
Arnold, J.G., and N. Fohrer. 2005. SWAT2000: current capabilities and research opportunities in applied watershed
modelling.
Hydrological
Processes
19(3):563-572. Arnold, J.G., R. Srinivasan, R.S. Muttiah, and J.R. Williams. 1998. Large area hydrologic modelling and assessment
High
Part I: model development. Journal of the American Water Resources Association 34(1):73-89. Bagnold, R.A. 1977. Bedload transport in natural rivers. Water Resources Research 13(2):303-312. Batjes, N.H., and P. Gicheru. 2004. Soil data derived from SOTER studies 1 of carbon stocks and change in Kenya. (GEF-SOC Project; Version 1.0), Technical Report 2004/1. Wageninge: International Soil Reference and Information Centre. Bingner, R.L., J. Garbrecht, J.G. Arnold, and R. Srinivasan. runoff and fine sediment yield. Transactions of
Erosion map overlain on a land cover map.
the American Society of Agricultural Engineers 40(5):1329-1335. Blöschl, G., and M. Sivapalan. 1995. Scale issues in
N
Hydrological
Modelling. A
review. Hydrological
Processes 9:251-290. Bora, D.K., and M. Bera. 2004. Watershed scale hydrologic and non-point source pollution Models: Review of applications. Transactions of the American Society of
5 9
Agricultural Engineers 47(3):789-803. Bosch, D.D., J.M. Sheridan, H.L. Batten, and J.G. Arnold.
6
Legend Rivers
10 11
Riparian area
Sediment yield (t ha–1 y–1)
13 15 23
16
0 to 5 Slight 5 to 10 Moderate
17
10 to 20 High
35
25
24
20 to 40 Very High
37 38
22
Reservoir
14
20 21
8
agricultural watershed. Transactions of the American Society of Agricultural Engineers 47(5):1493–1506. Bracmort, K.S., M. Arabi, J.R. Frankenberger, B.A. Engel, and J.G. Arnold. 2006. Modelling long-term water quality impact of structural BMPs. Transactions of American Society of Agricultural and Biological Engineers 49(2):367-374. Cadell, W. 2002. Report on the generation and analysis of DEMs for spatial modelling. http://www.macaulay. a c. u k / L A D S S / d o c u m e n t s / D E M s - f o r - s p a t i a l modelling.pdf. Chaplot, V. 2005. Impact of DEM mesh size and soil map scale on SWAT runoff, sediment, and NO3−N loads predictions. Journal of Hydrology 312(1-4):207-222. Cotter, A.S., I. Chaubey, T.A. Costello, T.S. Soerens, M.A.
36
26
2004. Evaluation of the SWAT model on a coastal plain
Copyright © 2015 Soil and Water Conservation Society. All rights reserved. Journal of Soil and Water Conservation 70(2):75-90 www.swcs.org
1997. Effect of watershed subdivision on simulation
Figure 8
39
Nelson. 2003. Water quality model output uncertainty as affected by spatial resolution of input data. Journal of the American Water Resources Association 39:977–986. Di Luzio, M., J.G. Arnold, and R. Srinivasan. 2005. Effect of
0
2,500
5,000 m
GIS data quality on small watershed stream flow and sediment simulations. Hydrological Processes 19:629-650. DiLuzio, M.D., R. Srinivasan, and J.G Arnold. 2002. Integration of watershed tools and SWAT model into BASINS. Journal of American Water Resources Association 38(4):1127-1141. Evrard, O., K. Vandaele, B. van Wesemael, and C. L. Bielders. 2008. A grassed waterway and earthen dams to control
JOURNAL OF SOIL AND WATER CONSERVATION
MARCH/APRIL 2015—VOL. 70, NO. 2
87
Figure 9 Variation of sediment yield reduction with filter strip width. of model complexity as a function of basin scale.
Sediment yield reduction (%)
70
In Proceedings of the Workshop on the Effects of Global Climate Change on Hydrology and Water
60
Resources at Catchment Scale, Tsukuba, Japan, February 3-6, 1992, 233-242. Tsukuba, Japan: Japan-
50
U.S. Committee on Hydrology, Water Resources, and Global Climate Change.
40
Gupta, H.V., S. Sorooshian, and P.O. Yapo. 1999. Status of automatic calibration for hydrologic models:
30
Comparison with multilevel expert calibration. Journal of Hydrologic Engineering 4(2):135-143.
20
Haverkamp, S., R. Srinivasan, H.G. Frede, and C. Santhi. 2002. Sub-watershed spatial analysis tool: discretization
10
of a distributed hydrologic model by statistical criteria. Journal of American Water Resources Association
0 0
5
10
15
20
25
30
35
40
45
water credits for the Upper Tana Basin, Kenya. Phase II
Width of filter strip (m)
- pilot operations: biophysical assessment using SWAT. Report Future Water: 84 Hunink J.E., W.W. Immerzeel, P. Droogers, S. Kauffman,
muddy floods from a cultivated catchment of the
control on livestock farms in northeast Iowa.Agriculture,
and G. Van Lynden.2011. Green and blue water
Belgian loess belt. Geomorphology 100:419–428.
Ecosystems, and Environment 117:135–144.
resources for the Upper Tana catchment, Kenya
Fiener, P., and K. Auerswald. 2005. Measurement and
Gassman, P.W., M.R. Reyes, C.H. Green, and J.G. Arnold.
using the Soil and Water Assessment Tool (SWAT).
modelling of concentrated runoff in grassed waterways.
2007. The Soil and Water Assessment Tool: Historical
Green water credits report number 10. Wageningen:
Journal of Hydrology 301:198–215.
developments, applications and future research directions.
Fiener, P., and K. Auerswald. 2006. Seasonal variation of grassed waterway effectiveness in reducing runoff and sediment delivery from agricultural watersheds in
Transactions of American Society of Agricultural and Biological Engineers 50 (4):1211-1250. Gathenya, J.M., G.T. Thiong’o, and J.K. Mwangi .2009.
International Soil Reference and Information Centre. Hunink J.E., I.A. Niadas, P. Antonaropoulos, P. Droogers, and J. De Vente. 2013: Targeting intervention areas to reduce reservoir sedimentation in the Tana catchment (Kenya)
temperate Europe. Soil &Tillage Research 87:48–58.
Hydrologic and water quality assessment report for
using SWAT. Hydrological Sciences Journal 58(3):1-15.
Fox, G.A., R. Munoz-Carpena, and G.J. Sabbagh. 2010.
Sasumua watershed. Technical Report. Word Agro-
Jha M., P.W. Gassman, S. Secchi, R. Gu, and J. Arnold.
Influence
of
flow
concentration
on
parameter
importance and prediction uncertainty for vegetative
2004. Effect of watershed sub-division on SWAT
forestry Centre. Gilley, J.E., B. Enghball, L.A. Kramer, and T.B. Moorman.
filter strips. Journal of Hydrology 384(1–2):164–173.
2000. Narrow grass hedge effects on runoff and soil loss.
Gassman, P.W., E. Osei, A. Saleh, and J. Rodecap. 2006.
Journal of Soil and Water Conservation 55(2):190-196.
Alternative practices for sediment and nutrient loss
flow sediment and nutrient predictions. Journal of the American Water Resources Association 40(3):811-825. Kalin L., and M.M. Hantush. 2003. Evaluation of sediment
Goodrich, D.C. 1992. An overview of the USDA-ARS
transport models and comparative application of
climate change and hydrology program and analysis
two watershed models. EPA/600/R-03/139, 81 pp.
Table 6 Impact of conservation practices on sediment inflow at reservoir inlet. Base line yield Rank Conservation practice (t y–1)
88
Sediment at reservoir Reduction inlet (t y–1) (%)
1
30 m filter strips + grassed waterway
40,934
8,186
80
2
Terraces, 10 m vegetative filter strip + grassed waterway*
40,934
10,235
75
3
10 m filter strips + grassed waterway
40,934
11,052
73
4
Contour farming + grassed waterway
40,934
13,920
66
5
Grassed waterway only
40,934
18,859
54
6
30 m filter strips only
40,934
21,286
48
7
Terraces + 10 m filter strips only
40,934
23,332
43
8
Contour farming and filter strips
40,934
24,151
41
9
10 m filter strips only
40,934
26,607
35
10 Contour farming only 40,934 31,110 *10 m vegetative filer strip installed only in subbasins 20 and 23 where slopes were