Resilient Event Detection in Wireless Sensor Networks Angelika Herbold1, Thierry Lamarre2 , Nirupama Bulusu3 and Sanjay Jha4 1 Western Washington University, USA 2 ENSEIRB, France 3 Systems Software Lab, Department of Computer Science, Portland State University, Portland, OR 97207-0751 USA 4 University of New South Wales, Australia and National ICT Australia Limited, Randwick, Australia
[email protected],
[email protected],
[email protected],
[email protected]
Abstract As wireless sensor networks become widely used, the need to provide fault tolerant, user-friendly middleware for detecting sensed events increases. Our contribution is the motivation, design, implementation and evaluation of ResTAG, which provides fault-tolerant aggregate queries in the popular, user-friendly TinyDB middleware. If a sensor becomes mis-calibrated or physically compromised, the fault-tolerant queries use the network redundancy to reduce the confidence in any report from that sensor. Queries implemented using ResTAG detect faulty nodes within a predictable threshold that depends on both the percentage and failure type of faulty nodes.
1. Introduction Wireless sensor networks are being deployed for diverse sensing applications[1][2][3]. Sensor networks present unique challenges: individual nodes are resourcerestricted, radio communication between nodes is loss prone and a major energy consumer[4], and the networks are tightly coupled to the physical environment. A sensor network must run unattended for long periods of time. Moreover, users are unlikely to be systems programmers, motivating robust sensor middleware that enables userfriendly control and data gathering from a sensor network. In this paper, we address the important challenge of making sensor middleware fault-tolerant. Sensor networks are inherently insecure, and they can easily be snooped or spoofed by introduced malicious nodes. Security in sensor networks is difficult, since security protocols often use extra memory , processor time, and can require larger network packets. Secure communication protocols for sensor networks which provide for authentication, data confidentiality and message integrity do not address the complementary problem of resilience to corrupted sensor data, generated by failed sensors. A possible cause of failures, non-malicious physical sensor error or mis-calibration, is not managed at all by security protocols. This is a very likely failure scenario in a low-security application such as a wildlife monitoring system. In this case the sensor board on a mote becomes physically compromised. An example of this would be dust obscuring the light sensor on a mote, causing it to read lower than expected light levels. In light of the likelihood and importance of nonmalicious failures, and the resource-expensive and
incomplete nature of current security protocols, we find that a more comprehensive solution is data-centric fault tolerance. Instead of securing each node, we attempt to exploit redundant node distribution in the network to provide a confidence value to node reports. Although similar ideas have been studied previously in [5] et al, we have chosen to provide a practical robust implementation of fault tolerance in the popular TinyDB middleware[6]. The TinyDB middleware allows the user to gather data from the network as if it were a relational database. The average user does not need to write embedded code, and can use simple SQL-style language to collect sensor data over time. An implementation of resilient event detection in TinyDB will allow those less technical users to obtain a measure of the reliability of query responses. This implementation, which we call ResTAG, is the major contribution of this work, and the purpose of this paper is to explicate it and demonstrate its effectiveness.
2. Related Work A simple approach to conserve energy and bandwidth in sensor networks is to fuse data packets together as they move from source to sink, and to eliminate redundant information whenever possible. This data fusion is known as in-network aggregation. We review it here. Tiny Aggregation (TAG): One of the most widely used aggregation protocols is TAG, or TinyAGgregation, [6], which is implemented as the core of TinyDB. In TAG, packets are routed to the sink in a tree structure. Sensor data is sent to parent nodes, who aggregate the data with their own, and that of their other children. The tree structure remains in place unless a parent node becomes unavailable, wherein a child chooses a new parent from a list of possible parents. The merging of data at parent nodes works well in TinyDB, which allows the user to query the sensor network using SQLstyle statements. The nature of many aggregate query types allows parent nodes to send only relevant data upstream, rather than send all data from its sub-tree. This dramatically reduces number of packets sent for each query response period, or epoch. TinyDB embedded requirements include an interface for new aggregate queries that the new aggregate must implement. The embedded part of TinyDB is written in nesC[17], using the TinyOS operating system [15]. Our version of resilient event detection is implemented as several new aggregate query
1
types in TinyDB. They use the same TAG routing protocol, but each new aggregate chooses its own data structure(s) and methods for merging new data with the old. Our work builds on the existing TinyDB/TAG framework by providing aggregate query types that deliver confidence values in addition to data readings. Corroborative Aggregation Protocol (CAP): This paper’s approach to resilient event detection is inspired by Byzantine fault tolerance. The Corroborative Aggregation Protocol[5] explores similar ideas. When an event occurs in a sensor network, it is likely that more than one node will detect its occurrence. If several reports generated from the same event are collected, they should reinforce or repudiate the reliability of the report. In [5], the authors describe CAP, in which they “simply quantify credibility of the aggregated report by the number of corroborative individual sensor reports that are fused in the aggregated report”. However, their results were achieved using the ns-2 simulator [18], which does not fully encompass the limitations of real wireless sensor devices. CAP requires more mathematical capability than typical motes have. (eg., floating-point capability, large memory). Moreover, the simplified event model used in [5] assumes that a node only generates a report that represents whether or not an event occurs. Our TinyDB based implementation requires a more complex event model. In TinyDB, the query results are usually one integer value per epoch, which represents the state of all or part of the network. We attempt to expand the ideas from [5] to provide reliable query results with a quantified confidence value, in TinyDB. Our work is a valuable extension of both [5] and [6], wherein the ideas behind CAP are altered to fit into an existing piece of usable software, TinyDB. 3. ResTAG Design 3.1 Event and data models The ResTAG event model is consistent with TinyDB. Sensor data is gathered upon user request, and is repeated every epoch. The epoch length is also user specified. This differs from the event model used in [5], where nodes generate a data report in response to an event occurrence, not upon user request. The data model used is also inherited from TinyDB. For each aggregate query we implemented, the result is the same data type as it would be for the original version of the query, with an additional confidence index. We implemented a resilient MAX, ResMAX, which returns the same maximum as MAX, but with a representative confidence value. The resilient AVG, ResAVG, uses confidences computed in-network to weight the sum as it is fused at the parent nodes. The result of ResAVG is not necessarily the same as AVG, as more weight is assigned to partial results with higher confidences. A final confidence index is also produced. 3.2 ResTAG ResTAG is the fruition of the ideas in [5], combined with the usability and optimizations of TinyDB and TinyAGgregation. It operates in the following
sequence of events. At the request of the user, a resilient query is injected in the network. As TinyDB dictates, the query is pushed down to the bottom of the aggregation tree, the leaf nodes. When a leaf receives data from its own sensor board, it sends the data to its parent. The parent node collects its own data and data from each of its children, in a dynamically allocated array structure. It may do some calculations at each merge, depending on the query type. Before the node sends its data upstream, it calculates disputes and eliminates redundant data. It sends reduced data up to its parent, repeating up the tree. Disputes are generated in a probabilistic fashion, similar to [5]. Since TinyDB offers no built-in localization, motes are programmed with their x and y coordinates. If the sensing area overlaps, then it is determined whether the node agrees with the node in question. If the node agrees, the value of the first node is reinforced with a p-packet. If not, an n-packet may be generated. The calculation of p is discussed in section 4.1. Once p is computed, an n-packet is generated with probability p. The number of p-packets and npackets are accumulated, and the data value is aggregated depending on query type. In ResMAX, the maximum sensor reading is retained regardless of number of p- or n-packets, and number of packets generated in dispute of that maximum is accumulated as it travels up the routing tree. In the ResAVG query, pand n-packets are used to weight the sum that is sent up the tree with the count and packet counts. Once the final calculation of disputes has occurred at the sink, data is sent to the Java reader class associated with the aggregate query type. The average is computed from the sum and count. The p- and n-packet counts of the ResMAX aggregate are converted into a percentage value using the formula: p packets CI 100 p packets n packets This value is reported to the user along with the data value. At each aggregation point, the same formula is used to compute the confidence of each node value in ResAVG. The mean of the confidences of the values is reported to the user. 4. ResTAG Implementation 4.1 Implementation Details The embedded portion of the ResTAG implementation is based on the process for adding new aggregate query types that was built into TinyDB by its authors. The first step in this process is to write the module file for the aggregate, which implements or provides the Aggregate interface, defined in Aggregate.nc. The provider of the Aggregate interface must implement these commands: init, update, merge, stateSize, hasData, finalize and getProperties. The init command is called at the beginning of each epoch. In our implementation, init initializes the counts to zero. If it is the first time, it attempts to allocate memory for the first few child nodes. Memory allocation
2
is accomplished using TinyAlloc, which uses splitphase implementations of both allocate and realloc. When update is called, a node simply replaces its own data with the new sensor data. In the ResMAX query, the parent always keeps track of which child is the maximum, or if it is the maximum. The merge command is called when a node receives a data packet from one of its child nodes. If there is not enough memory allocated, the child is ignored for this epoch. This is unlikely to occur after the first few epochs, because the routing tree is mostly static. Before a node sends data to its parent node, stateSize and hasData are called. The stateSize command returns the size of the data structure sent upstream. The hasData command returns a true if the node has data from itself or a child, false otherwise. However, before hasData is finished, it calls the helper function doPackets, which does the majority of the computation in both aggregates. The computePackets function is responsible for computing all relevant packets for each of the children of this node. The helper function doPackets computes a dispute or reinforcement for one node by a second node, which are passed as parameters. The actual p value is computed by computeProbability, which utilizes fixed-point decimal techniques that we have implemented in the header file ResFP.h. ResFP.h contains functions for multiplication and division, as well as a square root function based on the algorithm described in [19]. This algorithm uses a technique similar to long division to generate the square root of a fixed-point number bit-bybit. The procedure is explained in detail in [19]. h
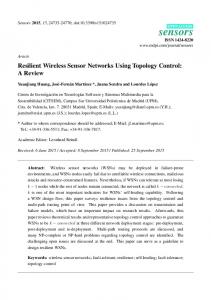
S c θ
R
Figure 2a: Area of a circular segment R A
θ
B
d
A
of the chord partitioning the circular segment (see fig. 2a). The total overlap area then is B 2 S . The chord length is:
c 2 h2 R h where R is the radius of the circle, or sensing area.
The height of the segment, where d is the distance between two nodes (see fig. 2b) is: R h d 2 The approximation we used to calculate p is: 2 h3 2 hc 2c B 3 p . 2 A R The variables h, d, and c are computed in 32-bit fixedpoint format, with 16 bits each for the fraction and whole parts. The final result is converted into an integer percentage value between 0 and 100. Finally, the TinyDB where clause has been modified to allow its use with resilient aggregates. The TinyDB approach to where is to evaluate the condition at each node, and if it is not met, to immediately discard it. If the condition is not met at a child node, the parent does not receive data from that child. Consequently a node whose data does not meet the where condition will not generate disputes for any nodes who do send reports. An example of a query that might create this problem: SELECT ResMAX (light) FROM sensors WHERE temp > 50. As this work is limited to resilience on the request of only one sort of measurement, the where condition will only be on this measurement. The modification makes each node send its measured value regardless of the where condition. This value is checked at the parent, used to compute reinforcement or disputes, and eventually thrown (managed at aggregation time and has to be implemented in new aggregates). 4.2 Limitations The use of dynamic memory allocation (inherent to TinyOS programs) introduces the possibility that a node could miss child data while allocating memory to store it. This is a drawback to using split-phase memory allocation routines. TinyDB itself allows the user to specify a wide range of epoch lengths, although the shorter periods often bring with them more data loss. In our experiences with TinyDB in the TOSSIM simulator, we do not receive data from every node every epoch. Depending on network size and epoch length, anywhere from 30% to 95% of nodes send data in a given epoch.
Figure 2b: Overlapping sensing area Computing arcos through either a lookup table or a Taylor series approximation was too precise for our needs. Instead 5. Results and Analysis we use this approximation for the area of a circular 5.1 Goals, Metrics and Methodology segment: The purpose of these experiments is to determine the 2 h3 S ch effectiveness and reliability of ResTAG. For different 3 2c failure modalities, what percentage of the network can be This is accurate to within 0.1% for 0 150 , and faulty without generating false reports with a high 0.8% for 150 180 [20], where h is the height of confidence index? What other factors affect the performance of ResTAG? Our experiments attempt to the circular segment above the chord, and c is the length
3
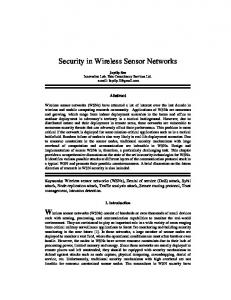
5.2 Results 5.2.1 Total High Confidence Results Figure 5 plots the percent results received that had a confidence greater than 50% vs. percent faulty nodes. The pattern is very different for the three failure modalities, but this is intuitively sensible. ResMAX: When the failure nodes report a low value, it decreases the confidence of the “honest” nearby reports. In Fig. 5a there is a steady decrease in high confidence reports, which is likely due to this phenomenon. When
failure nodes report a high value, the value reported as the maximum may be disputed by the surrounding
Figure 4: Node layout with sensing range. The overlapping sensing ranges of nodes 44 (green) and 55 (red) are shown.
Figure 3: Node layout with radio range shown in pink, for node 35.
Percent Results with High Confidence vs. Percent Faulty Nodes Correlated Failure Value = 0 Percent Results with Confidence > 50%
answer these questions and illustrate typical results when using ResTAG in a network with faulty nodes. We explore the following metrics for the results of ResMAX and ResAVG queries as a function of the percentage of faulty nodes in the network: 1. Percent results with high confidence: Any result having a confidence greater than 50%. 2. Percent false results with high confidence: A highconfidence result where the reported value, is not equal to the actual data value within a given threshold. In our experiments we set the threshold to be 8% for ResMAX and the data used. 3. Percent true results with low confidence: A result within a given threshold of the actual maximum or average, but has confidence less than or equal to 50%. Three different failure modalities were studied: (1) Correlated Low Failures: The faulty nodes generated the same low value, which was 0. (2) Correlated High Failures: The faulty nodes generated the same high value, which was 50. (3) Uncorrelated Failures: Each faulty node was randomly assigned a failure value between the low and high failure values (0 and 50), inclusive. For all experiments, we used the TOSSIM simulator [16], which can run TinyDB code over a simulated network of sensors. It does not model power consumption, but it does accurately represent the processor and memory limitations of mica motes. TOSSIM emulates the mica network stack at a low level, and allows the user to specify a lossy radio model using a text file that represents a directed graph. In our experiments, we did not introduce bit error due to a loss prone network. Instead we used the directed graph file to define a radio range, in which a node can hear perfectly up to twelve of its neighbors (see Fig. 3). Using TOSSIM, we simulated 101 nodes including the sink. The node layout is displayed in Fig. 3. The sink is directly on top of node 21 and does not generate data. The locations of the nodes were calculated using the nodeids, and were based on Fig. 3. Each experimental run followed these steps: (i) The query was injected into the network: SELECT ResMAX(TEST) FROM sensors epoch duration 4096 SELECT ResAVG(TEST) FROM sensors epoch duration 4096 (ii) In increments of 10%, from 0% to 50%, a list of faulty nodes was randomly generated. (iii) The data file containing the simulated sensor data. (iv) Repeat step iii using the correlated high failure value, and uncorrelated failure values.
100 90 80
ResMax ResAvg
70 60 50 0
10
20
30
40
50
Percent Faulty Nodes
5(a) Percent Results with High Confidence vs. Percent Faulty Nodes Correlated Failure Value = 50 100 90 > 50% 80
ResMax ResAvg
70 60 50 0
10
20
30
40
50
Percent Faulty Nodes
5(b) Percent Results with High Confidence vs. Percent Faulty Nodes Uncorrelated Failure Value Percent 100Results with Confidence 90 > 50% 80
ResMax ResAvg
70 60 50 0
10
20
30
40
50
Percent Faulty Nodes
5(c) Figure 5: % results with high confidence vs. % faulty nodes (a) correlated failure value = 0 (b) correlated failure value = 50 (c) uncorrelated failure values uncompromised nodes. In Fig.5b, the percentage of highconfidence reports decreases until the percentage of faulty nodes reaches 30%. This is likely because of the high level of data loss per epoch, which means that the smaller percentage of nodes reporting 50 will be reported more frequently, with low confidence, until that point. After 30% faulty nodes, the percentage of high-
4
confidence results increases, because faulty nodes corroborate each other, and uncompromised nodes are less likely to dispute. For random (uncorrelated) failure values, there is a similar inflection point at 30%, shown in Fig. 5c. Because faulty nodes may not corroborate each other, and uncompromised nodes are likely to be disputed, the percentage of high-confidence reports decreases as the percentage of faulty nodes increases. ResAVG: Contrary to ResMAX, Fig. 5 shows that the number of high confidence results decreases when the
80
number of faulty nodes increases, regardless of the correlation between faulty values. A higher decrease is noticed after there are 30% faulty nodes, which is the theoretical limit after which the number of disputes should logically decrease significantly the confidence. However, there is still a significant percentage of high confidence results. This is because each result is generated by an average of 40% of nodes, which lowers number of disputes.
Percent False Results with High Confidence vs. Percent Faulty Nodes Correlated Failure Value = 0
20
Percent True Results with Low Confidence vs. Percent Faulty Nodes Correlated Failure Value = 0
60 50 ResMax
40
ResAvg
30 20
Percent True Results with Confidence 50%
70 15
ResMax
10
ResAvg
5
10 0
0
0 10 Actual Maximum: 25 Threshhold of Agreement: 8%
20
30
40
50
0 10 Actual Maximum: 25 Threshhold of Agreement: 8%
Percent Faulty Nodes
6a.
80
20
30
40
50
Percent Faulty Nodes
7a.
Percent False Results with High Confidence vs. Percent Faulty Nodes Correlated Failure Value = 50
Percent True Results with Low Confidence vs. Percent Faulty Nodes Correlated Failure Value = 50 20
60 50 ResMax
40
ResAvg
30 20
Percent True Results with Confidence 50%
70 15
ResMax
10
ResAvg
5
10 0 0 10 Actual Maximum: 25 Threshhold of Agreement: 8%
20
30
40
0 0 10 Actual Maximum: 25 Threshhold of Agreement: 8%
50
Percent Faulty Nodes
30
40
50
Percent Faulty Nodes
7b.
6b. Percent False Results with High Confidence vs. Percent Faulty Nodes Uncorrelated Failure Values 80
35
70
30
60 50 ResMax
40
ResAvg
30 20 10 0
0 10 Actual Maximum: 25 Threshhold of Agreement: 8%
20
30
Percent Faulty Nodes
6c. Figure 6: Percent false results with high confidence vs. percent faulty nodes with (a) CFV = 0 (b) CFV = 50 (c) uncorrelated failure
40
50
Percent True Results with Confidence 50%
20
Percent True Results with Low Confidence vs. Percent Faulty Nodes Uncorrelated Failure Values
25 20
ResMax ResAvg
15 10 5
0 0 10 Actual Maximum: 25 Threshhold of Agreement: 8%
20
30
40
50
Percent Faulty Nodes
7c Figure 7: Percent true results with low confidence vs. percent faulty nodes with (a) CFV = 0 (b) CFV = 50 (c) uncorrelated failure
5
5.2.2 Further Results References The second two metrics, which are shown in figures 6 and 7, represent the ability of ResTAG to detect faulty nodes in[1] A. Mainwaring, J. Polastre, R. Szewczyk, D. Culler, J. Anderson. “Wireless Sensor Networks for Habitat a network of nodes which all detect the same event. We Monitoring.” ACM WSNA'02, 2002. would like those numbers to remain reasonably low [2] T. He, S. Krishnamurthy, J. A. Stankovic, T. Abdelzaher, L. beneath some threshold of percentage of faulty nodes. Luo, R. Stoleru, T. Yan, L. Gu. Energy-Efficient Surveillance For the second metric studied, percentage of false System Using Wireless Sensor Networks. Mobisys, 2004. reports with high confidence, the situation of most concern [3] D. Malan, T. Fulford-Jones, M. Welsh and S. Moulton. is when faulty nodes are corroborated (only at a high value “CodeBlue: An Ad Hoc Sensor Network Infrastructure for Emergency Medical Care.” Intl. Workshop on Wearable and for ResMAX), such as in Fig. 7a. In this “worst-case” Implantable Body Sensor Networks, April 2004. scenario, the percent of false reports with high confidence remains reasonably low, below one-third, for up to 20% [4] V. Raghunathan, C. Schurgers, S. Park, and M. B. Srivastava. “Energy Aware Wireless Sensor Networks”. IEEE Signal faulty nodes. With uncorrelated failures, similar results Processing 19, 2, 40--50. were achieved at a threshold of 30% faulty nodes. [5] W. Yuan, S. V. Krishnamurthy, and S. K. Tripathi. In the last three figures, we can see the second type “Improving the Reliability of Event Reports in Wireless of failure in ResTAG: true reports with a low confidence. Sensor Networks”. ISCC, 2004. In this scenario, we are concerned about the presence of [6] S. Madden, M. J. Franklin, and J. M. Hellerstein. TAG: a Tiny AGgregation Service for Ad-Hoc Sensor Networks. low reported failures reducing the confidence of the true OSDI, December 2002. report. Except for ResAVG with uncorrelated failures, we [9] D. Estrin, R. Govindan, J. S. Heidemann, observe that this value remains below 5% for up to 50% S. Kumar. “Next Century Challenges: Scalable Coordination faulty nodes, for all three failure modalities. in Sensor Networks.” MOBICOM 1999: 263-270 Although Figs, 6b and 7a for ResMAX and Figs. 6b [15] TinyOS – “http://www.TinyOS.net” and 6c for ResAVG show the extreme pathological cases of[16] P. Levis, N. Lee, M. Welsh and D. Culler. TOSSIM: Accurate and Scalable Simulation of Entire TinyOS corroborated faulty nodes reducing the confidence of the Applications. ACM SenSys 2003. true report. In our experiment using uncorrelated failure values, false results were detected for a higher percentage [17] D. Gay, P. Levis and R.von Behren. “The nesC Language: A Holistic Approach to Networked Embedded Systems.” of faulty nodes than with a correlated failure value, and [18] The Network Simulator - ns-2 true reports were reported with high confidence for a higher “http://www.isi.edu/nsnam/ns/”. percentage of faulty nodes than with a correlated failure [19] K. Turkowski. Fixed Point Square Root. Media Technologies: Computer Graphics, Advanced Technology value. These results suggest that ResTAG is more resistant Group, Apple Computer, Inc., October 1994 when values of faulty nodes are not corroborated. [20] Harris, J. W. and Stocker, H. "Segment of a Circle." §3.8.6 in Handbook of Mathematics and Computational Science. New York: Springer-Verlag, pp. 92-93, 1998.
6. Conclusions and Future Work We discussed the motivation, design, implementation and evaluation of ResTAG, which provides fault-tolerant aggregate queries in the popular, user-friendly TinyDB middleware. These new query types return not only data values, but a quantified measure of confidence in those values. If a sensor becomes mis-calibrated or physically compromised, the fault-tolerant queries use the redundancy in the network to reduce the confidence in any report from that sensor. Varying properties such as the network density and epoch length of queries may have a significant impact on the results. Further research could investigate utilizing data reports over time to generate confidence in particular nodes. In conclusion, ResTAG shows promise as a method for providing confidence in the results of TinyDB. We intend to implement several additional varieties of resilient aggregate queries and explore its use and effectiveness in real sensing applications. Acknowledgements Nirupama Bulusu initiated research on resilient event detection while she was at National ICT Australia Limited (NICTA) and continued it at Oregon Health and Sciences University (OHSU). Angelika Herbold was supported by the NSF CRA-W Distributed Mentor Project.
6