Organizational Results Research Report
January 2009 OR09.015
Resilient Moduli of Granular Base Materials Using a Modified Type 5 Gradation
Prepared by Missouri University of Science and Technology and Missouri Department of Transportation
TECHNICAL REPORT DOCUMENTATION PAGE. 1. Report No.: 2. Government Accession No.: 3. Recipient's Catalog No.: 4. Title and Subtitle: 5. Report Date: January 2009 Resilient Moduli of Granular Base Materials Using a Modified Type 5 Gradation 6. Performing Organization Code: 7. Author(s): Dr. David Richardson, Steven M. Lusher 9. Performing Organization Name and Address: Missouri University of Science & Technology Department of Civil, Architectural, and Environmental Engineering 211 Butler-Carlton Hall, Rolla, MO 65409 12. Sponsoring Agency Name and Address:
8. Performing Organization Report No.: OR09-015 10. Work Unit No.: 11. Contract or Grant No.: RI08-021 13. Type of Report and Period Covered: Final Report. 14. Sponsoring Agency Code:
Missouri Department of Transportation Organizational Results PO BOX 270, JEFFERSON CITY MO 65102 15. Supplementary Notes: The investigation was conducted in cooperation with the U. S. Department of Transportation, Federal Highway Administration. 16. Abstract:
The Missouri Department of Transportation (MoDOT) in collaboration with the Missouri Limestone Producers Association (MLPA) was interested in determining what effect a change in the Type 5 aggregate base gradation specification would have on the resilient modulus (Mr) of said aggregate. The proposed change would lower the minimum allowable total percentage of material passing the #4 (4.75 mm mesh) sieve from 35% to 25%, and the #30 (0.600 mm mesh) sieve from 10% to 5%. The remainder of the gradation specification would remain unchanged. The rationale for this proposed change is that some aggregate producers believe the change could help lower their costs of producing a Type 5 aggregate base material. To investigate the proposed gradation specification change, an experimental gradation was devised which followed the lower bounds of the proposed gradation specification on the #4, #30, and #200 sieves, and approximated the as-delivered gradations of two aggregate formations previously tested for MoDOT on the 3/8, ½, ¾, and 1 inch sieves, making it a relatively open-graded material. Thus, two different aggregate sources were tested. In the previous study for MoDOT, two gradations were analyzed: as-delivered Type 5 materials, and gradations with elevated fines contents. Both gradations could be considered to be high-fines content materials, with minus #200 contents between 11 and 18%. As a result of changing the gradation to fit the lower proposed specification limits, the experimental gradation in the present study contained no minus #200 material, and had significantly more #4 retained material, but less #8 retained material. The resulting Mr values in this study were greater than the results from the previous study for the same aggregates. Besides a change in gradation, the degrees of saturation for the proposed, more open-graded gradation were significantly lower than seen in the previous study for the same aggregate types.
17. Key Words: 18. Distribution Statement: Resilient Modulus, Mechanistic-Empirical Pavement No restrictions. This document is available to Design Guide (M-E PDG), AASHTO T 307, Unbound the public through National Technical Granular Base Information Center, Springfield, Virginia 22161. 19. Security Classification (of this 20. Security Classification (of this 21. No of Pages: 22. Price: report): page): Unclassified. Unclassified. 40
Form DOT F 1700.7 (06/98).
FINAL REPORT RI08-021
Resilient Moduli of Granular Base Materials Using a Modified Type 5 Gradation
Prepared for the Missouri Department of Transportation Organizational Results By David N. Richardson, PE Steven M. Lusher, EIT Missouri University of Science and Technology (Formerly University of Missouri-Rolla)
January 2009
The opinions, findings, and conclusions expressed in this report are those of the principal investigator and the Missouri Department of Transportation. This report does not constitute a standard, specification, or regulation.
ACKNOWLEDGEMENTS
The authors wish to thank the Missouri Department of Transportation (MoDOT) for sponsoring this work and John Donahue for coordination and support. EXECUTIVE SUMMARY The Missouri Department of Transportation (MoDOT) in collaboration with the Missouri Limestone Producers Association (MLPA) was interested in determining what effect a change in the Type 5 aggregate base gradation specification would have on the resilient modulus (Mr) of said aggregate. The proposed change would lower the minimum allowable total percentage of material passing the #4 (4.75 mm mesh) sieve from 35% to 25%, and the #30 (0.600 mm mesh) sieve from 10% to 5%. The remainder of the gradation specification would remain unchanged. The rationale for this proposed change is that some aggregate producers believe the change could help lower their costs of producing a Type 5 aggregate base material. To investigate the proposed gradation specification change, an experimental gradation was devised which followed the lower bounds of the proposed gradation specification on the #4, #30, and #200 sieves, and approximated the as-delivered gradations of two aggregates previously tested for MoDOT on the 3/8, ½, ¾, and 1 inch sieves, making it a relatively open-graded material. Two different aggregate sources were tested. Mr, a material stiffness characterization test, was determined in accordance with the American Association of State Highway and Transportation Officials (AASHTO) test method T 307-99 (2003), “Determining the Resilient Modulus of Soils and Aggregate Materials.” MoDOT contracted with Missouri S&T to test three replicate specimens per aggregate type according to T 307. Target dry unit weights and moisture contents at which to prepare the Mr specimens were determined through reviewing the literature and some trial and error testing. In the previous study for MoDOT, two gradations were analyzed: as-delivered Type 5 materials, and gradations with elevated fines contents. Both gradations could be considered to be high-fines content materials, with minus #200 contents between 11 and 18%. As a result of changing the gradation to fit the lower proposed specification limits, the experimental gradation in the present study contained no minus #200 material, and had significantly more #4 retained material, but less #8 retained material. The resulting Mr values in this study were greater than the results from the previous study for the same aggregates. Besides a change in gradation, the degrees of saturation for the proposed, more open-graded gradation were significantly lower than seen in the previous study for the same aggregate types.
ii
TABLE OF CONTENTS
ACKNOWLEDGEMENTS .......................................................................................... II EXECUTIVE SUMMARY ........................................................................................... II TABLE OF CONTENTS............................................................................................ III LIST OF FIGURES ....................................................................................................V LIST OF TABLES......................................................................................................VI INTRODUCTION ....................................................................................................... 1 OBJECTIVES ............................................................................................................ 3 TECHNICAL APPROACH ......................................................................................... 4 General .................................................................................................................. 4 Materials................................................................................................................. 4 Target Resilient Modulus Specimen Properties...................................................... 4 Gradation ............................................................................................................ 4 Dry Unit Weight and Moisture Content ............................................................... 6 Resilient Modulus Testing .................................................................................... 10 Equipment......................................................................................................... 10 Specimen Fabrication ....................................................................................... 11 Stress States/Testing Sequence....................................................................... 12 Testing Procedure ............................................................................................ 12 RESULTS AND DISCUSSION ................................................................................ 14 Compaction Parameters....................................................................................... 14 Regression Coefficients ....................................................................................... 14 Quality of the Testing Program............................................................................. 15 Effect of Gradation on Mr ...................................................................................... 16 Optimum Fines Content ....................................................................................... 20 iii
Comparison to Past Studies ................................................................................. 21 Constructibility ...................................................................................................... 23 Comparison of Experimental Gradations to Other DOT Gradations..................... 24 CONCLUSIONS....................................................................................................... 27 RECOMMENDATIONS – FUTURE RESEARCH .................................................... 28 REFERENCES ........................................................................................................ 29 APPENDIX A ........................................................................................................... 32 APPENDIX B ........................................................................................................... 35
iv
LIST OF FIGURES Figure 1: Histogram of Percent Fines for Type 5 Aggregate Used Statewide............ 2 Figure 2: Gradation Summary.................................................................................... 5 Figure 3: Individual Percent Retained Gradations ..................................................... 6 Figure 4: Triaxial Chamber and Measurement Devices ........................................... 10 Figure 5: Bethany Falls; Pooled Mr vs θ; O-G, A-D, and W-F Gradations................ 18 Figure 6: Bethany Falls; Pooled Mr vs τoct; O-G, A-D, and W-F Gradations ............. 18 Figure 7: Gasconade; Pooled Mr vs θ; O-G, A-D, and W-F Gradations ................... 19 Figure 8: Gasconade; Pooled Mr vs τoct; O-G, A-D, and W-F Gradations ................ 19 Figure 9: Mr (at θ = 12 psi) versus P200 .................................................................. 20 Figure 10B: BF O-G1 Mr Data, Eq. 1 Regression Results, & Eq. 2 Plot................... 35 Figure 11B: BF O-G2 Mr Data, Eq. 1 Regression Results, & Eq. 2 Plot................... 36 Figure 12B: BF O-G3 Mr Data, Eq. 1 Regression Results, & Eq. 2 Plot................... 37 Figure 13B: Gasc O-G1 Mr Data, Eq. 1 Regression Results, & Eq. 2 Plot............... 38 Figure 14B: Gasc O-G2 Mr Data, Eq. 1 Regression Results, & Eq. 2 Plot............... 39 Figure 15B: Gasc O-G3 Mr Data, Eq. 1 Regression Results, & Eq. 2 Plot............... 40
v
LIST OF TABLES Table 1: Project Materials .......................................................................................... 4 Table 2: Total and Effective Moisture Contents ......................................................... 9 Table 3: Testing Sequence for Granular Base Material ........................................... 12 Table 4: Summary of Results................................................................................... 15 Table 5: Replicate One-Way Anova......................................................................... 16 Table 6: Resilient Moduli at θ = 12 psi ..................................................................... 17 Table 7: Various State Specifications for Open-Graded Aggregates ....................... 25
vi
INTRODUCTION
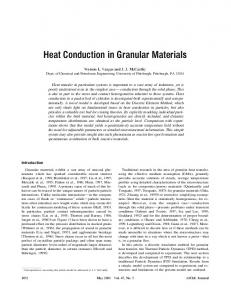
The Missouri Department of Transportation (MoDOT) in collaboration with the Missouri Limestone Producers Association (MLPA) was interested in determining what effect a change in the Type 5 aggregate base gradation specification would have on the resilient modulus of said aggregate. The proposed change would lower the minimum allowable total percentage of material passing the #4 (4.75 mm mesh) sieve from 35% to 25%, and the #30 (0.600 mm mesh) sieve from 10% to 5%. The remainder of the gradation specification would remain unchanged. The rationale for this proposed change is that some aggregate producers believe the change could help lower their costs of producing a Type 5 aggregate base material. MoDOT’s Type 5 aggregate base was originally developed to be a more drainable (permeable) base material when compared with MoDOT’s Type 1 aggregate base. Currently, the only difference in gradation specifications between a Type 5 and a Type 1 aggregate base material is that there is an upper limit on the amount of fines (i.e. that material that passes the #200 or 0.074 mm mesh sieve) that can be present in a Type 5 material. However, with a current upper limit of 15% fines, many of the Type 5 stockpiles around the state contain material that is essentially non-drainable when used as a pavement base aggregate. Figure 1 is a histogram showing the percent passing the #200 sieve (P200) for Type 5 base aggregates used in Missouri in the recent past. The data supplied by MoDOT represents 1811 gradation analyses that reported a P200 value.
Figure 1: Histogram of Percent Fines for Type 5 Aggregate Used Statewide The median value for the data depicted in Figure 1 is 9.7% fines with the mean being 10.0% fines. The majority of the data exceeds 6% fines. This data hardly represents a drainable material. For those aggregate producers who believe the proposed Type 5 gradation specification change could save them money by reducing some or all aspects of processing a Type 5 material, it seems logical that those producers would also see a lowering of the amount of fines produced for that particular process. This lowering of the fines content could help improve the drainability of that particular Type 5 product. To investigate the proposed gradation specification change, an experimental gradation was devised which followed the lower bounds of the proposed gradation specification on the #4, #30, and #200 sieves, and approximated the as-delivered gradations of two aggregates previously tested for MoDOT (1) on the 3/8, ½, ¾, and 1 inch sieves, making it a relatively open-graded material. Two different aggregate sources were tested. The resilient modulus (Mr), a material stiffness characterization test, was determined in accordance with the American Association of State Highway and Transportation Officials (AASHTO) test method T 307-99 (2003) (2). MoDOT contracted with Missouri S&T to test three replicate specimens per aggregate type according to test method T 307.
2
OBJECTIVES
The objective of this project is to determine the Mr of the two base aggregates when the gradations are constructed to basically follow the lower bounds of the proposed gradation specification then compare those Mr to previously determined Mr for the same aggregates but tested in the as-delivered condition.
3
TECHNICAL APPROACH General The technical approach included choice of materials, determination of the gradation, dry unit weight, and moisture content at which to perform Mr testing, specimen fabrication, and Mr testing. Materials The two crushed aggregates chosen to be tested were a Gasconade Formation dolomite and a Bethany Falls Formation limestone. Of the five aggregates tested in the previously mentioned Mr study for MoDOT (1), these two were selected for this project mainly because the wide range in Mr behavior, coupled with wide differences in Los Angeles Abrasion (LAA = resistance to impact and abrasion) values and absorptions (Pa). The LAA values were supplied by MoDOT and the Pa values were determined during the previous MoDOT Mr study. Table 1 summarizes the material names, designations used throughout the remainder of this paper, and the LAA and Pa values. Table 1: Project Materials Name Designation Pa (%) LAA (%) Bethany Falls, as-delivered BF A-D 1.89* 24 Bethany Falls, open-graded BF O-G 1.91** Gasconade, as-delivered Gasc A-D 3.84* 30 Gasconade, open-graded Gasc O-G 3.80** *Based on testing a combined sample (coarse and fine aggregate) using the CoreLok® method **Based on AASHTO T 85 (coarse aggregate only) (3) Target Resilient Modulus Specimen Properties Gradation The as-delivered gradations of the Gasconade and Bethany Falls material met the current Type 5 specifications and were fairly similar, especially on those sieve sizes larger than the #4. They also exhibited percent minus #200 values approaching the upper limit of the specification. The experimental gradation used in this study follows the lower bounds of the proposed gradation on the #4, #30, and #200 sieves and is considered open-graded. Because the proposed specification change only applies to the #4 and #30 sieves, the idea was to isolate the effect of the proposed change on Mr by keeping percentages passing the larger sieve sizes of the two aggregates the same as or similar to the as-delivered gradations, thus keeping any Mr comparisons between the experimental and as-delivered gradations mostly a function of the minus 3/8 in. portion of the particle size distribution. Figure 2 summarizes the as4
delivered and experimental gradations, and the current and proposed upper and lower specification limits (USL and LSL, respectively). 100
90
80
Total Percent Passing
70
60
50
Aggregate Type & Gradations Sieve Size (% Passing) (mm) Standard Gasc A-D BF A-D Experimental 25 1" 100 100 100.0 19 3/4" 97 96 96.0 12.5 1/2" 83 80 80.0 9.5 3/8" 71 69 69.0 4.75 #4 52 47 25.0 2.36 #8 39 33 18.3 1.18 #16 32 25 11.6 0.6 #30 27 21 5.0 0.3 #50 21 18 3.3 0.15 #100 15 15 1.6 0.075 #200 10.7 13.8 0.0
Specs Current Proposed Type 5 Type 5 100 100 60-90
60-90
35-60
25-60
10-35
5-35
0-15
0-15
40
30
20
10
0 0.01
0.1
1
10
100
Sieve Size (mm) Gasc A-D
BF A-D
Proposed Type 5 USL
Proposed Type 5 LSL
Experimental
Figure 2: Gradation Summary Figure 3 expresses the gradations in terms of Individual Percent Retained, which more clearly depicts the differences in the gradations. The as-delivered and proposed gradations are essentially the same except the percent #4 retained is greater for the proposed gradation, and the percents retained on the #8 and #200 are less.
5
50 45 40 35
25
IPR (%)
30
20 15 10 5 0 1″
0.75″
0.5″
0.375″
4
8
16
30
50
100
200
minus 200
Sieve Size BF-AD
OG
Gasc-AD
Figure 3: Individual Percent Retained Gradations In order to accurately construct the experimental gradation containing no material passing the #200 sieve, it was necessary to first perform some processing of the asdelivered material. The bagged aggregates were dry-sieved into the different size fractions shown in the table within Figure 2. Each size fraction was then individually washed over the associated sieve and then oven-dried. This process produced washed, oven-dried aggregate fractions that were then re-combined in the appropriate percentages and amounts to build test specimens with the experimental gradation. Dry Unit Weight and Moisture Content A considerable portion of the work involved determining the dry unit weight and moisture content at which to perform the Mr testing. Because the experimental gradation was open and cohesionless, the initial thought was to obtain the maximum dry unit weight using American Society of Testing and Materials (ASTM) test method D 4253-00 (4). Within this test specification, there are two basic methods: one using oven-dry aggregate (method 1A) and the other using wet aggregate (method 1B). The decision was made to use method 1B because it was assumed it would result in the densest particle configuration; i.e. a higher dry unit weight. However, because of the wide range of particle sizes in the specimen, major segregation occurred during the test resulting in a non-uniform densification of the aggregate particles; the smaller particles were in the bottom of the mold with the larger particles on top. It 6
was also assumed that this same phenomenon would have occurred if method 1A had been used. Therefore, the results from ASTM D 4253 were deemed invalid and were not used to determine the specimen conditions for Mr testing. It seemed that the logical alternative to ASTM D 4253 for determining the maximum dry unit weight of the experimental gradation was the standard proctor test, AASHTO T 99 (5). Although the use of T 99 for open-graded aggregates can result in no definite moisture-density relationship, it seemed appropriate to try T 99 with the experimental gradation because MoDOT specifies this particular test method for determination of field densities. However, knowing that the highly-drainable nature of the experimental gradation would limit the amount of water that could be added to the material without it simply seeping out of the bottom of the proctor mold, a onepoint or single moisture content proctor was investigated. Having decided to attempt a one-point T 99, the next issue was determining what moisture content to use during compaction. The thought was to look at how other state DOT’s that actually specify open-graded, unbound granular material base courses determine what compactive effort/method and moisture content to specify for construction of such base courses. In a 2004 report published by the Iowa State University Center for Transportation Research and Education (CTRE) in collaboration with the Iowa Department of Transportation (6), results of a survey show that 6 states use permeable bases only, 11 use only dense-graded bases, and 29 states use both permeable and densegraded bases. However, this survey does not indicate the percentage or number of these permeable bases that are treated (asphalt or cement) or non-treated (unbound) aggregate bases. MoDOT’s Type 5 base aggregate is an unbound material. A review of the highway construction specifications of a few of the states listed in the survey as using permeable bases seemed to indicate that very few use unbound, open-graded, permeable bases in pavement construction; most use asphalt or cement treated aggregates. In the latest on-line-available specifications, special provisions, supplements, etc., Michigan, Oregon, and Wisconsin (and there could be more) do specify unbound, open-graded, permeable bases in pavement construction. Excerpts from these states’ specifications are given in Appendix A. It appears that Michigan has replaced a compaction method based on roller-type and roller patterns to a percent compaction determination (7), but has not clearly specified how to determine the reference or maximum dry unit weight (8). The Oregon specification also indicates a percent compaction of maximum “density” for the dense-graded aggregates and does not directly indicate the method to be used to determine said maximum density. However, in an earlier sub-section, reference is made to T 99 and an optimum moisture content. The amount of water required for the “mix design” is normally 5 to 10%, with a field tolerance of ± 2% (9).
7
It appears that the use of unbound, open-graded base courses has recently been discontinued in Ohio. However, they do specify using field test sections to determine maximum dry unit weight of unbound granular base materials. The test section method utilized depends on whether or not the aggregate has a definite moisturedensity relationship (determined using various optional methods). If there is a definite moisture-density relationship, T 99 is used to determine the optimum moisture content and then the test sections are built at that moisture content and rolled until a maximum dry unit weight is achieved. If there is not a definite moisturedensity relationship, test sections are built at various moisture contents (starting at 0 to 3% moisture and increasing by 2% for every test section), rolled until a maximum dry unit weight for each moisture content is achieved, and then the maximum dry unit weight determined for the field testing (essentially, a field proctor curve) is used for base construction purposes (10). Wisconsin specifies a “standard” compaction method for unbound, open-graded aggregates that is a roller-type and roller-pattern method (11). However, Wisconsin requires laboratory permeability testing on aggregates to be used in open-graded base courses and specifies a target unit weight which is achieved when the material is compacted at 6% moisture content using T-99 Method C (12). Thus, for the purposes of choosing a unit weight and moisture content for preparation of Mr specimens, the use of a 6% moisture content seemed reasonable in that, for most base aggregates, absorption would be satisfied and there would be sufficient particle surface moisture for compaction lubrication purposes, but there would not be so much water as to flush the finer fractions during compaction (i.e. segregate the particles). This level of moisture also relates fairly well to one of the recommendations in the CTRE report (6): “As an alternative to trimming equipment (e.g. Gomaco type), use a motor grader with GPS assisted grading (i.e. stakeless grading control). If trimming equipment must be used, however, ensure that the aggregate is delivered to the site with sufficient water content (7%–10 %) to bind the fines during trimming.”
This recommendation was in response to one of the findings of the CTRE report in that segregation of the open-graded base aggregates was found to occur during trimming of the compacted base course; i.e. the aggregate was too dry during trimming and, thus, the vibration of the trimmer caused the fines to segregate downward leaving coarser aggregate particles on the surface. Therefore, it seems that, for unbound, open-graded base aggregates, there needs to be sufficient moisture in the delivered material to provide lubrication for compaction and “bind the fines” to the coarse aggregate to prevent segregation, but not excessive moisture that would prevent maximum densification or cause segregation to occur due to fluid flow. Thus, the decision was made to compact the Mr specimens at 6% moisture and at a dry unit weight determined using T 99, Method D (but with no scalping or removal of any size fraction), also at 6% total moisture. Initially, this strategy worked well for the 8
Gasc O-G material but not so well for the BF O-G material. The Gasc O-G T 99 test resulted in a dry unit weight of 111.2 lb/ft3, with no significant moisture seepage or segregation. Mr tests on the Gasc O-G material under these conditions were also non-problematic. The BF O-G T 99 test resulted in a dry unit weight of 112.7 lb/ft3, with no visible seepage from the bottom of the proctor mold or major segregation of the compacted aggregate. However, the first BF O-G Mr test specimen prepared at 6% moisture and 112.7 lb/ft3 dry unit weight experienced significant loss of moisture through the drainage line of the triaxial cell (~170 ml relative to ~25 ml for all other Mr tests). Behavior of unbound granular material in regard to compaction moisture is analogous to that of hot mix asphalt (HMA), i.e. part of the HMA’s total binder is absorbed, leaving the balance (“effective binder”) to function as the lubricant. Thus, two mixes can have the same total binder content, but different effective binder contents, depending on the absorption of the aggregate. The amount of effective binder dictates, in part, the lubrication and hence the behavior under compaction. Unbound granular base materials act in a similar manner. Two different aggregates, with the same total moisture, can behave differently during compaction if they have significantly different absorptions. The difference between the behavior of the Gasconade and the Bethany Falls aggregates in the Mr testing, regarding the ability to hold moisture, could be attributed to the difference in their absorptions: the Gasc O-G aggregate has absorption ~2% higher than the BF O-G aggregate. Because total moisture is the sum of absorption and surface (“effective”) moisture, the surface moisture of the BF O-G aggregate was also ~2% higher than the Gasc O-G, thus the excessive seepage of the BF O-G. Therefore, to keep the surface moisture of the BF O-G consistent with that of the Gasc O-G, the total moisture content to be used for the BF O-G T 99 test, and subsequently the Mr test, was lowered to 4.0 %, as shown in Table 2. Table 2: Total and Effective Moisture Contents Aggregate Total Moisture Absorption Gasconade 6.0 3.8 Bethany Falls 4.0 1.9
Effective Moisture 2.2 2.1
Actually, 3.9% was the moisture for the BF O-G specimens content as it was adjusted slightly from 4.0% due to actual post-Mr test moisture contents. Re-running the T 99 test on the BF O-G aggregate when prepared at a 3.9% moisture content resulted in a dry unit weight of 115.5 lb/ft3, an increase from 112.7 lb/ft3 when compacted at 6% moisture. Therefore, in summary, the target dry unit weights and as-compacted moisture contents for the Mr specimens were as follows: • •
Gasc O-G dry unit weight = 111.2 lb/ft3: 6.0% total moisture content BF O-G dry unit weight = 115.5 lb/ft3: 3.9% total moisture content. 9
Resilient Modulus Testing Equipment The Mr testing equipment was in conformance with AASHTO T 307-99 (2003) (2) for Type I materials (granular bases), which specifies that test specimens shall be 6 in. in diameter. The equipment consisted of a Geotechnical Consulting and Testing Systems (GCTS) control system, an MTS 858 closed-loop servo-hydraulic load system, a GCTS triaxial chamber capable of housing a 6 in. diameter specimen while subjected to cyclic loads, and a GCTS data acquisition system. Load was measured with an external 2200 lb load cell located between the actuator and the chamber piston rod. Deformation was measured by two Schaevitz MHR-250 linear variable differential transducers (LVDTs) mounted externally to the cell. The range of the LVDTs was ± 6.35 mm. Air was used as the confining fluid. Triaxial cell pressure was controlled manually via a pressure regulator, and measured with a pressure transducer linked to the GCTS data acquisition system. The test setup is shown in Figure 4.
Figure 4: Triaxial Chamber and Measurement Devices 10
Specimen Fabrication Knowing the target dry unit weights and moisture contents, the existing moisture content of the material (essentially oven-dry), and the target compacted volume of the specimen, enough material was obtained to produce seven “lifts”; six to be compacted into the mold and one to be used for the as-compacted moisture content determination. The calculated amount of each size fraction necessary to build the experimental gradation was placed into a large pan and water was added to bring the material to the target moisture content plus a small amount to account for moisture loss. After thorough mixing, the aggregate was covered and allowed to cure for at least 15 minutes (usually longer). After curing, a square point scoop was used to systematically remove the calculated amount of moist material from the pan and place it into the mold to be compacted as a lift. After compaction of the six lifts, the remaining material was used for as-compacted moisture content determination. The specimen mold was 6 in. nominal diameter. The actual compacted specimen diameter was 5.82 in. This met the requirement that the diameter be equal to or greater than five times the maximum particle size, which was 1 in. for the experimental gradation. The material was compacted into the mold using a handheld mechanical hammer-drill (meeting T 307 specifications) and bearing on a steel plate. An under-compaction principle was utilized to assure uniform compacted density throughout the height of the specimen. This principle requires that the first or bottom lift be under-compacted to some degree (either 1.5 or 2.0% for the material in this study) and each successive lift be decreasingly under-compacted resulting in the top lift thickness being exactly 1/6 of the specimen height. The mold was an aluminum vacuum split mold mounted directly on the triaxial cell pedestal. The specimens were compacted to a height of approximately 11.70 in., which met the requirement of at least two times the specimen diameter. A 6 in. diameter, 0.025 in. thick latex rubber membrane was placed onto the triaxial cell pedestal and secured with an O-ring. The split mold was then secured onto the pedestal. Sufficient vacuum was applied to the membrane to hold it against the interior mold wall. Prior to adding material to the mold, the membrane was protected from damage during compaction by securing a series of 0.08 in. thick, approximately 2 in. wide, and 12 in. long nitrile rubber strips against the membrane using a small amount of vacuum grease. T 307 specifies membrane thickness between 0.25 and 0.79 mm (0.0098 in. to 0.0311 in.). Because the protective nitrile rubber was cut into strips and placed side-by-side around the interior perimeter of the membrane, it was reasoned that although the combined thickness of the membrane and the rubber nitrile strips exceeded the T 307 specifications, the rubber nitrile strips did not add any confining pressures to the specimen; only the rubber membrane could supply any confining pressure and it met T 307 thickness specifications.
11
Stress States/Testing Sequence Stress state is considered the most important variable that affects the modulus of granular materials. The three principal stresses are σ1, σ2, and σ3 , where σ1 is the major principal stress, σ2 is the intermediate principal stress, and σ3 is the minor principal stress. In a triaxial type test, σ1 is provided by the total vertical stress, and σ2 equals σ3 for a cylindrical specimen. In the triaxial state, the difference between the total vertical stress (σ1) and the confining pressure (σ3) is called the deviator stress or stress difference (σd). A small static load (0.1σd) provides the “overburden” pressure while the cyclic deviator stress (0.9σd) provides the “vehicle” momentary stress. The sum of the three principal stresses is known as the bulk stress (θ). Mr is calculated as (0.9σd)/ εr, where εr is the resilient (recovered) axial strain. For each specimen, resilient modulus was determined at fifteen stress states where confining pressure ranged from 3 to 20 psi and σd varied from 3 to 40 psi. This resulted in a range of bulk stress from 12 to 100 psi, which is considered adequate to represent the range in stress states likely to be encountered under field conditions. The testing sequence and stress state schedule is shown in Table 3. Table 3: Testing Sequence for Granular Base Material Sequence σ3 σd 0.9 σd 0.1 σd No. (psi) (psi) (psi) (psi) 0 15 15 13.5 1.5 1 3 3 2.7 0.3 2 3 6 5.4 0.6 3 3 9 8.1 0.9 4 5 5 4.5 0.5 5 5 10 9.0 1.0 6 5 15 13.5 1.5 7 10 10 9.0 1.0 8 10 20 18.0 2.0 9 10 30 27.0 3.0 10 15 10 9.0 1.0 11 15 15 13.5 1.5 12 15 30 27.0 3.0 13 20 15 13.5 1.5 14 20 20 18.0 2.0 15 20 40 36.0 4.0
Θ (psi) 60 12 15 18 20 25 30 40 50 60 55 60 75 75 80 100
No. load applications 500 100 100 100 100 100 100 100 100 100 100 100 100 100 100 100
Testing Procedure The resilient modulus testing procedure involved the following steps: specimen compaction, assembly of the triaxial cell, application of confining pressure, stress conditioning at a given stress state (see stress sequence “zero” in Table 3), and load application through 15 additional stress states. Conditioning was used to eliminate 12
the effects of any specimen disturbance due to specimen preparation procedures. It also aided in minimizing the effects of initially imperfect contact between end platens and the test specimen. In this study, conditioning load applications were limited to 500 because the decrease in specimen height had ceased by then. Load and deformation data were taken for every load application over the entire sequence of stress states, but only the last five applications were used for calculation of Mr. The load duration for each repetition was 0.1 sec followed by 0.9 sec rest. The stress pulse shape was haversine in nature. The drainage valves were left open. Repeated load equipment deflection was determined through the use of an aluminum dummy specimen and was subtracted from total deflections for each stress state. The change in specimen height was continuously monitored. None of the specimens approached the maximum allowable permanent strain of five percent. To verify that the moisture condition of each of the three replicates tested per aggregate type was substantially the same, moisture contents were obtained on each specimen after the Mr test had been completed. Mr test specimens were divided into three approximately equal portions (top, middle, and bottom 4 in.) and moisture contents were determined on each third. Also, moisture contents used for calculation of reported actual (as-tested) dry unit weights were based on the entire specimen. As mentioned previously, for every Mr specimen, enough material was prepared to produce seven layers or lifts; six to be compacted in the vacuum split mold and one to be used as a check on the as-compacted moisture content. A summary of the target, as-compacted, and actual (post-Mr test) moisture contents, target and actual dry unit weights, and calculated degrees of saturation are given in Table 4 in the Results and Discussion section.
13
RESULTS AND DISCUSSION Compaction Parameters Three types of test results were generated during the course of this study: target dry unit weight for Mr testing (using AASHTO T 99), as-compacted and post-Mr test moisture content, and resilient modulus. T 99 results were presented in the Technical Approach section. Table 4 shows a summary of the target, as-compacted, and actual (post-Mr test) moisture contents, target and actual dry unit weights, and calculated degrees of saturation. As can be seen, the specimens lost very little moisture from drainage during the tests, both aggregate types had about the same effective moisture contents (1.8%), and the actual dry unit weights were very close to the target unit weights. Also included in Table 4 are results for the as-delivered materials that were tested in the previous MoDOT Mr study (1). The large difference in saturation between the open graded gradations in the present study and the asdelivered gradations in the previous study should be noted. Also shown are the regression coefficients generated from fitting the Mr data to the constitutive model as described in Part 2 Chapter 2 of the Mechanistic-Empirical Pavement Design Guide (M-E PDG) (13). These will be discussed below. Regression Coefficients Additional information from the testing includes the computation of the regression coefficients (k1, k2, k3 ) which were generated by fitting the Mr data to the model shown in Eq. 1: k2
⎛ θ ⎞ ⎛ τ oct ⎞ Mr = k 1 pa ⎜ ⎟ ⎜ +1⎟ ⎝ pa ⎠ ⎝ pa ⎠ Where
k3
(1)
Mr = resilient modulus, psi θ = bulk stress = σ1 + σ2 + σ3, psi σ1 = major principal stress, psi σ2 = intermediate principal stress = σ3 for Mr test on cylindrical specimen, psi σ3 = minor principal stress/confining pressure, psi 1 2 2 2 τoct = octahedral shear stress = (σ 1 − σ 2 ) + (σ 1 − σ 3 ) + (σ 2 − σ 3 ) , psi 3 pa = normalizing stress (atmospheric pressure; in this case, 14.7 psi) k1, k2, k3 = regression coefficients
In other words, a given specimen is tested at 15 different stress states. θ, τoct, and Mr are calculated from the data. Using the above model (Eq. 1), the regression constants k1, k2, k3 are determined for each specimen. A non-linear regression analysis procedure included in a statistical software package called SigmaStat® was 14
used for this portion of the work. Data used for the regressions are included in Appendix B Quality of the Testing Program
Per recommendations in the M-E PDG, regressions are performed on individual specimen data to evaluate the validity of the test. The M-E PDG recommendation is that the goodness-of-fit statistic, R2, be at least 90% for each set of individual specimen tests (15 stress states, one specimen). Because R2 is not the most appropriate goodness-of-fit statistic when using non-linear regression techniques, the statistic Se/Sy was also included in the results. Se is the standard deviation of the residuals (the difference between the predicted and observed Mr values), and Sy is the standard deviation of the observed Mr values. Smaller Se/Sy values indicate a better fit. Regression coefficients were also determined by pooling the data (45 sets of stress states [15 stress states per replicate specimen, three replicate specimens] and resulting Mr values) from all three replicates and fitting it to Eq. 1. The pooled regression coefficients will be used for comparison purposes in this section. Table 4: Summary of Results 2
R k2 k3 k1 Specimen Target Dry Target As-Compacted Actual Actual Actual and Unit Weight Moisture Moisture Dry Density Moisture Saturation* Statistics (pcf) (%) [7th lift] (%) (pcf) (%) (%) Gasc A-D1 133.7 9.4 9.8 133.9 8.9 92.6 1456.506 0.783 -0.353 0.998 Gasc A-D2 133.7 9.4 9.9 133.8 8.8 91.6 1429.921 0.752 -0.323 0.997 Gasc A-D3 133.7 9.4 9.8 133.7 8.9 92.4 1298.257 0.796 -0.325 0.996 Pooled Regression Average 9.8 133.8 8.9 92.2 St Dev. 0.0828 0.0647 0.0491 0.5420 1394.519 0.777 -0.334 0.989 Coeff. Var (%) 0.8424 0.0484 0.5511 0.5877 Gasc O-G1 111.2 6.0 6.4 111.5 5.6 28.7 1997.677 0.724 -0.340 0.988 Gasc O-G2 111.2 6.0 6.2 111.5 5.6 28.8 1782.632 0.724 -0.215 0.991 Gasc O-G3 111.2 6.0 6.5 111.4 5.6 28.9 2130.596 0.664 -0.403 0.990 Average 6.4 111.5 5.6 28.8 Pooled Regression St Dev. 0.1165 0.0603 0.0265 0.0914 1966.229 0.703 -0.316 0.979 Coeff. Var (%) 1.8302 0.0541 0.4725 0.3177 BF A-D1 138.0 7.4 7.2 138.2 6.8 86.1 2044.140 0.632 -0.320 0.994 BF A-D2 138.0 7.4 7.3 138.3 6.8 86.4 2281.441 0.541 -0.321 0.987 BF A-D3 138.0 7.4 7.3 138.3 6.7 85.9 2098.281 0.610 -0.328 0.988 Average 7.2 138.3 6.8 86.1 Pooled Regression St Dev. 0.0800 0.0779 0.0223 0.2767 2139.855 0.594 -0.322 0.985 Coeff. Var (%) 1.1045 0.0564 0.3291 0.3213 BF O-G1 115.5 3.9 4.5 115.5 3.7 22.0 3050.980 0.563 -0.265 0.995 BF O-G2 115.5 3.9 4.0 115.6 3.7 21.8 2741.661 0.637 -0.304 0.995 BF O-G3 115.5 3.9 4.3 115.4 3.6 21.3 2882.995 0.589 -0.293 0.992 Pooled Regression Average 4.3 115.5 3.7 21.7 St Dev. 0.2296 0.0531 0.0537 0.3323 2891.444 0.596 -0.287 0.989 Coeff. Var (%) 5.3978 0.0460 1.4531 1.5307 *A-D Saturations based on CoreLok specific gravities; O-G Saturations based on T 85 results
Se/Sy
0.050 0.058 0.068 0.110 0.134 0.102 0.108 0.092 0.086 0.122 0.120 0.125 0.080 0.080 0.098 0.083
Before performing the pooled regressions, variability among the replicate specimens of the Gasc O-G and BF O-G materials was analyzed using a one-way analysis of variance (ANOVA). Three parameters were analyzed relative to the effect that differences among the replicate specimens may have on them: Mr, deviator stress (σd), and confining pressure (σ3). Table 5 shows the results of the basic ANOVA.
15
Table 5: Replicate One-Way Anova Mr vs. Replicate σd vs. Replicate Material 2 p-value R2 (%) p-value R (%) Gasc O-G 0.921 0.39 1.000 0.00 BF O-G 0.936 0.31 1.000 0.00
σ3 vs. Replicate p-value R2 (%) 1.000 0.00 1.000 0.00
The higher the p-value is (1.000 is maximum; 0.000 is minimum) or the lower the R2 value is (1.000 is maximum; 0.000 is minimum), the lower the probability that the replicates are different. To verify that any differences between the Mr values (per stress state, per replicate) are strictly a function of the replicate specimen material conditions, the stress parameters (σd and σ3) were analyzed in regard to the replicates. In all cases, the differences in the σd and σ3 values were so small as to be completely insignificant, which makes sense, as these parameters are not really responses but computer-controlled inputs. Based on the p-values and R2 values, and comparing the two aggregates, the Gasc O-G aggregate possessed the most Mr variability between replicate specimens. However, the replicate Mr variability for both aggregates was highly insignificant at an alpha = 0.05 (95% confidence) level; i.e. the p-values for both were much greater than 0.05, meaning that the replicates were very similar per aggregate. Effect of Gradation on Mr
Looking only at k1 (the intercept or scaling factor for Eq. 1) from the pooled regressions in Table 4, one can see that, for both aggregates, the O-G aggregate k1 values were considerably higher than those of the corresponding A-D aggregate, indicating that the O-G material was much stiffer. A major factor in this increased stiffness is the much lower degree of saturation present in the O-G specimens relative to the A-D specimens. Haynes and Yoder (14) showed that 80-85% saturation was the general range at which the deflection (i.e. stiffness) properties of dense-graded base materials used in the AASHO Road Test began to be severely affected. This is the primary advantage of open-graded base courses; provided they remain permeable, there is a practical upper limit to the degree of saturation thereby insuring long-lasting stability of the pavement structure. Table 6 shows a comparison of the two materials in regard to Mr (as calculated by Eq. 1 and using the pooled regression coefficients) for a stress state of θ = 12 psi (σ1 = 6 psi, σ2 and σ3 = 3 psi each). For discussion purposes, Table 6 also includes Mr values reported in the previous MoDOT Mr study (1) that resulted from testing specimens with a higher fines content (W-F) created with a blend of as-delivered material (95%) and additional fines (5%).
16
Table 6: Resilient Moduli at θ = 12 psi
Material Bethany Falls Gasconade
Properties Mr (psi) P200 (%) Mr (psi) P200 (%)
W-F 22776 17.6 17101 14.2
Gradations A-D 27071 13.8 16980 10.7
O-G 36682 0 24344 0
Δ Mr (%) [(O-G) – (A-D)] +35.5 +43.4
As reported in the previous MoDOT Mr study (1), a decreased fines content had mixed effects: some materials experienced an increase in Mr (at a particular stress state) and some experienced a decrease in Mr. At θ = 12 psi, this is the case for the Gasconade and Bethany Falls material as reflected in Table 6: the Bethany Falls aggregate had a higher Mr with a reduction in fines while the Gasconade had a slightly lower Mr with a reduction in fines at elevated levels (i.e. when reducing P200 from 14.2 to 10.7%) that might be statistically insignificant. However, when the fines content was reduced to zero percent, a significant increase in Mr (relative to the A-D condition) occurred for both the Bethany Falls aggregate (35.5% increase) and the Gasconade aggregate (43.4% increase), again, for this particular stress state. Figures 5 through 8 show the plots of Mr versus θ, and Mr versus τoct using the pooled data from the three replicate Mr tests per aggregate. The three series on each plot represent the three gradations that have been investigated in this and the previous MoDOT Mr study. As can be seen, in general, the trend is that as fines decrease from the W-F (14.2 -17.7% fines) to A-D (10.7 -13.8% fines) to O-G (zero fines), at a given stress state, Mr increases.
17
1000000
Mr (psi)
O-G 0.5158 y = 10268x 2 R = 0.9709
100000
A-D 0.4899 y = 8252.3x 2 R = 0.9616 W-F 0.5592 y = 5832.9x 2 R = 0.9608 10000 1
10
100
1000
Bulk Stress = Theta (psi) A-D
W-F
O-G
Power (A-D)
Power (W-F)
Power (O-G)
Figure 5: Bethany Falls; Pooled Mr vs θ; O-G, A-D, and W-F Gradations
1000000
Mr (psi)
O-G 0.4049 y = 32848x 2 R = 0.653 A-D 0.3782 y = 25183x 2 R = 0.6248 100000
W-F 0.4343 y = 20735x 2 R = 0.63 10000 1
10
100
Octahedral Shear Stress (psi) A-D
W-F
O-G
Power (A-D)
Power (W-F)
Power (O-G)
Figure 6: Bethany Falls; Pooled Mr vs τoct; O-G, A-D, and W-F Gradations
18
100000
A-D 0.6911 y = 3045.3x 2 R = 0.9813
Mr (psi)
O-G 0.6272 y = 5076.5x 2 R = 0.959 W-F 0.6116 y = 3775.8x 2 R = 0.9532
10000 1
10
100
1000
Bulk Stress = Theta (psi) A-D
W-F
O-G
Power (A-D)
Power (W-F)
Power (O-G)
Figure 7: Gasconade; Pooled Mr vs θ; O-G, A-D, and W-F Gradations
100000
O-G 0.5009 y = 20555x 2 R = 0.6603
Mr (psi)
A-D 0.554 y = 14159x 2 R = 0.6893
W-F 0.4778 y = 15057x 2 R = 0.6358
10000 1
10
100
Octahedral Shear Stress (psi) A-D
W-F
O-G
Power (A-D)
Power (W-F)
Power (O-G)
Figure 8: Gasconade; Pooled Mr vs τoct; O-G, A-D, and W-F Gradations
19
Optimum Fines Content
Past studies have shown that there is an optimum amount of fines for maximum strength and stiffness of unbound granular base materials. Yoder and Witczak (15) showed an optimum range of 6 to 9% fines for maximum CBR. The National Crushed Stone Association classical study (16) of the effect of various parameters on triaxial shear strength reported optimums of 8 to 12%. For resilient modulus, Jorenby and Hicks (17) reported optimum fines around 5%. For the present study, it could be argued that the two fines contents tested in the two studies performed for MoDOT were on the low side (zero %) and the high side (11 and 14%) of what would have been the optimum. A plot of Mr versus P200 based on data in Table 6 is given in Figure 9. 50000
POSSIBLE OPTIMUMS?
45000 40000 35000
Mr (psi)
30000 25000 20000 15000
BF
Gasc
10000 5000 0 0
2
4
6
8
10
12
14
16
18
P200 (%)
Figure 9: Mr (at θ = 12 psi) versus P200
As indicated in Figure 9, one could postulate that there may be an optimum fines content for a particular aggregate, with a particular overall gradation, a particular degree of saturation, and at a particular stress state that would produce the maximum Mr for such conditions. More testing on these aggregates is needed to address this question.
20
20
Comparison to Past Studies
The issue of the effect of fines (and gradation in general) on Mr has been addressed in the literature review of a previous study for MoDOT by Richardson and Kremer (18), where it was reported that as fines content increases, resilient modulus decreases (19-22). There was some support of the idea that a high degree of saturation generated pore pressures which lowered Mr (19), thus explaining the reason why some open-graded mixtures have greater Mr values than dense-graded materials, although some studies showed the opposite (19, 22) or at least that gradation is of a negligible significance (23). Others, as noted above, report that an optimum fines content exists. More recent studies have shown a decrease in Mr upon an increase in fines from 6 to 12% (24).The Richardson and Kremer study itself reported that of the four aggregates tested, two showed an increase in Mr when moving from a dense gradation to an open gradation, one showed essentially no change, and one showed a decrease. In a more recent literature review, Liang (25) cited Hicks and Monismith (26), Barksdale (19), Thom and Brown (23), Barksdale and Itani (27), Rada and Witczak (28), Knutson and Thompson (29), Raad, et al. (30), Thompson and Smith (22), Kamal, et al. (31), Tian, et al. (32), and Heydinger, et al. (33). The conclusions in the cited references varied in regard to the effect of fines content (or gradation in general) on Mr. Excerpts from Liang’s literature review are inserted below: Hicks and Monismith: Hicks and Monismith, among others, studied Mr by using the previously popular bulk stress model given as
Mr = k 1 (θ ) Where
k2
(2)
Mr = resilient modulus, psi θ = bulk stress = σ1 + σ2 + σ3, psi k1, k2, = regression coefficients
Liang’s comments are as follows: “[Hicks and Monismith] indicated that the bulk stress model parameters k1 and k2 were affected by the fines content. The manner in which k1 changes depends on the aggregate type. For the partially crushed aggregate, k1 generally decreased as the fines content was increased. For the crushed aggregate, however, k1 increased with increasing fines content. The same trends were also observed for the partially saturated and saturated test series. For k1, it appeared that it decreased slightly as fines content increased. They also found that k1 was always larger for the crushed aggregate than the partially crushed material, regardless of aggregate gradation.”
Barksdale; Thom and Brown; Barksdale and Itani: According to Liang, these studies generally agreed with Hicks and Monismith: 21
“Their [Hicks and Monismith] test results seemed to agree with later studies [Barksdale; Thom and Brown; Barksdale and Itani] who observed a decrease in the value of resilient modulus as the fines content was increased.”
Rada and Witczak: Liang’s comments are as follows: “On the other hand, [Rada and Witczak] found that the effect of aggregate gradation showed no general trend regarding the influence of fines (percentage pass No.200 sieve) on resilient modulus. For the angular base materials (DGA and CR-6 aggregate), there appeared to be little change in either k1 or k2 for P200 values in the range of 7-17%. For bank-run gravel, an optimum k1 value was apparently near the dense condition, and a marked decrease in k1 occurred as the P200 value increased. In contrast, k2 appeared to increase with an increase in fines content. Although no pronounced changes occurred in k1and k2 for the base materials, increase in P200 beyond the 16-18 percent range would eventually lead to pronounced change in the MR response of these materials.”
Knutson and Thompson: Knutson and Thompson studied railroad ballast, an opengraded aggregate. Liang’s comments are as follows: “[Knutson and Thompson] found no difference in resilient modulus between an ASTM No. 4 and No. 5 very open graded railway ballast aggregate. The tested aggregate grading presented lower resilient moduli than conventional well-graded aggregate. The No. 4 and No. 5 ballast were practically insensitive to change in water content due to their high permeability.”
Raad, et al.: Liang’s comments are as follows: “[Raad, et al.] found that the densest graded aggregate exhibit the highest MR values, and the open graded aggregate has the lowest values. However, the saturated granular materials will develop excess pore water pressure under undrained conditions, which could lead to a decrease in MR values. Open-graded aggregates are more resistant to pore water pressure buildup than are dense graded aggregate and therefore are less likely to induce damage in pavement under saturated conditions.”
Although the Mr test results in this study are contrary to the results cited in the above Raad, et al. excerpt, the commentary about pore water pressure is important to understand. Although T 307 is performed with the drainage lines open, this does not necessarily insure “drained” conditions within dense-graded specimens. Loading times in the Mr test are so quick that pore water pressure may not fully dissipate during the 0.1 second stress pulse thereby lowering the instantaneous vertical effective stress (i.e. σd′) experienced by the specimen and, therefore, reducing the Mr. The likelihood of pore water pressure building in open-graded aggregates is, even for very short periods of time, much less than in dense-graded aggregates. Thompson and Smith: Liang’s comments are as follows: “[Thompson and Smith] reported that for gradations that differ only in the permissible amount passing sieve No.200, limited differences in MR were noted among the various granular materials.”
22
Kamal, et al.: Liang’s comments are as follows: “[Kamal, et al.] found that resilient modulus will increase from the finer to the coarser mix and there is a slight increase in resilient modulus with increasing deviator stress. The resistance to shear and volumetric strains tends to increase from the finer to the coarser end of the proposed grading envelopes.”
Tian, et al.: Liang’s comments are as follows: “[Tian, et al.] indicated that the coarse gradation limit will produce the highest resilient modulus.”
Heydinger, et al.: Liang’s comments are as follows: “[Heydinger et al.] found that resilient modulus of aggregate was affected by aggregate gradation. They found that for limestone aggregate, the open graded specification had higher moduli than the dense graded specification. The moduli were highest for the upper gradation and lowest for the lower gradation for the Iowa mix. For gravel there was no strong trend for the variation of resilient moduli with respect to gradation.”
As indicated in the previous excerpts, the effect of fines on Mr depends on other variables, some of which are not obviously evident. In the case of the two aggregates tested in this study, however, there is a definite increase in Mr with a reduction in fines from the levels present in the A-D gradations to the level present in the O-G gradation; i.e. no fines. However based on issues discussed in the literature review excerpts above, one must consider that the increase in Mr from the A-D condition to the O-G condition could be a function of the differences in the overall gradations, not just the difference in fines content. Constructibility
When contemplating the use of unbound, open-graded base courses, one must also consider how the material will behave under construction traffic. In general, as the fines content decreases, cohesion of the compacted aggregate also decreases. This poses the potential for significant disturbance or deformation of the compacted, unbound, open-graded base course as dump trucks, trimmers, pavers, etc. travel across it. In a sub-section of the 2003 Michigan special provision cited in the Technical Approach section of this report (7), the Michigan DOT addresses this issue of construction equipment travel on an open-graded base course as follows: “Equipment Travel - Delete subsection 303.03.C of the Standard Specifications for Construction and replace with the following. Equipment travel on the OGDC for placement of OGDC will be permitted provided that a minimum of 2 inches of additional OGDC aggregate is placed. All costs associated with placement of the additional aggregate and removal or trimming thereof will be borne by the Contractor. Any removed OGDC aggregate, which will be re-used on this or any MDOT
23
project, must be stockpiled and re-tested to verify the aggregate meets the specification requirements for the intended item of use. Where no lateral space exists due to permanent physical obstructions, maintaining traffic requirements or other unavoidable conditions, concrete or Hot Mix Asphalt delivery to the paver via OGDC will be permitted provided that: A. the specified in-place OGDC gradation is maintained and no other damage to the grade, subbase or subgrade occurs; and B. varied truck routes or paths are used to minimize the potential for damage to the roadbed. Correct all observed degradation to the OGDC resulting from equipment travel, according to subsection 303.02.E.2 of the Standard Specifications for Construction. Protect the underdrain system from damage at all entry and exit points.”
Wisconsin, too, writes into its specifications detailed instructions on constructing and maintaining base courses, both dense and open-graded (11): “301.3.4 Constructing Base 301.3.4.1 General (1) Place aggregate in a manner that minimizes hauling on the subgrade. Do not use vehicles or operations that damage the subgrade or in-place base. Deposit material in a manner that minimizes segregation. (2) Construct the base to the width and section the plans show. Shape, and compact the base surface to within 0.04 feet (12 mm) of the plan elevation. (3) Ensure there is adequate moisture in the aggregate during placing, shaping, and compacting to prevent segregation and achieve adequate compaction. (4) Maintain the base until paving over it, or until the engineer accepts the work, if paving is not part of the contract. The contractor is not responsible for maintaining material placed on detours, unless the special provisions specify otherwise.”
The issue of damage to unbound, open-graded base courses due to construction traffic is probably the reason many states have moved to or adopted asphalt or cement treated permeable bases. If unbound permeable bases are to be used, the trick is to specify a gradation that strikes a balance between stability and drainability. Table 7 shows the Michigan, Oregon, and Wisconsin open-graded aggregate gradation specification relative to MoDOT’s current and proposed Type 5 gradation specification, and the experimental gradation used for this study. Comparison of Experimental Gradations to Other DOT Gradations
The first thing one notices in Table 7 is the significantly smaller maximum allowable P200 that Michigan, Oregon, and Wisconsin specify relative to Missouri, the greatest being 6% maximum allowed by Michigan. In referring back to Figure 1, 6% is essentially the minimum P200 being produced in Missouri for a Type 5 base aggregate. Although the experimental gradation was built with washed aggregates and 0% fines, it is unrealistic to expect 0% fines in the crushed aggregates produced 24
in Missouri, and especially once they are in-place in the pavement structure. Even if one started with perfectly clean aggregate at the quarry, handling, trucking, dumping, shaping, and compacting the base material would generate significant fines. Table 7: Various State Specifications for Open-Graded Aggregates Sieve Size (mm) Standard 37.5 1.5" 25.0 1" 19.0 3/4" 12.5 1/2" 9.50 3/8" 4.75 #4 2.36 #8 2.00 #10 1.18 #16 0.600 #30 0.425 #40 0.300 #50 0.150 #100 0.075 #200 * Dry Sieved Basis
Michigan 100 60-80 35-65 10-25 5-18
0-6
States and Gradation Specifications (% Passing) Missouri Current Proposed Oregon Wisconsin Type 5 Type 5 Experimental 100 80-98 60-85 30-65
90-100
5-20
0-20
0-6 0-3*
45-65 15-45
0-10 0-5.0
100
100
60-90
60-90
35-60
25-60
10-35
5-35
11.6 5.0
0-15
3.3 1.6 0.0
0-15
100.0 96.0 80.0 69.0 25.0 18.3
Another interesting observation in Table 7 is that Wisconsin has the greatest number of control sieves on the finer side of the gradation spectrum (#4 to #200, inclusive). It has been argued that it is the mid-sized fine aggregate fractions (say, #8 to #40) that really contribute to establishing the balance between stability and drainability. Having a relatively well-graded particle distribution, especially in the mid-sized sands range, helps with aggregate interlock and thereby increases stability while, at the same time, limiting the fines content contributes to increased drainability. In looking again at the experimental gradation used in this study, one notices that the size fraction dominating the overall particle size distribution is that aggregate fraction passing the 3/8” sieve and retained on the #4; 44% of the entire gradation falls in this narrow fraction. This is mostly a function of choosing to build the gradation in such a way as to isolate the effects of the proposed gradation change on the Mr of the material to the finer side of the gradation. However, the particle distribution of the material passing the #4 correlates fairly well with the specifications of the other three states. Although permeability testing was not in the scope of this investigation, one could argue that the permeability of the experimental gradation would approach that of the open-graded aggregates specified by the other states. It should be noted that the Mr specimens built to the experimental O-G gradation required compactive effort comparable to the stiffest A-D specimens and the particle size distribution throughout the Mr specimens remained visibly homogenous. The 25
non-segregation of aggregate particles during vibratory compaction is believed to be the result of compacting at a moisture content ~2% greater than the absorption of the aggregate thereby providing sufficient, but not excessive, moisture to bind the finer particles to the coarser particles. However, the almost total lack of cohesion of the aggregate particles was apparent during scarification of each lift after vibratory compaction. When scarifying the A-D Mr specimens during the previous MoDOT Mr study (1), a stainless steel laboratory spatula had to be used for scarifying (cutting) the top of each lift prior to compaction of the successive lift (per T 307) because the surface of the lift was hard and bound tightly. When scarifying each lift of the O-G Mr specimens, a rubber tipped kitchen spatula was used to lightly disturb the surface of each lift, which came apart with very little effort. This demonstrated the issue discussed earlier about the problem of stability (or maybe better defined as fragility) of the open-graded material under construction equipment.
26
CONCLUSIONS
Based on the results of the testing performed for this investigation, limited as it was, one can conclude the following:
•
• •
Mr results in this study (coarser, lower percent fines gradation) increased when compared to test results from the previous MoDOT Mr study in which the same aggregates were tested but typical Type 5 gradations (denser, higher fines) were investigated. A major factor in the increased Mr most likely was the lower degree of saturation present in the relatively open-graded specimens of this study in comparison to the dense-graded specimens examined in the previous study. For those aggregate producers that could benefit from the proposed specification change, it seems likely that fewer fines would be generated during production thereby increasing the probability of a more drainable base aggregate. Constructibility is of concern. However, compacting open-graded aggregates at a moisture content ~2% above absorption 1) provides sufficient particle surface moisture for compaction lubrication purposes and for binding the finer particles to the coarser particles through apparent cohesion (i.e. high negative pore pressure caused by small menisci radii) thereby reducing the probability of dry-aggregate segregation, but 2) limits excess water that could hinder maximum densification or flush the finer fractions during compaction (i.e. segregate the particles).
27
RECOMMENDATIONS – FUTURE RESEARCH
•
• • •
•
If drainability is still the main purpose for specifying a Type 5 base aggregate, consideration should be given to lowering the maximum percentage passing on certain control sieves. Aggregate producers could possibly generate this material by blending two (or more) lower-quality aggregates already in production. The concept of compaction of open-graded aggregates at a moisture content ~2% above absorption needs more study. To better characterize the change in Mr that the proposed Type 5 gradation specification will cause, Mr tests should be performed along the lower bounds of the current Type 5 specification. As Mr tests might not be the best measure of determining the effects of the change in the Type 5 gradation specification on pavement performance, thus other types of tests (e.g. triaxial shear, CBR, cyclic total deformation) should be investigated. More Mr testing is required to determine the optimum fines content for particular aggregates under particular conditions. Regression equations could be developed to determine those fines content levels that would maximize Mr.
28
REFERENCES
1.
Richardson, D. N., Petry, T., Ge, Y., Han, Y., Lusher, S. M,, Resilient Moduli of Typical Missouri Soils and Unbound Granular Base Materials, Final Report for Missouri DOT Project RI06-001. Prepared by Missouri University of Science & Technology, Department of Civil, Architectural, and Environmental Engineering, Rolla, Missouri. 2008. 2. Determining the Resilient Modulus of Soils and Aggregate Materials, in AASHTO T 307-99 (2003). American Association of State Highway and Transportation Officials, Washington, D.C. 2003. 3. Specific Gravity and Absorption of Coarse Aggregate, in AASHTO T 85-91 (2000). American Association of State Highway and Transportation Officials, Washington, D.C. 2000. 4. ASTM Standard Test Methods for Maximum Index Density and Unit Weight of Soils Using a Vibratory Table, D 4253-00 (Reapproved 2006), American Society of Testing Materials, West Conshohocken, PA. 2006. 5. Moisture Density Relations of Soils Using a 2.5-kg (5.5-lb) Rammer and a 305mm (12-in.) Drop, in AASHTO T 99-01. American Association of State Highway and Transportation Officials, Washington, D.C. 2001. 6. White, D. J., Vennapusa, P., Jahren, C. T. Determination of the Optimum Base Characteristics for Pavements. Final Report for Iowa DOT Project TR-482. Prepared by Center for Transportation Research and Education (CTRE Project 02-119), Iowa State University, Ames, Iowa. May 2004. Website accessed September 22, 2008, http://www.ctre.iastate.edu/reports/tr482.pdf 7. Michigan Department of Transportation, Special Provision for Open-Graded Drainage Course, Modified; O3SP303(A), FHWA:APPR:02-07-06. Website accessed September 22, 2008, http://mdotwas1.mdot.state.mi.us/public/dessssp/spss_source/03SP303A.pdf 8. Michigan Department of Transportation, 2003 Standard Specifications for Construction, Section 303: Open-Graded Drainage Courses. Website accessed September 22, 2008, http://mdotwas1.mdot.state.mi.us/public/specbook/ 9. Oregon Department of Transportation, 2008 Standard Specifications, Section 00641: Aggregate Subbase, Base, and Shoulders. Website accessed September 22, 2008, http://www.oregon.gov/ODOT/HWY/SPECS/docs/08book/08_00600.pdf 10. Ohio Department of Transportation, 2008 Construction and Materials Specifications, Supplement 1015: Compaction of Unbound Materials; Effective 4/21/2006. Website accessed September 22, 2008. http://www.dot.state.oh.us/Divisions/ConstructionMgt/Specification%20Files/101 5_04212006_for_2008.PDF 11. Wisconsin Department of Transportation, 2008 Standard Specifications, Section 301.3.4.2: Standard Compaction. Website accessed September 22, 2008, http://roadwaystandards.dot.wi.gov/standards/stndspec/sect301.pdf
29
12. Wisconsin Department of Transportation, Construction and Materials Manual, Procedure 4-15-32: Appendix A: Permeability Apparatus and Procedure. Website accessed September 22, 2008. http://roadwaystandards.dot.wi.gov/standards/cmm/4-15-32.pdf 13. Guide for Mechanistic-Empirical Design of New and Rehabilitated Pavement Structures, Part 2, Chapter 2, Materials; page 2.2.66. Website accessed September 22, 2008. http://www.trb.org/mepdg/Part2_Chapter2_Materials.pdf 14. Haynes, J.H. and E.J. Yoder, Effects of Repeated Loading on Gravel and Crushed Stone Base Course Materials Used in the AASHO Road Test. Highway Research Record, No. 39. 1963. p. 82-96. 15. Yoder, E.J. and M.W. Witczak, Principles of Pavement Design, 2nd ed., Wiley and Sons, 1975, 711 p. 16. Gray, J. E., Characteristics of Graded Aggregate Base Course Aggregates Determined by Triaxial Tests, National Crushed Stone Association Engineering Bulletin No. 12, Washington, D.C., 1962. 17. Jorenby, B. N., and R. G. Hicks, Base Course Contamination Limits, Transportation Research Record No. 1095. 1986. pp 86-101. 18. Richardson, D.N. and P.A. Kremer, Determination of AASHTO Layer Coefficients: Volume II: Unbound Granular Bases and Cement Treated Bases. University of Missouri-Rolla, Department of Civil Engineering, Rolla, Missouri. 1994. 19. Barksdale, R. D., Laboratory Evaluation of Rutting in Base Course Materials, In Proceedings of the Third International Conference on Structural Design of Asphalt Pavements, London, England, 1972, pp 161-174. 20. Barksdale, R.D., S.Y. Itani, and T.E. Swor, Evaluation of Recycled Concrete, Open-Graded Aggregate, and Large Top-Size Aggregate Bases, Transportation Research Record No. 1345. 1992. p. 92-100. 21. Barker, W. R., and R. C. Gunkel, Structural Evaluation of Open-Graded Bases for Highway Pavements, Miscellaneous Paper GL-79-18, U.S. Corps of Engineers, WES. 1979. 82 p. 22. Thompson, M. R., and K. L. Smith, Repeated Triaxial Characterization of Granular Bases, Transportation Research Record No. 1278. 1990. pp 7-17. 23. Thom, N. H., and S. F. Brown, The Effect of Moisture on the Structural Performance of a Crushed Limestone Road Base, Annual Transportation Research Board Meeting, Washington, D. C. 1987. 24. Thornton, S. I., and R. P. Elliott, Fines Content of Granular Base Materials, Final Report for Arkansas DOT (Report No. FHWA/AR-89/003). Prepared by Arkansas Highway and Transportation Center, Fayetteville, Arkansas. 1988. 25. Liang, R., Evaluation of Drainable Bases Under Asphalt Pavement, Final Report for Ohio DOT (Report No. FHWA/OH-2007/10). Prepared by University of Akron, Dept. of Civil Engineering, Akron, Ohio. May 2007. Website accessed September 22, 2008. http://www2.dot.state.oh.us/research/2007/Pavements/14804-FR.pdf 26. Hicks, R. G. and C. L. Monismith, Factors Influencing the Resilient Response of Granular Materials, Transportation Research Record No. 345. 1971. pp 15-30.
30
27. Barksdale, R. D., and S. Y. Itani, Influence of Aggregate Shape on Base Behavior, Transportation Research Record No. 1227. 1990. pp 173-182. 28. Rada, G., and M. W. Witczak, Comprehensive Evaluation of Laboratory Resilient Moduli Results for Granular Material, Transportation Research Record No. 810. 1981. pp 23-33. 29. Knutson, R. M., and M. R. Thompson, Resilient Response of Railway Ballast, Transportation Research Record, No. 651. 1978. pp 31-39. 30. Raad, L., Minassian, G. H., Gartin, S., Characterization of Saturated Granular Bases Under Repeated Loads, Transportation Research Record No. 1369. 1992. pp 73-82. 31. Kamal, M. A., Dawson, A. R., Garouki, T., Hughes, D. A. B., Shaa’at, A. A., Field and Laboratory Evaluation of the Mechanical Behavior of Unbound Granular Materials in Pavements, Transportation Research Record No. 1406. 1993. pp 88-97. 32. Tian, P., Zaman, M. M., Laguros, J. G., Gradation Effects on Resilient Moduli of Aggregate Bases, Transportation Research Record No 1619. 1998. pp 75-84. 33. Heydinger, A. G., Xie, Q., Randolph, B. W., Gupta, J. D., Analysis of Resilient Modulus of Dense- and Open-Graded Aggregates, Transportation Research Record No. 1547. 1996. pp 1-6.
31
APPENDIX A
In the latest on-line-available specifications, special provisions, supplements, etc., Michigan, Oregon, and Wisconsin (and there could be more) do specify unbound, open-graded, permeable bases in pavement construction. An excerpt from a 2003 Michigan special provision (7) is as follows: “c. Construction. Construct the open-graded drainage course (OGDC) according to Section 303 of the Standard Specifications for Construction with the following modifications. 1. Placement and Compaction - Place and compact a control strip as specified in section (c.3.A) of this Special Provision to establish a placement and rolling pattern that will achieve at least 95 percent compaction. If a thickness greater than 8 inches is specified, place the OGDC in two approximately equal lifts. Compact each layer to not less than 95 percent of its maximum unit weight. Finish the surface of the OGDC as specified in subsection 303.03.B of the Standard Specifications for Construction.”
This particular sub-section of the special provision does not indicate the test method to use to determine maximum dry unit weight. Referring to Section 303 of the Standard Specifications for Construction (8) in hopes of finding guidance on how to determine maximum unit weight yielded the following: “303.03 Construction. A. Preparation. Furnish and install the separation treatment, as specified on the plans, between the OGDC and the subbase. B. Placement and Compaction. Place open-graded aggregate according to subsection 302.03 except that the density requirements are replaced by the following. Compact the open-graded aggregate with three complete passes of a minimum 10-ton, steel drum tandem roller. One complete pass will be down and back in the same path.”
So, assuming special provisions supersede standard specifications, it seems Michigan has replaced a compaction method based on roller-type and roller patterns to a percent compaction determination, but has not clearly specified how to determine the reference or maximum dry unit weight. Oregon and other states also use the roller-type and roller-pattern method of compacting unbound, open-graded aggregates. An excerpt from Oregon’s 2003 Standard Specifications Section 00641 (9) is as follows: “00641.44 Shaping and Compacting: (a) Aggregate Base Courses: (1) Dense-graded Aggregates - Begin compaction of each layer of dense-graded aggregates immediately after the material is spread and continue until a density of not less than 100% of the maximum density has been achieved when tested according to the MFTP. (2) Open-graded Aggregates - Compact the surface of each layer of open-graded aggregates using rollers conforming to 00641.24. Roll until there is no appreciable reaction or yielding under the compactor.”
32
The Oregon specification also indicates a percent compaction of maximum “density” for the dense-graded aggregates and does not directly indicate in this sub-section the method to be used to determine said maximum density. However in an earlier sub-section, reference is made to T 99 and an optimum moisture content: “00641.12 Limits of Mixture - Provide a mixture of aggregate and water having a uniform moisture content sufficient to obtain the required compaction. Water may be introduced in a mixing plant, or on the grade. Determine the proportion of aggregate and water according to AASHTO T 99 and AASHTO T 224. Proportions will be in percentages by weight and will be known as the "Mix Design". The amount of water required in the mix design will normally be within a range of 5% to 10% of the mixture, based on dry weight of the aggregates. The mixture furnished shall conform to the mix design with a tolerance in optimum water content of plus or minus 2%. Any mixture having water content in excess of 2% over the Mix Design may be accepted for use, according to 00641.80(d), if approved.”
It appears that the use of unbound, open-graded base courses has recently been discontinued in Ohio. However, they do specify using field test sections to determine maximum dry unit weight of unbound granular base materials. The test section method utilized depends on whether or not the aggregate has a definite moisturedensity relationship (determined using various optional methods). If there is a definite moisture-density relationship, T 99 is used to determine the optimum moisture content and then the test sections are built at that moisture content and rolled until a maximum dry unit weight is achieved. If there is not a definite moisturedensity relationship, test sections are built at various moisture contents (starting at 0 to 3% moisture and increasing by 2% for every test section), rolled until a maximum dry unit weight for each moisture content is achieved, and then the maximum dry unit weight determined for the field testing (essentially, a field proctor curve) is used for base construction purposes (10). Wisconsin specifies a “standard” compaction method for unbound, open-graded aggregates that is a roller-type and roller-pattern method (11). However, Wisconsin requires laboratory permeability testing on aggregates to be used in open-graded base courses which, in Section 4.1 of the Construction and Materials Manual, Procedure 4-15-32, specifies the following (12): “The target unit weight is defined as the unit weight which is achieved when the material is compacted at 6% moisture content in accordance with the methods and procedures contained in AASHTO T-99, Method C.”
The specification of a 6% moisture content seemed reasonable in that, for most base aggregates, absorption would be satisfied and there would be sufficient particle surface moisture for compaction lubrication purposes, but there would not be so much water as to flush the finer fractions during compaction (i.e. segregate the particles). This level of moisture also relates fairly well to one of the recommendations in the CTRE report (6): “As an alternative to trimming equipment (e.g. Gomaco type), use a motor grader with GPS assisted grading (i.e. stakeless grading control). If trimming equipment must be used,
33
however, ensure that the aggregate is delivered to the site with sufficient water content (7%–10 %) to bind the fines during trimming.”
This recommendation was in response to one of the findings of the CTRE report in that segregation of the open-graded base aggregates was found to occur during trimming of the compacted base course; i.e. the aggregate was too dry during trimming and, thus, the vibration of the trimmer caused the fines to segregate downward leaving coarser aggregate particles on the surface. Therefore, it seems that, for unbound, open-graded base aggregates, there needs to be sufficient moisture in the delivered material to provide lubrication for compaction and “bind the fines” to the coarse aggregate to prevent segregation, but not excessive moisture that would prevent maximum densification or cause segregation to occur due to fluid flow.
34
APPENDIX B
Sequence
SigD (psi) 3.16 6.03 9.09 5.24 10.15 15.06 10.32 20.39 30.34 10.65 15.41 30.49 16.04 20.69 40.47
Theta (psi) 12.28 15.06 18.12 20.36 25.21 30.12 40.44 50.51 60.46 55.77 60.41 75.52 76.13 80.78 100.56
Mr 1 (psi) 43134 43068 43966 56299 56774 59041 72492 79712 81906 87475 87713 94246 98925 103168 107052
Mr 2 (psi) 45887 43013 44003 53489 55334 57921 75041 79713 81904 87511 90280 94289 98980 103199 106988
Mr 3 (psi) 42982 43130 43939 53577 56813 57932 75056 81111 81934 89219 90233 94333 98911 100793 106864
Mr 4 (psi) 40100 44622 43966 53551 55239 56839 75085 79672 81908 89201 90295 94248 102039 100765 108472
Mr 5 (psi) 42573 43093 43960 50988 53807 57880 75080 79695 81864 85541 90277 94185 101904 103264 108289
Generalized NCHRP 1-28A Model (M-E Design Guide) MrN = Mr normalized to atmospheric pressure (14.7 psi) k1 3050.980 (from SigmaStat analysis) k2 0.563 (from SigmaStat analysis) k3 -0.265 (from SigmaStat analysis) Rsq 0.995 (from SigmaStat analysis) Se 124.925 (from SigmaStat analysis) Se/Sy 0.080
Mr AVG (psi) 42935 43385 43967 53581 55593 57923 74551 79981 81903 87789 89760 94260 100152 102238 107533 Sy =
MrN
MrN Pred
2920.748 2951.361 2990.952 3644.966 3781.837 3940.34 5071.497 5440.884 5571.633 5972.041 6106.122 6412.245 6813.061 6954.966 7315.17
2687.507 2951.274 3207.323 3517.268 3836.146 4116.106 5000.022 5349.806 5649.374 5979.286 6078.378 6398.857 6899.12 6957.948 7225.32
1560.792
Resilient Modulus vs. Bulk Stress - BFOG1 1000000 0.4865
y = 11791x 2
R = 0.9784 Resilient Modulus (psi)
1 2 3 4 5 6 7 8 9 10 11 12 13 14 15
Sig3 (psi) 3.04 3.01 3.01 5.04 5.02 5.02 10.04 10.04 10.04 15.04 15 15.01 20.03 20.03 20.03
100000
10000
1000 1
10
100
1000
Bulk Stress (psi)
Figure 10B: BF O-G1 Mr Data, Eq. 1 Regression Results, & Eq. 2 Plot
35
Sequence
SigD (psi) 3.12 6.05 9.13 5.23 10.18 15.17 10.35 20.38 30.39 10.49 15.42 30.51 15.59 20.65 40.68
Theta (psi) 12.18 15.14 18.22 20.2 25.21 30.2 40.47 50.5 60.51 55.58 60.54 75.63 75.74 80.8 100.83
Mr 1 (psi) 37632 36949 40455 48669 51354 53452 72943 78094 78873 87926 85112 91326 101754 100415 110708
Mr 2 (psi) 37606 38104 39529 48703 51409 54388 70532 78157 77872 87865 87298 94097 101688 102683 105349
Mr 3 (psi) 37413 38067 39526 48570 52704 54362 70450 78101 79866 84421 85137 92737 101479 102671 109164
Mr 4 (psi) 37623 38026 40402 48491 52687 53492 72951 78100 78843 87886 87329 92733 95351 102589 105205
Mr 5 (psi) 39732 38135 39555 48572 52638 55314 72988 78198 78861 87912 87334 94021 98247 102738 110596
Generalized NCHRP 1-28A Model (M-E Design Guide) MrN = Mr normalized to atmospheric pressure (14.7 psi) k1 2741.661 (from SigmaStat analysis) k2 0.637 (from SigmaStat analysis) k3 -0.304 (from SigmaStat analysis) Rsq 0.995 (from SigmaStat analysis) Se 133.940 (from SigmaStat analysis) Se/Sy 0.080
Mr AVG (psi) 38001 37856 39893 48601 52158 54201 71973 78130 78863 87202 86442 92983 99704 102219 108205 Sy =
MrN
MrN Pred
2585.102 2575.238 2713.81 3306.19 3548.163 3687.143 4896.122 5314.966 5364.83 5932.109 5880.408 6325.374 6782.585 6953.673 7360.884
2362.654 2647.049 2907.355 3202.364 3547.61 3844.687 4790.009 5164.522 5490.776 5856.813 5977.883 6325.297 6887.092 6956.088 7252.599
1682.696
Resilient Modulus vs. Bulk Stress - BFOG2 1000000 0.5514
y = 8840x 2
R = 0.9785 Resilient Modulus (psi)
1 2 3 4 5 6 7 8 9 10 11 12 13 14 15
Sig3 (psi) 3.02 3.03 3.03 4.99 5.01 5.01 10.04 10.04 10.04 15.03 15.04 15.04 20.05 20.05 20.05
100000
10000
1000 1
10
100
1000
Bulk Stress (psi)
Figure 11B: BF O-G2 Mr Data, Eq. 1 Regression Results, & Eq. 2 Plot
36
Sequence
SigD (psi) 3.1 6.07 9.11 5.23 10.21 15.11 10.29 20.33 30.44 10.47 15.38 30.59 15.54 20.67 41.15
Theta (psi) 12.22 15.13 18.05 20.32 25.24 30.2 40.44 50.45 60.56 55.59 60.5 75.71 75.69 80.82 101.3
Mr 1 (psi) 39632 39252 42104 50911 54141 56064 75100 77766 78051 84354 87096 91685 98131 102887 100295
Mr 2 (psi) 42405 39298 42137 50918 52849 56039 70007 77785 78075 84398 87074 91695 98087 100449 106599
Mr 3 (psi) 39519 39311 41230 48641 54179 56028 74985 77753 77990 81170 87085 91656 95080 100254 101466
Mr 4 (psi) 39617 39294 40418 48602 54252 56003 77831 77763 78113 81095 87044 91711 95059 102790 106602
Mr 5 (psi) 39662 39286 41191 50909 54083 56081 72306 76338 78086 81000 87096 91731 98061 102848 101628
Generalized NCHRP 1-28A Model (M-E Design Guide) MrN = Mr normalized to atmospheric pressure (14.7 psi) k1 2882.995 (from SigmaStat analysis) k2 0.589 (from SigmaStat analysis) k3 -0.293 (from SigmaStat analysis) Rsq 0.992 (from SigmaStat analysis) Se 152.379 (from SigmaStat analysis) Se/Sy 0.098
Mr AVG (psi) 40167 39288 41416 49996 53901 56043 74046 77481 78063 82403 87079 91696 96884 101846 103318 Sy =
MrN
MrN Pred
2732.449 2672.653 2817.415 3401.088 3666.735 3812.449 5037.143 5270.816 5310.408 5605.646 5923.741 6237.823 6590.748 6928.299 7028.435
2514.89 2783.473 3018.18 3333.735 3648.24 3924.105 4813.033 5145.246 5436.577 5797.744 5898.348 6196.265 6723.473 6778.17 7023.139
1560.585
Resilient Modulus vs. Bulk Stress - BFOG3 1000000 0.5093
y = 10389x 2
R = 0.9757 Resilient Modulus (psi)
1 2 3 4 5 6 7 8 9 10 11 12 13 14 15
Sig3 (psi) 3.04 3.02 2.98 5.03 5.01 5.03 10.05 10.04 10.04 15.04 15.04 15.04 20.05 20.05 20.05
100000
10000
1000 1
10
100
1000
Bulk Stress (psi)
Figure 12B: BF O-G3 Mr Data, Eq. 1 Regression Results, & Eq. 2 Plot
37
Sequence
SigD (psi) 3.16 6.01 9.11 5.22 10.16 15.04 10.33 20.35 30.31 10.45 15.41 30.32 15.68 20.63 40.49
Theta (psi) 12.1 15.04 18.05 20.19 25.19 30.19 40.36 50.41 60.37 55.45 60.44 75.35 75.68 80.66 100.52
Mr 1 (psi) 22982 22180 24275 33259 34410 35909 50093 55305 55127 56891 61544 68507 73657 76331 81002
Mr 2 (psi) 23041 22572 24280 33260 35007 36292 50133 54636 56114 56836 61505 68011 71940 74980 80782
Mr 3 (psi) 22974 22605 24331 32202 34414 36352 51300 54619 55942 56705 61460 68092 71892 74952 82554
Mr 4 (psi) 23024 22589 24279 33219 34444 36337 50093 55300 56018 58446 61526 68801 73581 74990 82497
Mr 5 (psi) 23017 22560 24306 33210 33889 36329 51328 54661 55600 60112 61464 67984 71929 74921 81710
Generalized NCHRP 1-28A Model (M-E Design Guide) MrN = Mr normalized to atmospheric pressure (14.7 psi) k1 1997.677 (from SigmaStat analysis) k2 0.724 (from SigmaStat analysis) k3 -0.340 (from SigmaStat analysis) Rsq 0.988 (from SigmaStat analysis) Se 181.907 (from SigmaStat analysis) Se/Sy 0.134
Mr AVG (psi) 23008 22501 24294 33030 34433 36244 50590 54904 55760 57798 61500 68279 72600 75235 81709 Sy =
MrN
MrN Pred
1565.17 1530.68 1652.653 2246.939 2342.381 2465.578 3441.497 3734.966 3793.197 3931.837 4183.673 4644.83 4938.776 5118.027 5558.435
1679.08 1912.892 2124.376 2384.8 2680.604 2942.316 3765.704 4109.92 4409.957 4734.738 4850.317 5177.309 5696.661 5765.431 6055.229
1360.866
Resilient Modulus vs. Bulk Stress - GascOG1 1000000 0.6525
y = 4162.9x 2
R = 0.9776
Resilient Modulus (psi)
1 2 3 4 5 6 7 8 9 10 11 12 13 14 15
Sig3 (psi) 2.98 3.01 2.98 4.99 5.01 5.05 10.01 10.02 10.02 15 15.01 15.01 20 20.01 20.01
100000
10000
1000 1
10
100
1000
Bulk Stress (psi)
Figure 13B: Gasc O-G1 Mr Data, Eq. 1 Regression Results, & Eq. 2 Plot
38
Sequence
SigD (psi) 3.16 6.05 9.16 5.23 10.17 15.1 10.38 20.26 30.07 10.54 15.29 30.71 15.57 20.56 40.42
Theta (psi) 12.22 15.11 18.19 20.35 25.29 30.19 40.5 50.32 60.13 55.63 60.35 75.8 75.69 80.68 100.54
Mr 1 (psi) 22838 24522 25818 34427 36900 39198 52889 60554 59352 64211 66110 73749 76530 81972 90439
Mr 2 (psi) 23586 24534 25820 34350 37504 39194 55889 59720 60434 64173 66178 74628 76597 80351 87742
Mr 3 (psi) 23349 24609 25766 34416 37646 39229 55878 59726 60281 62222 66105 73653 76493 80338 88488
Mr 4 (psi) 23165 24548 25770 34365 36966 39191 55685 59719 59831 64135 66113 73655 76431 83550 90577
Mr 5 (psi) 23831 24049 26187 34398 36834 38715 55649 60570 59880 62188 66195 74540 76493 81934 90509
Generalized NCHRP 1-28A Model (M-E Design Guide) MrN = Mr normalized to atmospheric pressure (14.7 psi) k1 1782.632 (from SigmaStat analysis) k2 0.724 (from SigmaStat analysis) k3 -0.215 (from SigmaStat analysis) Rsq 0.991 (from SigmaStat analysis) Se 151.850 (from SigmaStat analysis) Se/Sy 0.102
Mr AVG (psi) 23354 24452 25872 34391 37170 39105 55198 60058 59956 63386 66140 74045 76509 81629 89551 Sy =
MrN
MrN Pred
1588.707 1663.401 1760 2339.524 2528.571 2660.204 3754.966 4085.578 4078.639 4311.973 4499.32 5037.075 5204.694 5552.993 6091.905
1527.393 1750.469 1967.865 2181.961 2484.864 2757.223 3490.535 3901.592 4275.103 4388.738 4548.612 5044.225 5352.19 5484.502 5997.912
1492.374
Resilient Modulus vs. Bulk Stress - GascOG2 1000000 0.6729
y = 4141.5x 2 R = 0.9826 Resilient Modulus (psi)
1 2 3 4 5 6 7 8 9 10 11 12 13 14 15
Sig3 (psi) 3.02 3.02 3.01 5.04 5.04 5.03 10.04 10.02 10.02 15.03 15.02 15.03 20.04 20.04 20.04
100000
10000
1000 1
10
100
1000
Bulk Stress (psi)
Figure 14B: Gasc O-G2 Mr Data, Eq. 1 Regression Results, & Eq. 2 Plot
39
Sequence
SigD (psi) 3.17 6.08 9.1 5.28 10.23 15.06 10.27 20.23 30.13 10.46 15.41 30.05 15.64 20.54 40.18
Theta (psi) 12.32 15.02 18.16 20.31 25.23 30.06 40.18 50.26 60.19 55.55 60.53 75.17 75.76 80.63 100.27
Mr 1 (psi) 26858 29259 29654 41470 39189 40573 56573 59654 60047 67818 68339 71232 77129 78876 81790
Mr 2 (psi) 28042 29176 29662 41285 38475 40061 56585 59633 60072 65797 66865 71228 77039 78974 82004
Mr 3 (psi) 26955 28606 29116 39890 38489 40064 56621 59666 60628 65707 68181 70374 77052 80472 76576
Mr 4 (psi) 28077 29233 29653 41316 38509 40057 56610 59623 60576 67852 66721 71172 77076 78903 81038
Mr 5 (psi) 28321 28593 29707 41490 39184 40043 55132 59576 59980 65774 68282 70376 78931 80470 81996
Generalized NCHRP 1-28A Model (M-E Design Guide) MrN = Mr normalized to atmospheric pressure (14.7 psi) k1 2130.596 (from SigmaStat analysis) k2 0.664 (from SigmaStat analysis) k3 -0.403 (from SigmaStat analysis) Rsq 0.990 (from SigmaStat analysis) Se 140.404 (from SigmaStat analysis) Se/Sy 0.108
Mr AVG (psi) 27650 28973 29559 41090 38769 40159 56304 59631 60261 66590 67677 70876 77445 79539 80681 Sy =
MrN
MrN Pred
1880.952 1970.952 2010.816 2795.238 2637.347 2731.905 3830.204 4056.531 4099.388 4529.932 4603.878 4821.497 5268.367 5410.816 5488.503
1822.314 2011.572 2211.264 2479.388 2720.313 2922.962 3703.731 3940.048 4136.88 4584.022 4638.177 4797.233 5372.855 5379.618 5461.105
1300.067
Resilient Modulus vs. Bulk Stress - GascOG3 1000000 0.5602
y = 6556x 2 R = 0.9631 Resilient Modulus (psi)
1 2 3 4 5 6 7 8 9 10 11 12 13 14 15
Sig3 (psi) 3.05 2.98 3.02 5.01 5 5 9.97 10.01 10.02 15.03 15.04 15.04 20.04 20.03 20.03
100000
10000
1000 1
10
100
1000
Bulk Stress (psi)
Figure 15B: Gasc O-G3 Mr Data, Eq. 1 Regression Results, & Eq. 2 Plot
40
Missouri Department of Transportation Organizational Results P. O. Box 270 Jefferson City, MO 65102
573.526.4335 1 888 ASK MODOT
[email protected]