226
IEEE TRANSACTIONS ON NETWORK SERVICE MANAGEMENT, VOL. 6, NO. 4, DECEMBER 2009
Resource Allocation and Disturbance Rejection in Web Servers using SLAs and Virtualized Servers Martin Ansbjerg Kjær, Maria Kihl, and Anders Robertsson
Abstract—Resource management in IT–enterprises gain more and more attention due to high operation costs. For instance, web sites are subject to very changing traffic–loads over the year, over the day, or even over the minute. Online adaption to the changing environment is one way to reduce losses in the operation. Control systems based on feedback provide methods for such adaption, but is in nature slow, since changes in the environment has to propagate through the system before being compensated. Therefore, feed–forward systems can be introduced that has shown to improve the transient performance. However, earlier proposed feed–forward systems have been based on offline estimation. In this article we show that off–line estimations can be problematic in online applications. Therefore, we propose a method where parameters are estimated online, and thus also adapts to the changing environment. We compare our solution to two other control strategies proposed in the literature, which are based on off-line estimation of certain parameters. We evaluate the controllers with both discrete-event simulations and experiments in our testbed. The investigations show the strength of our proposed control system. Index Terms—Web server, resource management, virtualization, response–time control, feed–forward, online estimation, prediction, disturbance rejection.
I. I NTRODUCTION
R
ESOURCE management of computer systems has gained much attention in the last years, since poorly managed resources can degrade the performance of a computer system severely. Control theory offers a range of structures, tools and analysis methods for adjusting systems to the given environment, which might change over time. Therefore, control theory is very useful when designing resource management procedures for computing systems [1]. Several types of resource–management mechanisms have been proposed and evaluated in the literature. In larger computer systems, load balancing is performed in order to distribute the need for resources uniformly over a number of resource units (Computers, CPUs, memory, etc.), thus avoiding that some units are overloaded while others are idle [2], [3]. During overload periods, when more resources are requested than are available, admission control mechanisms reduce the amount of work by blocking some of the requests [4]–[6]. Manuscript received January 8, 2009; revised May 29, 2009 and August 31, 2009. The associate editor coordinating the review of this paper and approving it for publication was S. Singhal (corresponding guest editor). M. A. Kjær and A. Robertsson are with the Department of Automatic Control, Lund University, Box 118, SE-221 00 Lund, Sweden (e-mail: {Martin.A.Kjaer, Anders.Robertsson}@control.lth.se). M. Kihl is with the Department of Electrical and Information Technology, Lund University, Box 118, SE-221 00 Lund, Sweden (e-mail:
[email protected]) Digital Object Identifier 10.1109/TNSM.2009.04.090403
In the last years, the field of power and energy management have become important, since large server systems are used to house the server infrastructure needed to support many Internet services. These server system, also called data centers, have high electricity–costs, and performance–optimization mechanisms may cut these costs, thereby improving both the profit (electricity costs money) and the environmental impact (the use of electricity generally has a negative impact on the environment) [7]. In this case, the resources are usually not the restricting factor, instead control systems can be used to optimize the system so that the resource capacity can be reduced, thereby saving energy. The objective of these resource optimization mechanisms is to minimize the resources while keeping the service level objectives, for example, the average response–times below a threshold. Dynamic voltage scaling (DVS) is one example of resource optimization. Here, the CPU–resources are minimized in order to reduce the power consumption [8], [9]. For Internet applications, virtualized server systems can be used to divide physical resources into a number of separated platforms where different web applications are allowed to operate without affecting one another. Dynamic resource allocation between the virtualized platforms serves as a new and easier way to perform resource optimization on web server systems [10], [11]. Usually, the proposed mechanisms are evaluated while assuming that each server and application operate independently of other servers and applications, however, there are some very recent work on distributed optimization schemes [12], [13]. When designing resource optimization schemes, tools from control theory are widely used. Feedback control can be applied, where response times of departed requests are compared to a reference set by the operator, and some parameters (admission probability, dedicated CPU–resources, CPU–voltage, or othear) are changed over time until the average response time matches the reference. Also, feed–forward methods can compensate for the stochastic variations (disturbances). However, feed–forward methods require exact knowledge of how the disturbance affects the response time in order to compensate for the change. A combination of feed–forward and feedback often form a strong pair, where the feed–forward part reacts fast to the (measurable) changes, and the feedback part handles whatever small faulty compensation the feed–forward might do [5], [11], [14], [15]. In the specific case where the CPU resources are used as actuation method (dynamic voltage scaling, virtualized schemes, or others), the feed–forward is often based on some queuing model of the web server system. However, in order to be accurate, a queuing model assumes knowledge
c 2009 IEEE 1536-1276/07$20.00 ⃝ Authorized licensed use limited to: IEEE Xplore. Downloaded on March 15,2010 at 05:38:33 EDT from IEEE Xplore. Restrictions apply.
KJAER et al.: RESOURCE ALLOCATION AND DISTURBANCE REJECTION IN WEB SERVERS USING SLAS AND VIRTUALIZED SERVERS
Tier 1
Tier N
Requests
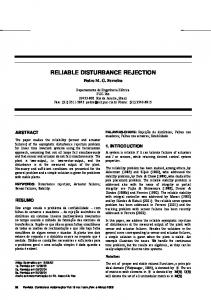
Fig. 1.
A virtualized server environment hosting web applications.
of both the arrival rate and the processing time needed to complete a request. The arrival rate is usually easily measured online, however the processing time may be harder to measure accurately. Usually, only an average value is needed, but even obtaining this is not trivial. In many cases, see e.g. [5], [14], [15], the average processing–time for a request is estimated off–line by sending requests at a very low rate. The estimate obtained by this method is then applied in the feed–forward, by assuming that it is still adequate even when the system is online. However, our investigations show that this is not always a sound method, since the processing times can change under operation due to changes in the work load (it is actually a second disturbance in the control terminology). This means that if the model depends on off–line estimates of the processing time, the performance of the control system can be degraded. In this article, we propose a control method for optimizing the CPU usage in a virtualized server environment. The method combines feedback control of the response times with feed–forward control of the disturbances. However, our method is not requiring an off-line estimation of the processing times. Instead, the processing time estimate is adjusted online in order to match the estimated response time to the measured response time. We show both by simulation and by experiments that our method outperforms similar proposed resource optimization strategies suggested in the literature. The work is based on previously presented material, which was validated by simulations only [16], [17]. The work in this paper is also validated experimentally. The remaining of the paper is organized as follows: Section II describes the system under consideration. A control– theoretic approach to modeling is taken in Section IV, and an estimation scheme is developed. Also in Section IV, a control– method based on the estimation scheme is presented along with two controllers from the literature, used for comparison. Verifications of our proposed controller by simulations are presented in Section V. The set–up of a test–laboratory is described in Section VI, and experimental results are presented in Section VII. Finally, discussions and conclusions are presented in sections VIII and IX. II. S YSTEM D ESCRIPTION The target system in this article is a general distributed computer–system hosting various web applications, see Fig. 1.
227
Two examples of such systems are web hotels hosting several web–sites, and enterprise data–centers containing business critical applications. The system has 𝑁 tiers, and on each physical server there are virtual containers hosting the applications. Similar systems have been investigated in for example [8], [9], [12], [18]. In this article, we assume that the bottleneck is a CPU intensive tier, which, for example, processes dynamic application scripts. Therefore, our analysis is focused on only this tier. New requests will arrive according to some stochastic process that may change over time. Each request can be treated independently of other requests. The physical resource of the computer system, in our case the CPU capacity, is shared among the applications using a virtualized server environment. The processing time of the request, 𝑤, is a representation of the amount of work a request needs from the CPU in order to be processed. The processing time is defined entirely by the nature of the request, and it is not affectable by the control module. In this article, the processing time is measured in seconds. The processing time could also be measured in clock cycles; see for example [8]. Each application has a Service-level agreement (SLA), defining the QoS that the application is guaranteed from the computer system. Clients send requests to be processed by the application. Each request requires some resource capacity (in our case CPU capacity) from the physical system. In order to fulfill the SLA, each application is guaranteed a certain share of the total CPU capacity. Since the traffic situation may change over time, the CPU allocation mechanism should be dynamic using some optimization criteria. In this article we have two general assumptions about the system, which also have been used in other papers, for example [8], [11], [12]. The first assumption is that there is a load balancing mechanism, which distributes the workload among the physical servers. Therefore, all servers behave equal and independent of each other, which means that the CPU allocation mechanism can operate on only one server. The second assumption is that the total CPU capacity is large enough to respect the demand of each of the applications. With this assumption resource allocation and management will be the focus rather than overload control. Also, with this assumption the resource allocation of each application can be controlled independent of other applications using the virtualized server environment. Therefore, with these two assumptions only one server and application are used in the analysis in the remaining of this paper. An application will have a reserved share 𝑝𝑟 (0 < 𝑝𝑟 < 1) of the total CPU capacity. Non–allocated CPU capacity, 1−𝑝𝑟 , is considered as profit–generating, since the spare CPU capacity can be used for other purposes, such as secondary tasks (not further specified) or to save electric power by DVS. Therefore, our work has the same control objective as several other papers [11], [14], [15], that is to minimize the amount of CPU capacity that is given to each application in order to save running costs, at the same time as the SLAs for all applications are fulfilled. In our work, the SLAs contain the average response time for each request, meaning that an application should have a sufficient share of the CPU capacity so that its clients
Authorized licensed use limited to: IEEE Xplore. Downloaded on March 15,2010 at 05:38:33 EDT from IEEE Xplore. Restrictions apply.
228
IEEE TRANSACTIONS ON NETWORK SERVICE MANAGEMENT, VOL. 6, NO. 4, DECEMBER 2009
experience an acceptable response time from the system. In a more sophisticated SLA one could include a cost for the system operator if the variance of the response times is too high. However, since our focus is on the technical aspects of the system rather than the business aspects, we will not be investigate or discuss the SLA design any further.
tions: 𝐽𝑇 (𝑀 ) =
𝑀 1 ∑ 1 ∑ (𝑇𝑟𝑒𝑓 − 𝑇𝑘,𝑖 )2 𝑀 𝑖=1 𝑡𝑡
(1)
𝑀 1 ∑ 1 ∑ (𝑞𝑘,𝑖 )2 𝑀 𝑖=1 𝑡𝑡
(2)
𝑘∈𝑡𝑡
𝐽𝑞 (𝑀 ) =
𝑘∈𝑡𝑡
III. M ETRICS FOR Q UALITY In this article, three metrics are chosen to show the quantitative behavior of the system. None of them are able to describe the total quality of the system, so an acceptable performance of the system yields a trade–off between several metrics. The average response time, 𝑇 , is a prime metric for the end user, and thus also for the application–operator. For the user this metric should preferably be as small as possibly, but for the computer–system operator it should be balanced with the cost of running the computer–system. This balance is defined in the SLA, which is translated into control terminology as the response–time reference 𝑇𝑟𝑒𝑓 . 𝑇 can be regarded as the response time of a single request or as an average over a sample interval. The variation cost of the response time, 𝑉𝑇 , is a metric for how individual clients are affected by the computer–system. If 𝑉𝑇 is large, some clients will experience large response times, which is undesirable. Therefore, a low 𝑉𝑇 is preferable, even though it is not stated as a specific SLA. 𝑉𝑇 is defined for a stationary sequence by 𝑁 1 ∑ ¯ (𝑇 − 𝑇𝑘 )2 𝑉𝑇 = 𝑁 𝑘=1
,
𝑁 1 ∑ ¯ 𝑇 = 𝑇𝑘 𝑁 𝑘=1
where 𝑁 is sufficiently large, and 𝑇𝑘 is the newest response– time corresponding to the discrete–time index 𝑘. 𝑉𝑇 is only used for long steady–state scenarios, where the system can be considered as stationary. The Loss of capacity, 𝑞, is the difference between the reserved share of CPU capacity, 𝑝𝑟 , and the share of CPU capacity actually used by the application, denoted 𝑝𝑎 . Since the system is sampled, 𝑝𝑟 is constant during each sample. This metric is relevant for the computer–system operator, since it represents an operational cost which does not generate any income. It is of high interest to keep this metric to a minimum. For steady state cases, these three metrics are evaluated as time–averages over sufficiently long, possibly down–sampled, sequences, ensuring that the 95%–confidence interval for the response time does not exceed 10% of the mean value, and the size of the 95%–confidence interval for 𝑞 does not exceed 0.01 (i.e, 1% of the CPU capacity). The confidence intervals are measures of the accuracy of the average values, compared to the real expected values according to standard statistical methods; see e.g. [19]. In the transient investigations, accurate results cannot be obtained by long sequences. Here, several experiments are averaged over the transient period to remove statistic fluctua-
which are averages over 𝑀 experiments over the transient period 𝑡𝑡 . The variables 𝑇𝑘,𝑖 and 𝑞𝑘,𝑖 represent the average response–time and the average loss of capacity for the 𝑘 𝑡ℎ sample incident and the 𝑖𝑡ℎ experiment. IV. C ONTROL M ODULE The objective of the control module is to fulfill the SLA of the application, that is to keep the average response–time below a reference value, 𝑇𝑟𝑒𝑓 , at the same time as the reserved share of CPU capacity for the application, 𝑝𝑟 , is minimized. In steady–state, this can be obtained by feedback–mechanisms including integral effects (such as integral controllers and step controllers), which are tuned conservatively to avoid oscillations. However, when changes in the workload occurs, this solution is far too slow and a more advanced adjustment of the control signal is necessary. Therefore, it is an objective to remove effects of load–changes as fast as possible. From a control–theoretic perspective, the system has one control–input, the reserved CPU share (𝑝𝑟 ), and two disturbance–inputs, the arrival times of requests (denoted 𝑎) and the processing times (𝑤). The control objective is to alter 𝑝𝑟 in order to maintain the output, i.e the response time (𝑇 ) close to the reference value 𝑇𝑟𝑒𝑓 , despite the behavior of the two disturbances. The interaction between the control module and the server system is illustrated in Fig. 2. We assume that the arrival times of requests, 𝑎, the number of requests in the server, 𝑁 , and the response times, 𝑇 , are available for measurements. Also, we assume that the reserved CPU share, 𝑝𝑟 , can be set online at certain time intervals. The controller will have a larger potential to handle changes in the arrival rate than in the processing time distribution since the controller has direct access to the behavior of the arrivals through measurements. Changes in the processing time distribution are much harder to detect since they are seldom directly measurable, and often the changes will have to propagate to the response times before being recognized. The control module can be triggered both periodically and by departure instances where a departure occurs when a request is completed and a response is sent back to the client. A. Prediction model The control module is based on a prediction approach similar to the one derived by Henriksson et al. [15] as illustrated in Fig. 3. The server is modeled as a single–server system where requests are placed in an infinite queue and then processed in a First-In-First-Out fashion. We model the time to process a job as being inversely proportional to the reserved share of the CPU 𝑝𝑟 . This means that the CPU is the most dominant factor limiting the system, which is a main assumption of this paper stated in Section II.
Authorized licensed use limited to: IEEE Xplore. Downloaded on March 15,2010 at 05:38:33 EDT from IEEE Xplore. Restrictions apply.
KJAER et al.: RESOURCE ALLOCATION AND DISTURBANCE REJECTION IN WEB SERVERS USING SLAS AND VIRTUALIZED SERVERS
Arrivals
Departures Server system
a
p
N
T
Control module
Fig. 2.
An illustration of the control system
Accumulated jobs
Known
Predicted
𝑤/𝑝 ˆ
𝑁 Time 𝑡𝑛𝑜𝑤 Processing time
Queuing time Fig. 3.
Accumulated jobs in a single server queue.
Consider the case where a request leaves the server at time 𝑡𝑛𝑜𝑤 , leaving 𝑁 remaining requests, as in Fig. 3. The area to the left of 𝑡𝑛𝑜𝑤 represents the time that the present requests have spent in the server, which is known due to measurements. The area to the right of 𝑡𝑛𝑜𝑤 represents the unknown future, which can only be predicted. By assuming that all requests will have the same processing time, 𝑤, ˆ and that 𝑝𝑟 remains constant, a prediction of the average response time 𝑇ˆ is given by ∑ 𝑇ˆ = 1/𝑁 (𝑡𝑛𝑜𝑤 − 𝑎𝑖 ) + 𝑤(𝑁 ˆ + 1)/2𝑝𝑟 (3) 𝑖
where 𝑎𝑖 is the arrival time of request 𝑖. The first term on the right hand side of the equality sign represents the known area of the figure, and the second term represents the prediction. The arrival times and the processing times are treated as disturbances, which only means that they are quantities not affectable by the operator or by the computer system itself. Of the disturbances, only the arrival times are measurable. B. Proposed estimation scheme The prediction model described in Section IV-A can be useful for online adjustment of the CPU allocation parameter, 𝑝𝑟 , but it relies on several measurements. The number of jobs in the server 𝑁 and their arrival times 𝑎𝑖 are quantities often registered by a real server. However, to accurately estimate the average processing time, 𝑤 ˆ is not always trivial. In a single server with a queue 𝑤 ˆ could be estimated by measuring former service times, corrected with the current value of 𝑝𝑟 . However, more complex systems with for example several protocol layers or for processor sharing systems, this approach is not feasible as the time to process a request depends on other factors in the system like the current number of requests in the system. Therefore, to let the control strategy rely on measurements of the processing times, will reduce the applicability of the estimation. Therefore, we propose another strategy.
229
In classic linear estimation–problems models are used to estimate non–measured quantities; see for example [20]. Often, the measurable variables are compared to the estimated values, and a feedback mechanism tries to minimize the estimation error. In the following, we therefore, consider the response times, 𝑇 , as a measurable output and the processing times, 𝑤, as a state to be estimated. In earlier work [16], [17] we proposed a redesign of the response–time prediction presented by Henriksson et al. [15], resembling the structure of a classical observer. In the redesign, we proposed to use a PI controller to update the estimate of 𝑤. ˆ To stress that the estimator does not rely on measurements of 𝑤, we impose an artificial variable, 𝑧, to act as the input to the model. Our proposed estimator is then given by (𝑁 + 1) 1 ∑ (𝑡𝑛𝑜𝑤 − 𝑎𝑖 ) + 𝑧 (4) 𝑇ˆ = 𝑁 𝑖 2𝑝𝑟 𝐼𝑘
=
𝑣𝑘
=
𝑧
=
ℎ𝑘 𝐾 𝑝 ℎ𝑘 (𝑇𝑘 − 𝑇ˆ𝑘 ) + (𝑣𝑘−1 − 𝑧𝑘−1 ) (5) 𝐾𝑖 𝐾𝑎 𝐾𝑝 (𝑇𝑘 − 𝑇ˆ𝑘 ) + 𝐼𝑘 (6) { 𝑣 𝑓 𝑜𝑟 𝑣 > 0 (7) 0 𝑒𝑙𝑠𝑒 𝐼𝑘−1 +
where 𝐾𝑖 and 𝐾𝑝 are controller parameters, and 𝐼 is the integrated estimation–error. The parameters 𝐾𝑖 and 𝐾𝑝 are chosen by engineering experience to balance the game of fast convergence against the robustness towards instability. The variable 𝑣 serves as an unlimited control signal, whereas 𝑧 is restricted to positive values. The estimation scheme is illustrated in Fig. 4. The variable ℎ𝑘 is the time between the previous and the current sampling. Using a varying sampling period in the integrator has earlier been shown to be superior to fixed sample–periods for some event based systems [21]. Integrator anti–windup is included as the last term in (5), where 𝑧(𝑘) is the achieved control signal (𝑧 is not allowed to be negative). The parameter 𝐾𝑎 determines the convergence rate of the anti wind–up; see [20]. The intuition behind the prediction scheme is as follows. For a given value of 𝑧, a prediction of the response time is calculated based on measurements as in (4). If the model is not accurate, the predicted response–time 𝑇ˆ will deviate from the measured response–time 𝑇 . Since measurements of the former response–times are available, the control module is aware of the accuracy of previous predicted response–times, which can be used to alter the parameters of the estimator. The PI– controller is known to remove steady–state errors efficiently [22], [23], which is primarily what is needed here since wrong queuing model assumptions often result in biased predictions. The integral part of the PI–controller (represented by 𝐼 in (5) and (6)) will gradually adjust the value of 𝑧 until an inaccurate estimated response–time matches the measured response–time. The value of 𝑧 has an interpretation as the processing times, which cannot be negative. The anti–windup (the last term of (5)) ensures stability of the integral part in the PI–controller when this restriction is imposed to 𝑧 in (7). The initial choice of 𝐼 is not essential as long as it resembles realistic values of 𝑤. ˆ A sound choice is to initiate 𝐼 to zero, and let the predictor converge before the prediction signal is used (PI control is
Authorized licensed use limited to: IEEE Xplore. Downloaded on March 15,2010 at 05:38:33 EDT from IEEE Xplore. Restrictions apply.
230
IEEE TRANSACTIONS ON NETWORK SERVICE MANAGEMENT, VOL. 6, NO. 4, DECEMBER 2009
𝑎
𝑤
𝑎
𝑁
𝑝𝑟
Web Server
controller 𝑝𝑓 𝑓
𝑇
𝑁
PI
𝑧
Prediction error
PI
𝑤
Feed–forward
𝑝𝑟
controller
𝑇𝑟𝑒𝑓
Web Server 𝑇
controller
Fig. 6.
𝑇ˆ
Prediction
Block diagram of a combined feedback, feed–forward setup.
error 𝑁, 𝑎
Dynamic predictor
Fig. 4. Block diagram of predictor. The predictor can be interpreted as an observer with state 𝑧.
D. Controllers for Comparison
𝑇ˆ P controller
PI 𝑇𝑟𝑒𝑓
Fig. 5.
controller
Dynamic predictor 𝑎
𝑝𝑝
𝑝𝑟
𝑤
Web Server
𝑇
Block diagram of the our proposed PFB controller.
used alone in the start–up phase). Equations (5) and (6) form a general PI controller where the term 𝑧𝑘−1 is exchanged with the relevant control signal. C. Proposed Predictive Feedback Controller (PFB) The server suffers from a significant time delay; a change in 𝑝𝑟 will only propagate to measurements of the response time (𝑇 ) after a certain time. In classic control theory, the performance of systems with delays can be improved by prediction techniques, such as the Smith predictor; see [23]. Therefore, we propose to use the predicted response time as a proportional feedback–signal 𝑝𝑝
= −𝐾𝑝𝑓 𝑏 (𝑇𝑟𝑒𝑓 − 𝑇ˆ ) .
therefore, filtering might be required. This issue will be discussed for the individual implementations since filtering depends highly on the specific measurements and memory considerations.
(8)
to respond to errors, which are not yet seen in the response time signal. The prediction signal 𝑝𝑝 enters directly on the control input 𝑝𝑟 as illustrated in Fig. 5, and the parameter 𝐾𝑝𝑓 𝑏 is used to scale the influence of the prediction. In order to handle model errors, a periodic PI–controller from the actual response time is included. The controller is in the following sections called the Predictive Feedback Controller (PFB). It is an assumption that the reserved share of CPU capacity, 𝑝𝑟 , only can be changed at some fixed time period, 𝑇𝑠 . However, the estimation is not restricted by the sampling period. The estimation is updated for each departure ensuring that the response time estimate, 𝑇ˆ , and the state, 𝑧, always incorporate the newest measurements. The involved signals can be quite irregular, which can lead to irregular estimation and poor control performance.
We will in this article compare our prediction–based controller with solutions proposed in [5], [14], [15], where feed–forward and feedback are combined as illustrated in Fig. 6. Like our proposed prediction–based controller, the feed-forward uses measurements of the disturbances to change the control signal, 𝑝𝑟 , before a change in the disturbance is seen in the response time, and a PI controller to remove the remaining stationary errors. In order to evaluate our proposed controller against other feed–forward strategies, the all are used together with the same periodic PI–controller as described above. The controllers for comparison both assume that an estimate of the average processing time is available. An often used procedure to obtain this estimate is to measure the response times at avery low arrival rate, so–called off-line estimation. Assuming that only one request is present, the response times can be used to estimate the processing times. This estimate is then used online at higher arrival rates assuming that the average processing time will remain unchanged. Obviously, this method is not robust towards changes in the workload. Alternatively, response times can be observed at dedicated higher–load experiments. and an estimate of the average processing time can be found by assuming some particular queuing–model, as e.g. an M/M/1 model. This kind of approach can also lead to inaccurate estimates since the assumed model seldomly reflects the reality. The first controller for comparison, denoted Inverse Prediction Feed–Forward (IPPFF), is a slightly modified version of the feed–forward presented in [15]. The feed–forward signal 𝑝𝑓 𝑓 , which enters the control signal according to Fig. 6, is found by rearranging (3) such that 𝑝𝑓 𝑓 is the control signal required in order to obtain the desired response time 𝑇𝑟𝑒𝑓 (that is, 𝑇ˆ is exchanged with the desired value 𝑇𝑟𝑒𝑓 ). Thereby, the feed-forward is given by 𝑝𝑓 𝑓
=
2(𝑇𝑟𝑒𝑓
𝑁 +1 ∑ 𝑤 ˆ. − 𝑖 (𝑡𝑛𝑜𝑤 − 𝑎𝑖 )) 1 𝑁
(9)
In [15], the numerator yields 𝑁 and not 𝑁 + 1. The second controller for comparison, denoted Queuing– Theoretic Feed–Forward (QFF) has a feed–forward that is based on the simplest queuing model, the M/M/1 system, where requests arrive according to a Poisson process and
Authorized licensed use limited to: IEEE Xplore. Downloaded on March 15,2010 at 05:38:33 EDT from IEEE Xplore. Restrictions apply.
KJAER et al.: RESOURCE ALLOCATION AND DISTURBANCE REJECTION IN WEB SERVERS USING SLAS AND VIRTUALIZED SERVERS
the processing times have an exponential distribution. Similar controllers have been proposed in, for example, [5], [14]. The average response time of an M/M/1 system is given by ([24], [25]) 𝑇
=
𝑥 ¯/(1 − 𝜆 𝑥¯) .
(10)
where 𝜆 is the average arrival rate and 𝑥 ¯ is the average processing time. In our case, 𝑥¯ = 𝑤/𝑝 ¯ 𝑟 if 𝑝𝑟 is constant. Assuming that 𝑤 ¯ is known (and exact) and 𝜆 is estimated by ˆ a feed–forward signal can some windowing mechanism (𝜆), be formed as 𝑝𝑓 𝑓
=
ˆ 𝑇𝑟𝑒𝑓 )/𝑇𝑟𝑒𝑓 𝑤 ¯ (1 + 𝜆
(11)
which enters the control signal as illustrated in Fig. 6.
for the periodic controller was chosen as 𝐾𝑝 = 1.4 ⋅ 10−5 , 𝐾𝑖 = 0.0101, 𝐾𝑎 = 1010.1. The proportional gain of the PFB controller was chosen as 𝐾𝑝𝑓 𝑏 = 0.2. The parameters have been found by running simulation–tests and adjusting the parameters by hand. The involved signals can be quite irregular, which can lead to irregular estimation and poor control performance. All the tested periodic PI–controllers use the comparison of the 𝑝 reference and a filtered response time 𝑇 𝑝 ; 𝑇𝑘𝑝 = (𝑇𝑘−1 +𝑇𝑘𝑠 )/2 where 𝑇𝑘𝑠 is the average response time of the jobs that departed under the interval between sampling 𝑘 − 1 and 𝑘. To update the estimator, the estimated response–time is compared to a first order auto–regressive filtered measured response–time with filter constant 𝛼 = 0.001. The auto– regressive filter is implemented as
V. S IMULATIONS The proposed PFB controller is mainly designed to improve the transient performance at workload changes. However, it is also expected to handle the short–term stochastic variations observed in the steady–state situations similar to the others controllers. To evaluate these scenarios, we performed simulations of a generalized server system with CPU resource allocation. The simulation program was written in Java and used an event-based simulation kernel. Steady state and transient simulations were performed. All steady–state results were evaluated after all transients had been removed. Transient behavior was investigated after convergence to steady state, and the simulations were allowed to run for a sufficiently long time for the transient to settle. A. Simulation model The server system was modeled as a single server queue with processor–sharing. New requests arrived with an average arrival rate of 𝜆 requests per second. The requests had a reserved share of 𝑝𝑟 of the CPU capacity. The average processing time was 𝑤 seconds. Since the server used processor– sharing, 𝑤 represents the service time if the request is the only request processed in the system. When several requests are processed at the same time, the CPU capacity is divided equally among the requests. Both the inter-arrival times and the processing times were modeled as second order hyper-exponential distributions (𝐻2 distribution), in order to model a bursty system. An 𝐻2 – distributed variable 𝑥 is with probability 𝛽 a realization of an exponentially distributed variable with expected value 𝑣1 , and with probability (1 − 𝛽) a realization of exponentially distributed variable with expected value 𝑣2 . We used the parameters: 𝛽 𝑣1
= =
(𝐶 2 − 1)/(𝐶 2 + 161) 0.1 𝑥 ¯ , 𝑣2 = 𝑥¯(1 − 𝛽)/(1 − 10𝛽),
(12) (13)
where 𝐶 2 and 𝑥 ¯ were the squared variance coefficient and average value of the 𝐻2 –distributed sequence, respectively. The value of 𝐶 2 was chosen to be equal for the inter–arrival times and the processing–time distributions and 𝐶 2 = 5 unless stated differently. The control parameters for the predictor was chosen as 𝐾𝑖 = 0.0005, 𝐾𝑝 = 0.000001, 𝐾𝑎 = 0.5. The parameters
231
𝑓 𝑇𝑖𝑓 = (1 − 𝛼) 𝑇𝑖−1 + 𝛼 𝑇𝑖 ,
(14)
where 𝑖 indicates the departing job number and 𝑇𝑖 is the response time of job 𝑖. The response time estimate can also be quite irregular. An obvious idea is to apply a filter directly to the estimate 𝑇ˆ. This has an undesirable effect due to the nonlinear structure. Linear filtering of the term 1/𝑝 would weight small values of 𝑝 and could∑ lead to wrong estimates. Also, a linear filtering of the term 𝑖 (𝑡𝑛𝑜𝑤 − 𝑎𝑖 ) would weight the jobs that have a long service time over those having a short response time, thus increasing the average estimate. The filtering must therefore be placed with care. The best results have been obtained by 𝑓 + 0.001 𝑁𝑖 , which is an simply filtering 𝑁 ; 𝑁𝑖𝑓 = 0.999 𝑁𝑖−1 event–based filter. The IPFF controller is based on inverse prediction. That is, any response time error is compensated in one update. A similar idea is used in classical minimum–variance control, which is known to have poor robustness properties; see [26]. In our case, the result is an undesirable irregular control signal and some filtering is imposed. Applying a filter to the control signal would drive the average control signal off due to the nonlinearity of the fraction in (9). Therefore, the numerator and denominator are filtered separately; 𝑃𝑖
=
𝑄𝑖
=
𝑝𝑖𝑝𝑓 𝑓
=
0.999 𝑃𝑖−1 + 0.001 (𝑁 + 1) 𝑤 ¯ 1 ∑ 0.99 𝑄𝑖−1 + 0.01 (𝑡𝑛𝑜𝑤 − 𝑎𝑖 ) 𝑁 𝑖 𝑃𝑖 /2(𝑇𝑟𝑒𝑓 − 𝑄𝑖 )
(15) (16) (17)
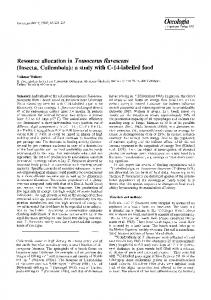
B. Steady–State Simulations The traffic load is often described by two quantities; the average arrival rate (𝜆) and the nominal service rate (1/𝑤). ¯ Often, the traffic is quantified by the offered load, 𝜌 = 𝜆𝑤. ¯ Assuming a single server system, a low value of 𝜌 means a lightly loaded system, whereas values close to one means a heavily loaded system. If 𝜌 exceeds one, the system lacks resources to serve incoming requests, which means that the system is overloaded. 1) Performance when varying offered load: Fig. 7 illustrates the performance metrics when the arrival rate was varied in a range corresponding to 𝜌 = 0.05 − 0.90. In these simulations, the off-line estimate of the average processing
Authorized licensed use limited to: IEEE Xplore. Downloaded on March 15,2010 at 05:38:33 EDT from IEEE Xplore. Restrictions apply.
232
IEEE TRANSACTIONS ON NETWORK SERVICE MANAGEMENT, VOL. 6, NO. 4, DECEMBER 2009
1
0.8
0
10
20
30
40
50
60
70
80
90
100
Variation Cost
8 6 4 2 0
0
10
20
30
40
50
60
70
80
90
100
1.1 1 0.9 0.8
Variation Cost 𝑉𝑇 (ms2 )
Response time (s)
Response Time
0.9
Variation Cost 𝑉𝑇 (ms2 )
Response time (s)
Response Time
1.1
Loss (%CPU)
Loss (%CPU)
PFB IPFF QFF
10 5
10
20
30
40 50 60 Arrival rate 𝜆 (req/s))
0.004
0.006
0.008
0.01
0.012
0.014
0.01
0.012
0.014
Variation Cost
6 4 2
0
0.002
0.004
0.006
0.008
3
15
0
0.002
Loss of CPU
Loss of CPU
0
0
8
70
80
90
100
PFB IPFF QFF
2 1 0
0
0.002
0.004
0.006 0.008 processing time 𝑤 ¯ (s))
0.01
0.012
0.014
Fig. 7. Averaged steady state simulations for different arrival rates 𝜆. 𝐶 2 = 5, 𝑤 ¯ = 0.01 𝑠, 𝑤 ˆ = 0.01 𝑠, 𝑇𝑠 = 1 𝑠, 𝑇𝑟𝑒𝑓 = 1.
Fig. 8. Averaged steady–state simulations for different average processing times 𝑤. ¯ 𝐶 2 = 5, 𝜆 = 70 𝑟𝑒𝑞/𝑠, 𝑤 ˆ = 0.01 𝑠, 𝑇𝑠 = 1 𝑠, 𝑇𝑟𝑒𝑓 = 1 𝑠.
time 𝑤, ˆ used in the IPFF and QFF controllers, corresponded exactly to the actual average processing time 𝑤. ¯ The graph indicates that all the controllers managed to keep the average response time near the reference. However, small off–sets were observed. All controllers performed best when the offered load was high as the loss of computational resources 𝑞 was small. Our proposed PFB–controller estimated the average processing time online, but showed no significant degradation in performance. The QFF controller showed a higher variation– cost 𝑉𝑇 , which indicates a less smooth response–time than the other controllers. 2) Robustness to changes in the processing time: On a real server system, e.g. used for web applications, it is unrealistic that the average processing time 𝑤 will be constant during longer periods since the workload is likely to be changed. Therefore, a control system must be robust to changes in the average processing time. Fig. 8 shows the performance metrics when the average processing time was varied in a range corresponding to 𝜌 = 0.14 − 0.875 (which means that the off-line estimate of the processing time 𝑤 ˆ was inaccurate). The results show that all the controllers managed to keep the average response time near the reference. However, small off– sets were observed. Also here, the QFF controller performed rather poorly over the full range since it yields both a higher loss of computational resources and also a large variation– cost 𝑉𝑇 . Despite the inaccuracy of the off-line estimate of the processing time, the IPFF controller performed well in steady state because of the robustness of the PI controller. More steady–state simulation results are presented in [17]. As the arrival rate becomes small, the number of measurements available to perform a prediction decreases (the predictions are performed with fixed time–periods). The variance of the prediction increases and thereby generating a more noisy control signal, leading to higher loss of computational resources. How pronounced this problem is depends on the given estimation scheme. This is observed in both Fig. 7 and 8.
Therefore, it is of high importance to also investigate the transient behavior of the controlled system. Fig. 10 illustrates how the two main metrics, the response time and the loss of CPU bandwidth, behave under transients. Using cost–functions averaged over several simulations, improves the accuracy of the results (smaller confidence– intervals). Preferably, both cost–functions should be close to zero to yield good performance. The two cost–functions are not necessarily contradictory since the average response time can be held constant, if the CPU bandwidth is allocated just sufficiently and in time and thus minimizing the loss of CPU capacity. However, the controllers might solve this problem differently, which can be observed in the figure. The top graph of Fig. 10 illustrates a situation where the average processing time 𝑤 ¯ was suddenly doubled. In the beginning of the simulation, the offered load was relatively low with 𝜌 = 0.4 (𝜆 = 50 𝑟𝑒𝑞/𝑠, 𝑤 ¯ = 0.008 𝑠). At time 𝑡 = 1000 the average processing time was doubled (𝑤 ¯ = 0.016 𝑠), such that the system was exposed to high–load traffic with 𝜌 = 0.8. The off-line estimated processing time was chosen to be 𝑤 ˆ = 0.01 to illustrate a slightly inaccurate estimate within the tested range. It can be observed that the proposed PFB–controller is superior to the other controllers in the case of changes in the processing time 𝑤 ¯ as it yields a smaller cost in the response–time error and a smaller cost in the loss of CPU bandwidth. This behavior is expected as the PFB– controller estimates the value of 𝑤 ¯ online, while the two other controllers use off–line estimates. The middle graph of Fig. 10 illustrates that the proposed PFB–controller handles a change in the arrival rate better than the IPFF controller. The QFF controller handles the transient with slightly smaller response–time errors, but with substantially larger loss of CPU bandwidth. This behavior can be explained by the behavior also seen in Fig. 9, which shows a clear over–allocation of CPU resources for the QFF–controller. Initially, the system was here exposed to a low–load traffic with 𝜌 = 0.35 (𝜆 = 50 𝑟𝑒𝑞/𝑠, 𝑤 ¯ = 0.007 𝑠). Again, the offline estimated processing–time was chosen to be 𝑤 ˆ = 0.01 to illustrate an inaccurate estimate. At time 𝑡 = 1000 𝑠 the arrival rate was doubled, so that the system was exposed to high–load traffic, 𝜌 = 0.7. Fig. 9 also shows that the proposed PFB–
C. Transient Simulations One strong argument to use feedback in the control is the robustness towards rapid changes in the environment.
Authorized licensed use limited to: IEEE Xplore. Downloaded on March 15,2010 at 05:38:33 EDT from IEEE Xplore. Restrictions apply.
KJAER et al.: RESOURCE ALLOCATION AND DISTURBANCE REJECTION IN WEB SERVERS USING SLAS AND VIRTUALIZED SERVERS
233
Response Time
Response time (s)
4
Server
PFB IPFF QFF reference
3
Apache server
2
1
0
0
100
200
300
400
500
CRIS client Java
CRIS client ...
OS (Linux) TCP/IP
Java OS (Linux) TCP/IP
600
Variation Cost
Master
10 Variation Cost 𝑉𝑇 (ms2 )
Idle Load
OS (Linux) TCP/IP −100
Client # 10
Client # 1
Ethernet switch
8
CRIS Master
6
OS (Linux)
2 0
Laboratory network
Java
4
TCP/IP −100
0
100
200
300
400
500
600
Ethernet network
Fig. 9. Time–domain transient simulation–results with changing arrival rate and high traffic burstiness (𝐶 2 =5). Each plot represents an average of 𝑀 = 250 simulation runs. 𝐽𝑞 (%CPU2 /s)
𝐽𝑇 (s) 𝐼95 (𝐽𝑇 ) 𝐼95 (𝐽𝑞 )
PFB IPFF QFF
4
0
2
2
4
6
𝐽𝑞 (%CPU2 /s)
8
𝐽𝑇 (s)
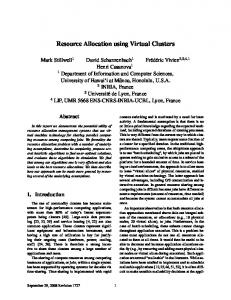
Fig. 11. Linux based testbed with a web server, client computers and network.
large loss of computational resources. In the cases where the arrival rate changed, the QFF feed–forward over–compensated resulting in a large loss of computational resources. However, for all high–burstiness simulations, our proposed PFB controller showed superior transient response.
PFB
VI. T ESTBED
IPFF QFF
1.2
0.8
1
0.6
0.4
0.2
0
0.2
𝐽𝑞 (%CPU2 /s)
0.4
0.6
0.8
𝐽𝑇 (s)
PFB IPFF QFF
0.8
0.6
0.4
0.2
0
0.2
0.4
0.6
0.8
Fig. 10. Cost–function results over transient period of length 𝑇𝑝 (defined in (1) and (2)). Each cost function is an average over 𝑀 simulation runs. Top: Transient simulations case with changing average processing time (𝑀 =150, 𝑇𝑝 =1700 s). Middle: Transient simulations case with changing arrival rate and high traffic burstiness. (𝐶 2 =5, 𝑀 =250, 𝑇𝑝 =300 s). Bottom: Transient simulations case with changing arrival rate and low traffic burstiness. (𝐶 2 =1.1, 𝑀 =150, 𝑇𝑝 =300 s). Generally, the closer a metric is to zero, the better. A controller can show a better performance in one metric but not in the other (e.g. the QFF vs. the other controllers in the middle of the figure), but clear improvements in both metrics can also be seen as in the top of the figure where the PFB controller performs better than the others in both metrics.
In order to evaluate the controllers in a real system, we developed a testbed and performed experiments. The testbed, shown in Fig. 11 consisted of one server computer hosting the application, 10 client computers generating traffic, and one master computer to administrate the experiments. The client computers were connected to the server by an 100 Mb Ethernet switch. The master computer was connected through a local Ethernet network. The server computer was a Pentium 4, 1 GB memory, 3 GHz PC, with a Linux Fedora 8 operating system and modified kernel 2.6.25.4. Also, an Apache server, version 2.2.8, configured by using the prefork module, was installed on the server computer [27]. The client computers were Athlon, 1.5 GHz PC with 2 GB memory, Linux Fedora 9 and kernel 2.6.26.3-29. A. Configuration of the Apache Server
controller handles the change in the arrival rate with a smaller deviation in the response time but with a slower convergence. The results presented in the bottom graph of Fig. 10 had traffic variance coefficients 𝐶 2 =1.1, and shows that in the case of lightly bursty traffic, the IPFF controller handles the transient better than the proposed PFB controller. In this situation, the inverse nature of the IPFF controller becomes very beneficial because the model resembles the reality fairly well. The PFB–controller does not rely on an inverted model, but rather on a feedback mechanism, and does therefore not improve as much from the lightly bursty traffic. A general observation from Fig. 9 and Fig. 10 is that the QFF controller responds poorly to changes. In the case of increasing average processing times the feed–forward did not do any difference since it only considered the arrival rate. Therefore, the periodic PI–controller had to handle the change resulting in a large deviation of both the response time and a
The Apache web–server was chosen mainly because it is one of the most used web servers on the Internet. It has a modular architecture that allows a programmer to add functionality without having to deal with the entire server code. Modules are written and compiled in a structured manner, and they are loaded into the Apache server at start–up. A more detailed description of the Apache architecture and model structure is found in e.g. [28]. 1) Request handling procedure: Functionality can be added to the Apache server by adding hooks into a chain of phases in the request handling procedure. Fig. 12 roughly illustrates how an Apache process’ life progresses. At initialization the Apache runs through a number of initialization phases, where a module can make hooks to add functionality. After initialization, the process enters the request handling circle. The request cycle is run through once for every request the process handles. In Fig. 12 only three phases are indicated,
Authorized licensed use limited to: IEEE Xplore. Downloaded on March 15,2010 at 05:38:33 EDT from IEEE Xplore. Restrictions apply.
234
IEEE TRANSACTIONS ON NETWORK SERVICE MANAGEMENT, VOL. 6, NO. 4, DECEMBER 2009 Ready for new request
Start up
Post config
Post read
Request circle
Handling of the request
Logging
Child exit
Request returned to client
Fig. 12. The Apache module structure. Dashed boxes indicate that the phase is only utilized at the initialization and exit of the process; not necessarily activated for each request. The full–line boxes indicate that the phase is activated for each request. Round corners indicate that the module presented in this paper adds a hook here.
but this phase consists of several entries for the programmer to add hooks. The post config stage is reached when the header of the new request has been read, and is thus the first place in the request circle to add a hook. After the request has been handled, and an answer has been returned to the client, the logging phase is reached. Finally, the request has been fully served, and the process is ready to serve a new request, if the process is not forced to exit. When exiting the request cycle, the process enters the exit phase, where the module can release resources, connections, or whatever the programmer desires. 2) Implemented functionality: The measurements and the prediction algorithm was implemented as three hooks into the Apache request–chain: ∙ post_config This hook enters the chain in a quite early stage of the process life, where initiliation of the process itself takes place. A shared memory area dedicated to the prediction/control–functionality is implemented here to allow communication between the processes. ∙ post_read_request This hook enters the request– chain when the request has been defined, and here all information about incoming requests are updated. Most importantly, the number of active jobs and the accumulated arrival time are updated. ∙ log_transaction In this hook, the variables updated in the post_config phase are updated again. Also, the predictor is implemented here. The location of the prediction algorithm was chosen for two reasons. First, it is at this stage that all parameters are known – the response time is not known until the request has been finished. Second, if the prediction should impose any overhead, it will not add to the response time of the associated request, since an answer has been returned to the client To avoid problems where some parameters are updated when a second process is reading them (and assume them to be static), a locking mechanism is imposed using a semaphore. During a request cycle, the shared memory is locked and unlocked two times; when the parameters are updated in the post_read_request stage, and when the parameters are updated in the post_read_request stage. B. Virtualization Several methods to obtain virtualization are available. Since our work only deals with virtualization of the CPU resources,
we have chosen an method that is provided by the Linux 2.6 kernel. The kernel provides functionality to group different processes and perform scheduler–specific operations on group–basis, and not only on process–basis. The project is called Control Group, and is accessed through a virtual file– system [29]. Virtualization can also be achieved with, for example, the Xen–system that has proved suitable for online adjustment of resources [10], [11]. We implemented Control Group functionality on the server computer in the testbed. We used two features in Control Group; the CPU–allocation subsystem and the Accounting subsystem [30]. Processes are assigned to a cgroup by writing the process–id into a cgroup–specific task–file, and the CPU– resources of a cgroup is found by reading a cgroup–specific accounting–file. The CPU–allocation subsystem schedules the CPU–resources among the cgroups with processor–sharing. The distribution of CPU-resources is determined by cgroup– specific share–values written in cgroup–specific scheduler– files. All administration of the scheduler is done with standard open, close, read, and write file–operations. According to measurements, not presented here, the access is done on the scale of 0.2 ms, and the scheduler can be considered as true processor–sharing and without dynamics down to a time resolution of around 100 ms. The Control Group implementation is illustrated in Fig. 13. All idle processes were implemented as infinite while–loops, in order to use all capacity given to them. The Apache server is grouped with an idle process in a CPU–allocation cgroup. The idle process, in the following denoted loss–idle process, represents the loss of allocated CPU capacity, since it will use all capacity allocated but not used by the Apache. In order to distinguish between the resources used by the Apache server and the loss–idle process, these two are placed in separate accounting cgroups. An accounting cgroup and a CPU–allocation cgroup are defined for the other applications on the server system, denoted “secondary” in Fig. 13. These applications are assumed to use the capacity that is not used by the target application. All remaining processes (operating system processes, administrating processes, and the controller) are collected in an accounting cgroup and a CPU–allocation cgroup. The loss–idle process and the control process were implemented by using special requests to the Apache server and by moving these processes to the relevant cgroups, as indicated by the arrows. The loss–idle process is implemented in the normal Apache request–handling sequence. When the idle.start–file is requested, an Apache log_transaction hook starts an infinite while–loop. This special request responds with a simple html answer, but never finishes the logging phase. This means that the while loop will use a process as long as the while loop exists. This does not cause any problems in the normal use of the server, since Apache spawns new processes when needed (in the case of prefork). The while loop is governed by a lock implemented with a semaphore. When a normal requests arrives, it checks if it is the only (normal) request being served. If this is true, it locks the semaphore, and the while loop stops. Likewise, when a normal request
Authorized licensed use limited to: IEEE Xplore. Downloaded on March 15,2010 at 05:38:33 EDT from IEEE Xplore. Restrictions apply.
KJAER et al.: RESOURCE ALLOCATION AND DISTURBANCE REJECTION IN WEB SERVERS USING SLAS AND VIRTUALIZED SERVERS Basic
TABLE I AVERAGE PROCESSING TIMES , FOUND FROM LOW– RATE EXPERIMENTS Secondary
Server
OS
Idle
Control
235
Popularity distribution 1 2
Mother
Req
Req
Req
Req
Idle
Idle
cgroup with CPU–allocation and accounting cgroup with accounting
Apache processes
cgroup with CPU–allocation
Non–Apache processes
Fig. 13. Schematic diagram of the processes and cgroups for the Apache implementation.
finishes, it checks if it will leave the system empty for normal requests, and if this is the case, it releases the semaphore. When the loss–idle process is initiated, it first looks up its own process–id and then moves itself from the Apache accounting– cgroup to the special loss–cgroup for accounting by writing the process–id to the relevant task–file. Tests, not presented here, show that the occupation of the CPU shifts between the idle process and the Apache process momentarily to an accuracy of 20 ms. It was not possible to test the process shifting with any smaller time accuracy, since the non–ideal processor sharing will be too significant to draw any conclusions. The controller must have access to the measured variables, which was implemented in the Apache server. Therefore, the controller is implemented as a special request with similar structure as the loss–idle process. When the periodicctrl.start–file is requested, the handling process enters an infinite loop under the logging phase. For each loop a control action (reading of relevant measurements and variables, calculation of a new control signal, and setting the relevant share–files) is performed, the loop sleeps for a specified amount of time before waking up for a new sample. Because the calculation of the control signal and the setting of the actuator does not happen instantaneously, this delay is measured and subtracted from the desired sampling interval to obtain an accurate sleep–interval. Before the control process enters the infinite loop, it moves itself to the basic cgroup, both for CPU–allocation and for accounting. C. Traffic Generation Different solutions are available for generating workload for web server systems, such as RUBiS [31] and SURGE [32]. In this article, traffic was generated with the CRIS tool [33], which is a java–based software tool developed in a large research project related to crisis emergency management at Lund University. The CRIS tool is based on real–life data traces from Sweden’s largest news site. This means that both the traffic model and the request distribution are based on real data. CRIS allows several clients (computers) to unite to generate traffic with the specified distribution. Traffic–information files
50%CPU 10.7 ms 11.8 ms
85%CPU 14.1 ms 14.9 ms
defining both the arrival times of requests and the requested documents are uploaded to the clients prior to an experiment. Therefore, the same traffic–information files can be used for several experiments, providing an easy way to compare different system implementations. For the server, CRIS generates a number of PHP files. A PHP request then generates a string of characters, which length is fixed for the given file, but varies over the total amount of PHP–files with a pre–defined distribution. Also, a distribution on the document popularity is configured, which determines the probability for each PHP–file to be requested. D. Off-line estimation of average processing–time The file–popularity distribution and the character distribution derived by the CRIS tool will, of course, influence the distribution of the processing time. Since the controllers for comparison, QFF and IPFF, needs an off-line estimate of the average processing time, experiments with low arrival rates (as in [5], [15]) were performed. Four experiments were conducted; two different popularity distributions (same as in later experiments) and two different values of the CPU allocation parameter, 𝑝𝑟 (kept constant during the experiment). The inter–arrival times were set to 1 second (deterministic distribution), which ensured that only one job was present at a time, and thus, no queuing was involved. 5000 requests were used for each experiment. A necessary modeling assumption for the off-line estimations is that the response time, 𝑇 , of a request is only dependent on the processing time, 𝑤, and the CPU allocation parameter, 𝑝𝑟 . This means that an estimate of the processing time for a request, 𝑤, ˆ can be calculated as 𝑤 ˆ = 𝑇 ⋅ 𝑝𝑟
(18)
The estimations of the average processing time are listed in Tab. I. The estimates should have been independent of the CPU allocation parameter. However, as seen in the table, this is not the case. This result indicates that other factors than the actual CPU processing, such as I/O handling and memory handling, affects the response time, and thus, the model is not accurate. In control theory, model errors do not necessarily yield poor performance due to the properties of feedback. However, if feed–forward is used, model errors can degrade the performance. VII. E XPERIMENTS In order to evaluate the controllers, we performed experiments on the testbed. To avoid unnecessary delays caused by file accessing, data for individual requests were not saved. Instead, the relevant metrics were averaged over a sample interval and saved after the control signal had been set. All results presented here are based on such measurements. The
Authorized licensed use limited to: IEEE Xplore. Downloaded on March 15,2010 at 05:38:33 EDT from IEEE Xplore. Restrictions apply.
236
IEEE TRANSACTIONS ON NETWORK SERVICE MANAGEMENT, VOL. 6, NO. 4, DECEMBER 2009
50 0 1000
1020
1040
1060
1080
1100
1120
Control Signal 100
102
PFB IPFF QFF
100 98 96 20
Variation Cost 𝑉𝑇 (ms2 )
100
Response time (ms)
Response Time
150
30
40
50
60
70
80
90
100
110
120
130
90
100
110
120
130
90
100
110
120
130
Variation Cost
4
2
x 10
1.5
50
0 1000
1020
1040
Loss (%CPU)
1060
1080
1100
1120
Loss of CPU
60
20 0 1000
1020
1040
1060
Time (s)
1080
1100
30
40
50
60
1120
70
80
Loss of CPU
10
PFB IPFF QFF
40
1
0.5 20
Loss (%CPU)
Control Signal (%CPU)
Response time (ms)
Response Time 200
5
0 20
30
40
50
60
70
80
Arrival rate 𝜆 (req/s))
Fig. 14. Experimentally steady–state results in the time–domain. 𝜆 = 50 /𝑠. 𝑤 ˆ = 0.011 𝑠, 𝑇𝑠 = 1 𝑠, 𝑇𝑟𝑒𝑓 = 0.1 𝑠.
Fig. 15. Averaged steady state experiments for different arrival rates 𝜆. 𝑤 ˆ = 0.011 𝑠, 𝑇𝑠 = 1 𝑠, 𝑇𝑟𝑒𝑓 = 0.1 𝑠.
sample interval was 1 sec for all experiments. Also, 10% of the CPU was reserved for the basic group (operating system and controller), and the control signal was restricted to be in the interval 1% - 89%. The average processing–time estimate was set according to the off–line experiments to 𝑤 ˆ = 11 𝑚𝑠, which corresponded approximately to the estimated processing time of the initial traffic; see Tab. I. The control parameters for the predictor were as for the simulations except for the parameter 𝐾𝑖 which was chosen as 𝐾𝑖 = 0.0001. The parameters for the periodic PI–controller were chosen as 𝐾𝑝 = 5 ⋅ 10−5 , 𝐾𝑖 = 3.0, 𝐾𝑎 = 10.0 except for the PFB controller, which was implemented with 𝐾𝑝 = 40 ⋅ 10−5. The proportional gain of the PFB–controller was chosen as 𝐾𝑝𝑓 𝑏 = 0.003. The periodic PI–controllers used the comparison of the reference, and an average of the response times of the requests departed during the last sampling interval. Compared to the response time, the response time estimate already incorporates some averaging. Therefore, the response time and the response–time estimate were pre–filtered separately with different filters, before being combined to an estimation error for the predictor. All three filters were implemented as first– order auto–regressive filters (the same structure as (14)). The filter constant used for the response time and the response time estimate were 𝛼 = 0.0005 and 𝛼 = 0.5, respectively. The filter constant for the estimation error was 𝛼 = 0.01. The feed–forward signal from the IPFF controller was filtered with first–order auto–regressive filter with filter constant 𝛼 = 0.5. Since the involved signals are very irregular, all time–domain results are presented as 30 𝑠 averages. As in Section V, the investigations are divided into steady– state investigations and transient investigations. The steady– state behavior illustrates how the controllers handles the short– term stochastic variations, while the transient investigations revels the controllers capability to handle larger changes in the work load. The latter is the main focus of the paper.
maintain a steady response time compared to the two other controllers. It is also observed that the control signal of the IPFF and the PFB controllers are more unsteady than that of the QFF controller. Fig. 15 shows the average results of a number of steady– state experiments of different average arrival rates 𝜆. It shows that all the controllers are capable of maintaining the average response time near the reference (better than the simulations indicated). The IPFF and the PFB controllers showed similar capability to hold a steady average response time (similar variation costs) at least for medium and high load. The proposed PFB controller outperformed the other controllers with regards to the loss of computationally resources at high load, but had the worst performance at low/medium load. These conclusions corresponds well with the observations from the simulations. The levels of the loss of computationally resources were all an order of magnitude higher than the simulation results with varying arrival rate (Fig. 7). This is expected to be due to the different response time references; 1 𝑠 for the simulations and 0.1 𝑠 for the experiments. When the response times are smaller, fewer requests are being treated simultaneously, and there is a higher risk for the system to be empty occasionally and thus a higher loss of computationally resources.
A. Steady State Experiments Fig. 14 shows results from a steady state experiment with medium load (𝜆 = 50 /𝑠) after the transient period. The figure shows a trend similar for other work loads; The queuing– theory based controller (QFF) shows the worst capability to
B. Transient Experiments The transient behavior of a controller shows how robust the controller is to changes in the system, for example changes in the arrival rate. Therefore, we performed two sets of experiments with changing arrival rates. In the first experiment, the system was initially exposed to a medium–load traffic with 𝜆 = 50 𝑟𝑒𝑞/𝑠. After 150 𝑠, the arrival rate doubled, such that the system was exposed to high–load traffic. In the second experiment, the system was initially exposed to high– load traffic, with 𝜆 = 100 𝑟𝑒𝑞/𝑠. After 150 𝑠, the arrival rate decreased rapidly to 𝜆 = 50 𝑟𝑒𝑞/𝑠. Fig. 16 and Fig. 17 show the results of the two sets of experiments. As can be seen in the figures, the queuing based predictor (QFF) performed rather badly. It over–reacted to the changes, thus spending too much computational resources. Also, the settling time in rather long. The inverse–prediction
Authorized licensed use limited to: IEEE Xplore. Downloaded on March 15,2010 at 05:38:33 EDT from IEEE Xplore. Restrictions apply.
KJAER et al.: RESOURCE ALLOCATION AND DISTURBANCE REJECTION IN WEB SERVERS USING SLAS AND VIRTUALIZED SERVERS
Response Time
Response Time 4000
PFB IPFF QFF
400
Response time (ms)
Response time (ms)
500
reference
300 200 100 0
−100
−50
0
50
100
150
200
250
300
0
0
50
100
150
200
250
300
350
400
250
300
350
400
Loss of CPU
30
CPU loss (%CPU)
CPU loss (%CPU)
1000
35
25 20 15 10
25 20 15 10 5
5
Fig. 16.
reference 2000
350
30
0
PFB IPFF QFF
3000
Loss of CPU
35
237
−100
−50
0
50
100
Time (s)
150
200
250
300
350
Transient experiment–results with increasing arrival rate.
0
0
50
100
150
200
Time (s)
Fig. 18. Experimentally steady–state results in the time–domain. 𝜆 = 50 /𝑠. 𝑤 ˆ = 0.011 𝑠, 𝑇𝑠 = 1 𝑠, 𝑇𝑟𝑒𝑓 = 1 𝑠.
Response Time
Response time (ms)
500
PFB IPFF QFF
400
reference
300 200 100 0
−100
−50
0
50
100
150
200
250
300
350
200
250
300
350
Loss of CPU
35
CPU loss (%CPU)
30 25 20 15 10 5 0
−100
−50
0
50
100
Time (s)
150
𝐾𝐼 = 0.2, 𝑘𝑝𝑓 𝑏 = 0.0005) resulted in stable and well– behaved systems, both under 50 requests/second and 100 requests/second. The QFF controller was tuned with a faster PI controller (𝐾𝑝 = 0.0001, 𝐾𝐼 = 100.0, 𝑘𝑝𝑓 𝑏 = 0.0005) to insure operation at 50 requests/second. Even if the PI controller was stable and managed to suppress the variations when the feed-forward was not utilized, the system entered a sever limit cycle (instability) when the feed–forward was included (see Fig. 18). These oscillations cannot be explained at the present time, but are expected to originate from a internal feedback inherited from the design of Apache. This is a topic of an ongoing research.
Transient experiment–results with decreasing arrival rate.
VIII. D ISCUSSION
controller (IPFF) did not react immediately to the change, but managed to recover relatively fast and with a relative small increase in the response time. The feedback–based prediction– controller (PFB) had the best performance. It reacted quickly to the change, and kept the increase in the response time to a minimum. The results illustrated in Fig. 18 show a change in the arrival rate 𝜆 from 50 𝑟𝑒𝑔/𝑠 to 100 𝑟𝑒𝑞/𝑠 when the response– time reference was 1 𝑠. This operating condition stresses the server severely. It also stresses the controller, since a small change in the control signal 𝑝𝑟 will lead to large changes in the response times. In control theory, this is expressed as a higher gain, which can cause instability. Also, the system tends to deviate more which can bring the controller outside its range of operation. To solve this, the periodic controller can be tuned with a higher gain to suppress the variations. This, on the other hand, compromises the stability, since higher gains often lead to instability. If the feed–forward can suppress the variations well enough, a low–gain periodic controller can be allowed, which can ensure stable operation. Testing different controllers showed that it was not possible to find a periodic PI–controller without feed-forward that could handle the variations at 50 requests/second and remain stable for 100 requests/second. Using the IPFF and the PFB controllers together with a slow periodic controller (𝐾𝑝 = 0.000004,
In all transient evaluations, both by simulations and by experiments, the proposed PFB–controller showed superior capability compared to the other controllers to suppress the effect of the change of work load. The improvement compared to the IPFF–controller was not as pronounced as compared to the QFF–controller, which can be related to the more advanced structure of both the PFB controller and the IPFF controller, which both incorporate measurements of the number of jobs, 𝑁 . In the experimental results the PFB–controller was in particular able to react faster to the change in arrival rate, and thus avoid a large deviation in the response time and furthermore return to a steady operation sooner. A general trend in all the investigations was the poor performance of the queuing–based controller (QFF). It is based on a fixed, off–line estimated processing–time, and only considers long–term averages in the feed–forward part. Only with low arrival rate, where the stochastic of the traffic became dominating, this controller performed similarly or a bit better than the other controllers. The transient behavior clearly indicates the problems of basing the feed–forward on off-line estimations. In the presented results the average processing time used in the feed–forward were over–estimated. Since this estimate enters the feed–forward signal proportionally an over–estimate can have a dramatic effect, as seen in all of the transient simulations and experiments; see Figs. 9 and 16. A solution is to reduce the estimate of the processing time manually, but then the procedure is no longer systematic,
Fig. 17.
Authorized licensed use limited to: IEEE Xplore. Downloaded on March 15,2010 at 05:38:33 EDT from IEEE Xplore. Restrictions apply.
238
IEEE TRANSACTIONS ON NETWORK SERVICE MANAGEMENT, VOL. 6, NO. 4, DECEMBER 2009
and if it is lowered too much, the desired effect of the feed–forward diminishes. The simulations and the experiments clearly indicates that a control structure, where the processing time is not estimated off–line is clearly preferable. Feedback is a power–full tool in order to optimize transient responses, eliminate steady state errors and overcome model errors, and is thus used in various applications from air–plain auto–pilots to oil production plants. A concern of feedback is the stability, since faulty designed feedback can lead to instability. Stability is critical in many applications, and thus, stability properties have been a major issue in control theory for a long time, and association a controller with a formal proof of stability has become the standard. The stability of controllers are usually based on dynamical models which, to some extent, describe the physical system under consideration. In the case of response–time control such models do not exist, due to the complicated nonlinear, stochastic, and event driven nature of the queuing system. Attempts to find dynamic models of the queue lengths of queuing systems have been taken, and controllers with formal stability proofs have been presented [6], [34], but no dynamic model describing the response time has, to the knowledge of the authors, been presented. Approaches have been taken to derive models by system identification, but these methods assume that the environment remains constant, which is not always the case. Examples of such work are presented by Lu et al. and Hellerstein et al. [22], [35]. A formal proof of stability of the predictor (which becomes a dynamic system due to the PI controller) or for the response–time PI–controller is therefore not presented in this paper, just as no formal proofs are posted for any other results on response–time control. Lacking of formal stability proofs lead to conservative controllers designed by trail–and error, which gives no guidelines to how the controllers behave in other situations, and, until dynamic models are available, the controller will have to be re–tuned whenever applied to another system than that presented here. Again, this is the situation for any controller scheme for response time control. Further research is needed in order for the control scheme to be merged into more realistic setups. The filtering issues needs to be simplified, and a structured way to determine the right set of controller values must be found. Dynamic models of the server would help this significantly since formal methods for model–based control–design are available. The unexplained oscillations observed with the QFF controller at high response–time reference indicates that the queuing–based feed–forward have some fundamental problems when the system are exposed high loads. These problems have not been observed with the other controllers, but it can not be guaranteed that these controllers does not become unstable under other conditions. However, the experiments with high loads (Fig. 18) indicate that having a proper designed feed–forward is important - even for steady–state operation. IX. C ONCLUSIONS Resource management has become an important issue in the design of Internet server systems. Optimization of the allocated resources will both save running costs and decrease
the energy consumption. In this article, we have focused on an information related web site, e.g a news site, hosted in a virtualized server environment. We have investigated the optimization of CPU capacity allocated to the web site under changing work–loads, where the objective has been to minimize the allocated capacity while respecting the SLA. We have presented a controller structure for a processor sharing system where the dedicated allocated share of CPU capacity could be set at fixed time intervals. The controller structure was tested both by discrete event–simulation and by experiments on a testbed. The results of the simulations and the experiments agreed on the qualitative behavior of the controllers. The performance of proposed controller was compared to two other controllers from the literature. The most important difference between our proposed controller and the compared controller, is that it does not require an off-line estimation of the average processing time. This means that our controller has a superior transient behavior since it becomes very robust to changes in the system. ACKNOWLEDGMENT This work has been founded by the Swedish Research Council, project 621-2006-5522. Maria Kihl is funded in the VINNMER project at VINNOVA. R EFERENCES [1] J. Hellerstein, Y. Diao, S. Parekh, and D. Tilbury, “Control engineering for computing systems," IEEE Control Syst. Mag., vol. 25, no. 6, pp. 56-68, 2005. [2] Y. Diao, C. Wu, J. Hellerstein, A. Storm, M. Surendra, S. Lightstone, S. Parekh, C. Garcia-Arellano, M. Carroll, L. Chu, and J. Colaco, “Comparative studies of load balancing with control and optimization techniques," in Proc. American Control Conf. 2005, Portland, OR, June 2005, pp. 1484-1490. [3] Y. Fu, H. Wang, C. Lu, and R. Chandra, “Distributed utilization control for real-time clusters with load balancing," in Proc. IEEE International Real–Time Syst. Symp. (RTSS’06), pp. 137-146. [4] X. Chen, H. Chen, and P. Mohapatra, “Aces: an efficient admission control scheme for QoS-aware web servers," Computer Commun., vol. 26, no. 14, pp. 1581–1593, 2003. [5] X. Liu, J. Heo, L. Sha, and X. Zhu, “Adaptive control of multi–tiered web applications using queuing predictor," in Proc. 10𝑡ℎ IEEE/IFIP Netw. Operation Mangement Symp., Vancouver, Canada, Apr. 2006. [6] M. Kihl, A. Robertsson, M. Andersson, and B. Wittenmark, “Controltheoretic analysis of admission control mechanisms for web server systems," World Wide Web J., Springer, vol. 11, no. 1-2008, pp. 93-116, Aug. 2007. Online Aug 2007, print March 2008 (DOI 10.1007/s11280007-0030-0. [7] R. Bianchini and R. Rajamony, “Power and energy management for server systems," IEEE Computer, vol. 37, no. 11, pp. 68-76, 2004. [8] T. Horvath, T. Abdelzaher, K. Skadron, and X. Liu, “Dynamic voltage scaling in multitier web servers with end-to-end delay control," IEEE Trans. Computers, vol. 56, no. 4, pp. 444-458, 2007. [9] E. Elnozahy, M. Kistler, and R. Rajamony, “Energy-efficient server clusters," in Lecture Notes in Computer Science 2325. Springer-Verlag Berlin Heidelberg, 2003, pp. 179-197. [10] W. Xu, X. Zhu, S. Singhal, and Z. Wang, “Predictive control for dynamic resource allocation in enterprise data centers," in Proc. 10𝑡ℎ IEEE/IFIP Netw. Operation Mangement Symp., Vancouver, Canada, Apr. 2006. [11] Z. Wang, X. Liu, A. Zhang, C. Stewart, X. Zhu, T. Kelly, and S. Singhal, “AutoParam: automated control of application-level performance in virtualized server environments," in Proc. Second IEEE Int. Workshop Feedback Control Implementation Design Computing Syst. Netw. (FeBID’07), Munich, Germany, pp. 2-7. [12] J. Heo, D. Henriksson, X. Liu, and T. Abdelzaher, “Integrating adaptive components: an emerging challenge in performance–adaptive systems and a server farm case–study," in Proc. IEEE 28th International Real– Time Syst. Symp. (RTSS 2007), pp. 227-238.
Authorized licensed use limited to: IEEE Xplore. Downloaded on March 15,2010 at 05:38:33 EDT from IEEE Xplore. Restrictions apply.
KJAER et al.: RESOURCE ALLOCATION AND DISTURBANCE REJECTION IN WEB SERVERS USING SLAS AND VIRTUALIZED SERVERS
[13] J. Heo, P. Jayachandran, I. Shiny, D. Wang, and T. Abdelzaher, “OptiTuner: an automatic distributed performance optimization service and a server farm application," in Proc. Fourth IEEE Int. Workshop Feedback Control Implementation Design Computing Syst. Netw. (FeBID’09), San Francisco, CA, Apr. 2009. [14] Y. Lu, T. Abdelzaher, C. Lu, L. Sha, and X. Liu, “Feedback control with queuing–theoretic prediction for relative delay guarantees in web servers," in Proc. 9th IEEE Real–Time Embedded Technol. Application Symp. (RTAS’03), Toronto, Canada, May 2003. [15] D. Henriksson, Y. Lu, and T. Abdelzaher, “Improved prediction for web server delay control," in Proc. 16th Euromicro Conf. Real–Time Systems (ECRTS’04), Catania, Italy, June 2004. [16] M. Kjær, M. Kihl, and A. Robertsson, “Response–time control of single server queue," in Proc. 46th IEEE Conf. Decision Control, New Orleans, LA, Dec. 2007. [17] M. A. Kjær, M. Kihl, and A. Robertsson, “Response-time control of a processor-sharing system using virtualized server environments," in Proc. 17th IFAC World Congress, pp. 3612-3618, Seoul, Korea, July 2008. [18] P. Padala, K.-Y. Hou, K. G. Shin, X. Zhu, M. Uysal, Z. Wang, S. Singhal, and A. Merchant, “Automated control of multiple virtualized resources," in Proc. EuroSys ’09: 4th ACM European Conf. Computer Syst., New York, pp. 13-26. [19] D. Anderson, D. Sweeney, and T. Williams, Statistics for Business and Economics, 7th ed. South–Western College Publishing, 1998. [20] K. Åström and B. Wittenmark, Computer–Controlled Systems. Upper Saddle River, NJ: Printice Hall, 1997. [21] K.-E. Årzén, “A simple event-based PID controller," in Preprints 14th World Congress IFAC, Beijing, P.R. China, Jan. 1999. [22] J. L. Hellerstein, Y. Diao, S. Parekh, and D. M. Tilbury, Feedback Control of Computing Systems. Wiley-Interscience, 2004. [23] K. Åström and T. Hägglund, Advanced PID Control. Research Triangle Park, NC: ISA-The Instrumentation, Systems, and Automation Society, 2005. [24] L. Kleinrock, “Time–shared systems: a theoretical treatment," J. Assoc. Computing Machinery, vol. 14, no. 2, pp. 242-261, Apr. 1967. [25] M. S. S. Noguahi and J. Oizurnih, “An analysis of the M/G/1 queue under round–rubin scheduling," Operations Research, vol. 19, no. 2, pp. 371-385, Mar.-Apr. 1971. [26] K. Åström, Introduction to Stochastic Control Theory. Mineola, NY: Dover Publications. Inc, 2006. [27] “The apache software foundation." [Online]. Available: http://www.apache.org, nov. 2008. [28] B. Laurie and P. Laurie, Apache: The Definitive Guide, 3rd ed. O’Reilly, Dec. 2002.
239
[29] “What are cgroups?" [Online]. Available: http://www.linuxhq.com/kernel/v2.6/25/Documentation/cgroups.txt, Nov. 2008. [30] “This is the cfs scheduler." [Online]. Available: http://www.linuxhq.com/kernel/v2.6/25/Documentation/scheddesign-CFS.txt, Nov. 2008. [31] “Rice University Bidding System." [Online]. Available: http://rubis.ow2.org/, Apr. 2009. [32] P. Barford and M. Crovella, “Generating representative web workloads for network and server performance evaluation," in Proc. Performance ’98/ACM SIGMETRICS ’98, Madison WI, 1998, pp. 151-160. [33] A. Hagsten and F. Neis, “Crisis request generator for internet servers," Master’s thesis, LTH, Lund University, 2006. [34] D. Tipper and M. K. Sundareshan, “Numerical methods for modeling computer networks under nonstationary conditions," IEEE J. Sel. Areas Commun., 1990. [35] C. Lu, T. F. Abdelzaher, J. A. Stankovic, and S. H. Son, “A feedback control approach for guaranteeing relative delays in web servers," in Proc. IEEE Real–Time Technol. Applications Symp., 2001, pp. 51-62. Martin Ansbjerg Kjær recently finished his Ph.D. at the Department of Automatic Control, LTH, Lund University, Sweden. He received his M.Sc. at Aalborg University, Denmark in 2003. His research interests include dynamic modeling and control design for event–driven stochastic systems. Maria Kihl received her M.Sc. in Computer Science and Engineering at Lund University, Sweden, in 1993. In 1999 she received her Ph.D in Communication Systems from the same university. Since 2004, she has been an Associate Professor. During 2005-2006 she was a visiting researcher at NC State University. Her main research area is performance of distributed telecommunication applications. She has worked on service oriented architectures, web server systems, vehicular networks, and IP-access networks. Anders Robertsson received the M.Sc. degree in electrical engineering and the Ph.D. degree in automatic control from LTH, Lund University, Sweden, in 1992 and 1999, respectively. He was appointed Docent in 2005. He is currently associate professor at the Department of Automatic Control, LTH, Lund University. His research interests are in nonlinear control systems, robotics, observer-based control, real-time systems and different control issues in telecommunications and computing systems, such as admission and overload control in network nodes and server systems. The work on sensordata integration and force control of industrial robots in collaboration with ABB Robotics was awarded the EURON Technology Transfer Award in 2005. He has been guest lecturer at Umeå Univerity during 2006-2007 and been a visiting professor at UPV, Valencia, Spain, in 2007.
Authorized licensed use limited to: IEEE Xplore. Downloaded on March 15,2010 at 05:38:33 EDT from IEEE Xplore. Restrictions apply.