May 31, 2015 - creasing data sizes, the need for advanced analytics [10, 32], and very specific workload characteristics [11, 46] led to specialized systems for ...
Resource Elasticity for Large-Scale Machine Learning Matthias Boehm1 , Yuanyuan Tian1 , Berthold Reinwald1 , Shirish Tatikonda1 , Frederick R. Reiss1 1
IBM Research – Almaden; San Jose, CA, USA 2 Duke University; Durham, NC, USA
ABSTRACT MR Memory (GB)
20
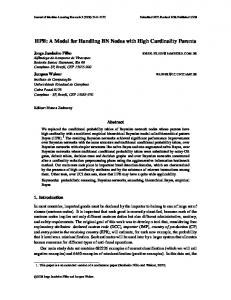
Declarative large-scale machine learning (ML) aims at flexible specification of ML algorithms and automatic generation of hybrid runtime plans ranging from single node, in-memory computations to distributed computations on MapReduce (MR) or similar frameworks. State-of-the-art compilers in this context are very sensitive to memory constraints of the master process and MR cluster configuration. Different memory configurations can lead to significant performance differences. Interestingly, resource negotiation frameworks like YARN allow us to explicitly request preferred resources including memory. This capability enables automatic resource elasticity, which is not just important for performance but also removes the need for a static cluster configuration, which is always a compromise in multi-tenancy environments. In this paper, we introduce a simple and robust approach to automatic resource elasticity for large-scale ML. This includes (1) a resource optimizer to find near-optimal memory configurations for a given ML program, and (2) dynamic plan migration to adapt memory configurations during runtime. These techniques adapt resources according to data, program, and cluster characteristics. Our experiments demonstrate significant improvements up to 21x without unnecessary over-provisioning and low optimization overhead.
1.
20 500
15
400 300
10
200
5
100
5 10 15 CP Memory (GB)
20
Linreg CG, X(8GB)/y(8MB) 240
15
220 200
10
180 5
160 140 5 10 15 CP Memory (GB)
20
Figure 1: Estimated runtime [s] of two ML scripts for linear regression with different control program (CP) and MapReduce (MR) memory configurations. statistical functions [6, 7, 12, 13, 20, 24, 31, 32, 46, 48]. In contrast to tailor-made ML algorithms or ML libraries, this declarative approach allows (1) full flexibility to specify new ML algorithms or customizations, (2) physical data independence of the underlying data representation (dense/sparse matrices, matrix blocking, etc), and (3) both efficiency and scalability via automatic cost-based optimization of hybrid in-memory and distributed runtime plans. ML systems often exploit MapReduce [15] or more general data-parallel distributed computing frameworks like Spark [49] in order to share cluster resources with other specialized systems. Problem of Memory-Sensitive Plans: Compiling hybrid runtime plans is important for declarative ML to enable users to write their ML algorithms once but ensure efficiency for small and medium problems (e.g., median job sizes of analytics clusters were reported as r1c . This fact leads to pruning of entire areas as shown in Figure 5(d). An important resulting property of this grid pruning is that the number of pruned points depends on the data size. The smaller the data, the earlier every operation fits in memory and we can prune the second dimension. This property is important for small relative optimization overhead. For small data (where execution time is likely small), we prune more points and thus have very small overhead; for larger data, we prune fewer points, but the higher optimization overhead is justified by higher expected execution time. Pruning Blocks of Unknowns: Pruning blocks of small operations works very well if sizes of intermediates can be inferred. However, if inference is not entirely possible, even a single unknown operation per block prevents the pruning of the second dimension of this block. One key observation is that if we are not able to infer intermediate sizes, often entire blocks become unknown. Clearly, if sizes and hence memory estimates are unknown, we will not find different plans with different costs. We exploit this property by pruning all blocks where all MR operations have unknown dimensions.
4.
Resource Manager (RM)
4.1
Overview and Runtime Migration
Our basic approach for runtime adaptation is integrated with our default dynamic recompilation [5] at the granularity of last-level program blocks. If a block is subject to dynamic recompilation and if after dynamic recompilation at least one MR job exits, we trigger our runtime resource optimization. The intuition is as follows: The common case of adaptation is to extend the AM memory, because operations do not fit in the current memory budget, which leads to spawning unnecessary MR jobs. Furthermore, the latency of an MR job covers potential optimization overheads. Resource Reoptimization: As shown in Figure 6, runtime adaptation has four steps. First, we determine the program scope of re-optimization. Second, we leverage the previously described resource optimizer to find the optimal resource configuration, where we always update MR configurations. Third, we decide on runtime adaptation if the cost benefit of the new configuration amortizes the estimated migration costs. Fourth, if beneficial, we migrate the current AM runtime and resume execution in the new container. AM Runtime Migration: Efficient runtime migration is a necessary precondition for any related optimization decisions. At a high level, our runtime migration relies on AM process chaining, which allows for transparent runtime resource adaptation, invisible to the client. Assume we decided to migrate the current CP runtime. The current AM first requests a new container according to the new CP resources. Then, we materialize the current runtime state. This state comprises the current position of execution as well as the stack of live variables. We currently store the state on HDFS, but in-memory transfer is possible as well. In detail, we write all dirty variables, i.e., all variables whose state differs from its HDFS representation. Furthermore, we also write the current position and the new resource configuration. Once the new runtime container is started, we compile the original script according to the new configuration, restore the stack of live variables, jump to the current po-
RUNTIME RESOURCE ADAPTATION
Optimizing resource configurations via online what-if analysis fundamentally depends on size inference over the entire ML program. Sizes of intermediate results—in terms of dimensions and sparsity—are important for memory estimation, plan generation, and thus cost estimation. Even with advanced strategies for size propagation and memory estimation, there are fundamental challenges that ultimately lead to unknowns and hence the need for runtime plan adaptation. Examples are (1) conditional size and sparsity changes, (2) user-defined functions with unknown output sizes, and (3) data dependent operations. For instance, the following contingency-table/sequence statement—as used for multinomial logistic regression—takes the multi-valued n × 1 label vector y and creates a boolean n × k indicator matrix Y, where k is the number of categories (classes). 1: Y = table( seq(1,nrow(X)), y ); The size of this intermediate Y determines the size of the gradient and thus affects operations on X. Without looking
142
sition and resume execution. Note that export and restore of variables happens transparently through our buffer pool. This simple approach is safe because all our operators and UDFs are stateless and—due to migration at program block boundaries—all intermediates are bound to logical variable names. Finally, as soon as the program finishes, the chain of AM processes is rolled-in, in reverse order. Discussion on Robustness: At this point, another advantage of our what-if resource optimizer becomes obvious. We do not need to serialize execution plans but can pass the original script. Any recompilation of the original script according to the new resource configuration leads to exactly the same plan (after recompilation) as the resource optimizer has found during optimization. Furthermore, keeping the entire chain of AM processes alive might seem like large unnecessary resource consumption. However, in practice this works very well because the chain usually contains just two processes and the initial process is often small.
4.2
migration costs CM are amortized by ∆C, we migrate as described in Subsection 4.1; otherwise we use R∗P |rc as the new configuration but continue in the current AM container.
5.
EXPERIMENTS
Our experiments study the behavior of automatic resource optimization for a variety of representative use cases. We aim to understand end-to-end optimization potential as well as to quantify the efficiency and effectiveness of enumeration strategies. To summarize, the major findings are: End-To-End Improvements: Our resource optimizer found in most cases near-optimal configurations. The improvements are significant due to reduced MR-job latency for mid-sized data and more scalable plans for large data. Avoided over-provisioning also led to good throughput. Sources of suboptimality are buffer pool evictions (only partially considered by our cost model) and unknown data sizes. Optimization Overheads: On the tested variety of ML programs and data sizes, the optimization overhead was very low. However, both grid enumeration and pruning strategies are crucial to accomplish that, especially for larger ML programs. Parallel optimization (see Appx C) achieved additional improvements but is currently of no crucial necessity. Runtime Resource Adaptation: Re-optimization and runtime migration are crucial for ML programs with initial unknowns. The end-to-end improvements are large, while the overhead of runtime migration is low. On the tested ML programs, only up to two migrations were necessary.
Re-Optimization Scope and Decisions
Resource re-optimization is part of dynamic recompilation. Despite low optimization overhead, it is prohibitive to execute resource optimization for every program block, because this might add relatively large overhead and requires a larger scope to be effective. Hence, we apply resource optimization only if dynamic recompilation compiled MR jobs. Re-Optimization Scope: Determining a large program scope P 0 for resource reoptimization aims to prevent local decisions where the migration costs might not be amortized or might lead to multiple runtime migrations. Recall that recompilation works on last-level program blocks. Starting there, our heuristic is to expand the scope from the current position to the outer loop or top level in the current call context (main or current function) to the end of this context. The intuition is that this covers most iterative scripts, where—at least within loops—dimensions do not change. Example Re-Optimization Scope: In our example of multinomial logistic regression, the number of classes k determines the size of intermediates. For example, assume a 107 × 102 input matrix X. On dense data, the memory requirement of below matrix multiplications is 8 GB for k = 2 classes, but 24 GB for k = 200 classes. Dynamic recompilation is triggered on last-level program blocks, i.e., lines 3 and 5. We extend the re-optimization scope to the entire outer while loop in order to (1) account for repeated execution, and (2) prevent unnecessary repeated runtime migrations. 1: while( !outer_converge ) { ... 2: while( !inner_converge ) { ... 3: Q = P[, 1:k] * X %*% V; 4: } 5: grad = t(X) %*% (P[, 1:k] - Y[, 1:k]); Extended Resource Optimization: Resource optimization then reuses our core resource optimizer with one extension. Instead of returning the optimal resource configuration, we return both the globally optimal resources R∗P and the locally optimal resource R∗P |rc , given the current rc configuration. The latter is used for cost comparison and as resource configuration if we decide against migration. Adaptation Decision: We extend our cost model to compute the benefit of migration ∆C = C(P 0 , R∗P ) − C(P 0 , R∗P |rc ) (i.e., ∆C ≤ 0) and the migration costs CM . Migration costs are defined as the sum of IO costs for live variables and latency for allocating a new container. If the
5.1
Experimental Setting
Cluster Setup: We ran all experiments on an 1+6 node cluster, i.e., one head node of 2x4 Intel E5530 @ 2.40 GHz2.66 GHz with hyper-threading enabled and 64 GB RAM, as well as 6 nodes of 2x6 Intel E5-2440 @ 2.40 GHz-2.90 GHz with hyper-threading enabled, 96 GB RAM, 12x2 TB disk storage, 10Gb Ethernet, and Red Hat Enterprise Linux Server 6.5. We used Hadoop 2.2.0 and IBM JDK 1.6.0 64bit SR12. YARN’s RM was configured with min/max allocation constraints of 512 MB and 80 GB, respectively; the NMs were also configured with resources of 80 GB. Whenever we configure a specific heap size, we set equivalent max/initial heap sizes and we request memory of 1.5x the max heap size in order to account for additional JVM requirements. Our HDFS capacity was 107 TB (11 disks per node), and we used an HDFS block size of 128 MB. Finally, we used SystemML (as of 10/2014) with defaults of 12 reducers (2x number of nodes) and a memory budget of 70% of the max heap size. ML Programs and Data: In order to study the behavior of resource elasticity in various scenarios, we use five ML programs and generated both dense and sparse data of different dimensions. Table 1 gives an overview of the characteristics and script-level parameters of these ML programs. Note that we use full-fledged scripts that also compute various additional statistics such as residual bias etc. The number of lines and program blocks are indicators of the program size, which affects the optimization overhead. Two scripts exhibit unknown dimensions during initial compilation (’ ?’). The other attributes refer to script-level configurations: icp is a switch for computing model intercept and scale/normalize the base data, λ refers to a regularization constant, � to the convergence tolerance, and maxi to the max number of iterations. This table also shows basic characteristics: Linreg DS (direct solve) is non-iterative, Linreg CG (conjugate
143
350
#Lines 209 273 119 351 1,149
#Blocks 22 31 20 54 377
? N N N Y Y
Icp. 0 0 0 0 0
λ 0.01 0.01 0.01 0.01 0.01
� N/A 10−9 10−9 10−9 10−9
140
B−SS B−LS B−SL B−LL Opt
300
Maxi. N/A 5 5/∞ 5/5 5/5
Execution Time [s]
Prog. Linreg DS Linreg CG L2SVM MLogreg GLM
250 200
Execution Time [s]
Table 1: Overview ML Program Characteristics.
150 100 50
120 100 80
B−SS B−LS B−SL B−LL Opt
60 40 20 0
1e+04
gradient) has a single loop, while the remaining scripts— L2SVM (L2-regularized support vector machine), MLogreg (multinomial logistic regression), and GLM (generalized linear model, poisson/log)—use nested loops for overall convergence and finding the optimal update per iteration. As test data, we use scenarios of XS (107 cells), S (108 cells), M (109 cells), L (1010 cells), and XL (1011 cells) data size with different number of columns (1,000/100) and sparsity (1.0, 0.01). The number of rows is #cells/#cols. All experiments use binary input data. For dense data, these scenarios correspond to 80 MB, 800 MB, 8 GB, 80 GB, and 800 GB. Baseline Comparisons: To the best of our knowledge, SystemML is the first declarative ML system that automatically optimizes resource configurations. Hence, we compare against baselines with static resource configurations, which use exactly the same YARN runtime integration as our resource optimizer. In detail, we use max CP/MR heap size configurations of 512 MB/512 MB (B-SS), 53.3 GB/512 MB (B-LS), 512 MB/4.4 GB (B-SL), and 53.3 GB/4.4 GB (B-LL). The reasoning is that 512 MB is a minimum container request, 53.3 GB a maximum container request (53.3 GB·1.5 ≈ 80 GB), and 4.4 GB is the maximum task container size that allows to exploit all 12 physical cores and disks per node (12 · 4.4 GB · 1.5 ≈ 80 GB). Appx D also provides a runtimelevel comparisons with SystemML’s runtime on Spark.
5.2
(b) 0.5/2 0.5/2 1/2 8/2 8/2
(c) 0.5/2 8/2 0.5/2 8/2 53.4/12.8
300 200 100 0
1e+07
200 150
B−SS B−LS B−SL B−LL Opt
100 50 0
1e+05
1e+06 1e+07 # of Rows
1e+08
(c) Dense, # of Cols=100
1e+05
Execution Time [s]
1e+06 1e+07 # of Rows
1e+08
(d) Sparse, # of Cols=100
10000
B−SS B−LS B−SL B−LL Opt
8000 6000 4000 2000
(a) dense1000
(b) sparse1000 (c) dense100 Scenario
(d) sparse100
(e) Scenario XL (all dense/sparse scenarios)
Figure 7: Experiments Linreg DS: Scenarios XS-XL. scenario M (8 GB), small CP sizes perform 4x better than pure single node computations because the small CP sizes forced distributed runtime plans. B-SS is slower than B-SL because the small MR tasks caused too many concurrent tasks and hence cache trashing. Opt found very good plans in those scenarios. On scenario L (80 GB), we see that all baselines perform worse than Opt because they either use too few or too many tasks while our optimizer adjusts the number of tasks via a minimum task size based on the number of available virtual cores. Second, Figures 7(b) and 7(d) show the results of the sparse1000 and sparse100 scenarios where usually in-memory operations perform best. Opt also finds that plan with slightly worse performance due to more buffer pool evictions because of the smaller heap size. Third, Figure 7(c) shows the dense100 case which, in contrast to dense1000, is less compute-intensive and hence there are smaller differences. However, on L (80 GB) both large CP (for several vector operations) and large task sizes are important. Opt found these configurations and performed slightly better than B-LL because of no unnecessary overprovisioning which also limits the degree of parallelism. Figure 7(e) shows the results of Linreg DS on scenario XL, which is 800 GB in dense and hence twice as large as aggregate cluster memory. For dense1000, we see again substantial improvements because, despite the good IO subsystem, the right plan (without large shuffling) really matters. Opt finds the best plan and is faster than B-LL due to a higher degree of parallelism. On dense100, Opt selects a plan with 13 GB tasks which cannot be chosen by the baselines. How-
Table 2: Opt Resource Config, Linreg DS, [GB]. (a) 0.5/2 8/2 0.5/2 0.5/2 8/2
400
1e+05 1e+06 # of Rows
(b) Sparse, # of Cols=1,000 250
B−SS B−LS B−SL B−LL Opt
500
1e+04
Execution Time [s]
Execution Time [s]
600
End-to-End Baseline Comparison
B-LL 53.3/4.4 53.3/4.4 53.3/4.4 53.3/4.4 53.3/4.4
1e+07
(a) Dense, # of Cols=1,000
In a first series of experiments, we investigate the endto-end runtime improvement with optimized resource configurations compared to the described baselines. The purpose is to study the effectiveness of initial resource optimization, and hence we disable runtime resource adaptation for the moment. We report end-to-end client elapsed time, which already includes optimization overhead and read/write from/to HDFS. Since we aim for generality, we show how our optimizer behaves over a variety of scenarios. Figure 7 shows the overall baseline comparisons of initial resource optimization (Opt) on Linreg DS. A summary of the found resource configurations is shown in Table 2, where we report CP and max MR sizes. Overall we see that Opt achieves in all scenarios an execution time close to the best baseline; in some cases even better performance. It is important to note that on different scenarios, different baselines perform best. There are several interesting observations: First, Figure 7(a) shows the results for XS-L on dense1000 which is a compute-intensive use case. For scenario S (800 MB), we see that small CP sizes perform worse because the MR job latency is not amortized. However, for
Scenario XS S M L XL
1e+05 1e+06 # of Rows
(d) 0.5/2 0.5/2 4/2 26.9/2 22.7/12.8
144
1e+07
300
200 0 1e+05
1e+06 1e+07 # of Rows
1e+05 1e+06 # of Rows
1e+07
250 200 100
1e+06 1e+07 # of Rows
1e+08
600 400 200 0 1e+05 1e+06 # of Rows
(a) Dense, # of Cols=1,000
3000
100
B−SS B−LS B−SL B−LL Opt
2000 1000 0
2500 2000 1500
1500 1000
1e+06 1e+07 # of Rows
1e+08
(c) Dense, # of Cols=100
2000 1500
B−SS B−LS B−SL B−LL Opt
1000 500
Execution Time [s]
0 1e+06 1e+07 # of Rows
1e+08
1e+05
1e+06 1e+07 # of Rows
1e+08
(d) Sparse, # of Cols=100 700
B−SS B−LS B−SL B−LL Opt
600
500
1e+05 1e+06 # of Rows
1e+07
500 400
B−SS B−LS B−SL B−LL Opt
300 200 0
1e+04
1e+05 1e+06 # of Rows
1e+07
(a) Dense, # of Cols=1,000
B−SS B−LS B−SL B−LL Opt
4000
1000 500
3000 2000
0 1e+05
1e+06 1e+07 # of Rows
1e+06 1e+07 # of Rows
1e+08
(c) Dense, # of Cols=100
(d) Sparse, # of Cols=100
1e+05 1e+06 # of Rows
1e+07
(b) Sparse, # of Cols=1,000 2000 1500
B−SS B−LS B−SL B−LL Opt
1000 500 0
1e+05
1e+08
1e+04
2500
B−SS B−LS B−SL B−LL Opt
1000
0 1e+05
2500
100
(b) Sparse, # of Cols=1,000 3000
1e+07
(b) Sparse, # of Cols=1,000
0 1e+04
Execution Time [s]
Execution Time [s]
4000
2000
B−SS B−LS B−SL B−LL Opt
200
1e+07
1e+05 1e+06 # of Rows
Figure 10: Experiments MLogreg: Scenarios XS-L.
0 1e+04
5000
300
200
1e+04
(c) Dense, # of Cols=100
Execution Time [s]
800
400
400
3000
B−SS B−LS B−SL B−LL Opt
1e+05
Execution Time [s]
1000
600
1e+07
2000
0
500
B−SS B−LS B−SL B−LL Opt
3000
0
(d) Sparse, # of Cols=100
Execution Time [s]
Execution Time [s]
1200
4000
50
Figure 8: Experiments Linreg CG: Scenarios XS-L. 1400
5000
1000
1e+05
(c) Dense, # of Cols=100
6000
150
1e+08
1e+05 1e+06 # of Rows
(a) Dense, # of Cols=1,000
B−SS B−LS B−SL B−LL Opt
800
B−SS B−LS B−SL B−LL Opt
0 1e+04
(b) Sparse, # of Cols=1,000 350
B−SS B−LS B−SL B−LL Opt
0 1e+04
Execution Time [s]
Execution Time [s]
400
500
Execution Time [s]
1e+05 1e+06 # of Rows
(a) Dense, # of Cols=1,000
600
50
1000
0 1e+04
800
100
1500
1000
B−SS B−LS B−SL B−LL Opt
Execution Time [s]
0
150
2000
Execution Time [s]
200
200
B−SS B−LS B−SL B−LL Opt
Execution Time [s]
400
250
B−SS B−LS B−SL B−LL Opt
Execution Time [s]
600
Execution Time [s]
Execution Time [s]
800
1e+05
1e+06 1e+07 # of Rows
1e+08
(d) Sparse, # of Cols=100
Figure 9: Experiments L2SVM: Scenarios XS-L.
Figure 11: Experiments GLM: Scenarios XS-L.
ever, these large tasks reduce the degree of parallelism and thus are only moderately faster. The sparse cases are significantly faster but again Opt found a near-optimal plan. In all these scenarios, the optimization overhead was negligible because even on XL, after pruning only 3 blocks remained. Figures 8-11 show the results for the remaining four ML programs on scenarios XS-L. There are three takeaways. First, on scenarios S and M, a larger CP memory usually leads to significant improvements, where Opt automatically finds these configurations. More iterations would lead to even higher improvements because the initial read is better amortized. Second, for scenario L, both CP and MR memory budgets matter, where Opt found again near-optimal configurations. Third, unknowns are a major problem. This applies to MLogreg and GLM. For all dense scenarios M, Opt was not able to find the right configuration here due to unknowns in the core loops. Sometimes, few known opera-
tions act as guards to find good plans. However, we address this problem in a principled way with CP migration.
5.3
Throughput
In another series of experiments, we investigate our secondary optimization objective, namely preventing unnecessary over-provisioning. We aim to quantify the effect of over-provisioning via throughput experiments because the allocated resources per application directly affect the maximum number of parallel applications (users). We compare Opt with B-LL which was the most competitive baseline from an end-to-end runtime perspective. To measure throughput, we created a multi-threaded driver that spawns client processes at the head node. Each driver thread represents a user and each client process an application. We varied the number of users |U | ∈ [1, 128], where each user is running 8 applications in order to account for setup and tear down.
145
# of Apps: 8/User
20 10 0
��
Opt B−LL
30
7.1x
25 # of Apps: 8/User
20 15 10 5
�� �� �
0 1
2
4
8 16 32 # of Users
64 128
(a) Linreg DS, S dense1000
1
2
4
8 16 32 # of Users
●
��
��
(TXL +\EULG��0HPí([S ([S /LQUHJ�'6 0HP GHQVH ��RI�&ROV� ������
��
��RI�3RLQWV�SHU�'LPHQVLRQ
30
5.6x
��RI�3RLQWV�SHU�'LPHQVLRQ
35
Opt B−LL
40
Throughput [app/min]
Throughput [app/min]
50
64 128
●
●
●
�H���
�H���
●
●
�H��� �H��� ��RI�5RZV
�� ��
�H���
●
●
●
�H���
�H���
●
●
�H��� �H��� ��RI�5RZV
�H���
(b) Base Grid m=45
Figure 13: Comparison of Grid Generators.
Figure 12: End-to-End Throughput Comparison.
35 Remaining Blocks [%]
The reported throughput is measured as total number of applications divided by total driver execution time. Figures 12(a) and 12(b) show the results for Linreg DS, scenario S, dense1000 and L2SVM, scenario M, sparse100, respectively. Our resource optimizer decided for 8 GB/2 GB and 4 GB/2 GB memory configurations, while B-LL always used 53.3 GB/4.4 GB. Given the described cluster allocation constraints, this led to a maximum application parallelism of 6·b80 GB/(1.5·8 GB)c = 36 and 78 for Opt as well as 6 for B-LL. For this reason, there are no differences up to 4 users; but from 8 users onwards, we see increasing improvements. For B-LL, the throughput saturates at 6, while for Opt, it saturates according to the found memory configurations at 36 and 78 users. Similar but less significant effects can also be observed for larger scenarios including MR jobs.
5.4
/LQUHJ�'6 GHQVH ��RI�&ROV� ������
��
�
(a) Base Grid m=15
(b) L2SVM, M, sparse100
��
|B|=20
30
XS S M L XL
25 20
|B|=22
15
|B|=31
|B|=54
10 5 0
|B|=377 0
0 0
Linreg DS
Linreg CG
0 0
0
L2SVM ML Program
0 MLogreg
GLM
Figure 14: Effect of Block Pruning Strategies. mension of each pruned block. Figure 14 shows the percentage of remaining blocks after pruning for all ML programs on dense, #Cols=1,000 data. We see that pruning blocks of small operations is highly beneficial. However, without pruning unknowns, both MLogreg and GLM would have a constant offset of 14 and 64, regardless of the actual data size which would really hurt for small scenarios. Overall Optimization Overhead: To summarize, we now report the optimization times for all used ML programs on use case dense1000. Table 3 shows for the different programs and scenarios, the number of block recompilations, the number of cost model invocations, the optimization time, and the relative overhead regarding total execution time. Note that costing the entire program is counted as a single cost model invocation, and we used Hybrid, m=15 for both dimensions as well as sequential enumeration as used for our previous baseline comparisons. Appendix C reports further results on parallel resource optimization. Most algorithms require a very low optimization time, except GLM which is a very complex ML program with |B| = 377 program blocks.
Optimization Overhead
In a third series of experiments, we investigate the efficiency of our resource optimizer in terms of optimization overhead. Since grid enumeration and pruning techniques are largely orthogonal, we examine them individually and subsequently report the overall optimization times. Grid Enumeration Strategies: Our overall algorithm materializes grid points per dimension and enumerates the cross product of those points. Since grid generators can be arbitrarily combined, we compare the different strategies with regard to one dimension. Figure 13 shows the number of generated points for the scenarios XS-XL of Linreg DS, dense1000. The cluster constraints were mincc =512 MB and maxcc = 53.3 GB. We compare the equi-spaced grid (Equi), exponentially-spaced grid (Exp), memory-based grid (Mem), and our composite hybrid grid (Hybrid), where both Equi and Mem rely on a basic grid. First, Figure 13(a) compares those strategies on a grid of m=15 points. Obviously, Equi and Exp are independent of the input data size, where Exp requires only 8 instead of 15 points. Mem (and thus also Hybrid) depends on the input data and often requires only few points. For small data, all memory estimates are below mincc and hence mincc constitutes the only point. With increasing data size, we get more points (5 at 8 GB); if the data size exceeds maxcc , some estimates are truncated at maxcc and hence usually we get fewer points. Second, Figure 13(b) shows the results for m=45 points which leads to a larger difference between Equi and Exp. In addition, we see slightly more points for Mem due to smaller bin sizes. To summarize, our default strategy Hybrid naturally adapts to the problem, has good coverage but requires only few points which is important due to the resulting squared grid. Pruning Strategies: Pruning of program blocks is of crucial importance to our algorithm because it significantly reduces the search space by eliminating the entire second di-
Table 3: Optimization Details Dense1000. Prog. Linreg DS
Linreg CG
L2SVM
MLogreg
GLM
146
Scen. XS S M L XL XS S M L XS S M L XS S M L XS S M L
# Comp. 352 417 678 448 536 496 558 924 640 320 360 660 464 1,188 1,476 2,148 1,540 8,294 8,518 11,576 8,998
# Cost. 8 30 168 104 149 8 9 192 152 8 9 192 152 11 299 650 363 11 235 1,034 715
Opt. Time 0.35s 0.41s 0.71s 0.56s 0.73s 0.43s 0.47s 0.88s 0.66s 0.36s 0.41s 0.85s 0.71s 0.99s 1.91s 2.89s 2.07s 4.56s 5.78s 11.17s 9.24s
% 3.5 1.0 0.8 0.2 s to prevent the intermediate result of s2 . Figure 16(b) shows the resulting HOP DAG. Other program rewrites include, for instance, branch removal. Consider the if branch on lines 7-11 and an input parameter $icpt = 0. After constant folding, the predicate is known to be false and hence, we remove the branch which allows unconditional size propagation. Subsequently, we do intra-/inter-procedural analysis for size propagation and compute memory estimates per HOP operator based on these propagated sizes. These memory estimates are later used for operator selection in order to decide between in-memory (CP) and large-scale (MR) computation but also to decide upon alternative physical operators, some of which are constrained by available MR task memory. LOP-Level: In a third, step, we construct a LOP DAG for each HOP DAG. First, we decide the execution type with a simple yet very effective heuristic. Whenever an operation fits into the memory budget of CP (given by a ratio of the max JVM size), we assume that in-memory computation is more efficient and decide for execution type CP. Second, for each HOP, we construct a sub-DAG of LOPs, where we choose from alternative LOP operators. For example, we provide six MR and three CP matrix multiplication operators. There are also physical operators for special HOP operator patterns like tertiary-aggregate operators for sum(v1 · v2 · v3) (e.g., see lines 29/30). Third, during LOP
HOP-LOP Rewrites
Piggybacking (MR jobs)
DAG construction, we apply specific HOP-LOP rewrites. Examples are decisions on data partitioning, unnecessary aggregation, and specific rewrites like X> v → (v> X)> that are applied depending on the chosen LOP operator. Fourth, we generate the execution plan, by creating a runtime program consisting of program blocks and executable instructions. We create a program block per statement block and use a piggybacking algorithm to generate instructions for the entire DAG. Piggybacking tries to pack the given LOP DAG into a minimal number of MR jobs under several constraints like job types, execution location of instructions (e.g., map, aggregation, or reduce), and memory constraints. Runtime-Level: In a fourth step, we also allow for dynamic recompilation during runtime if the initial size propagation was not able to resolve all unknowns. In this case, operator selection also marks DAGs for recompilation. Program blocks have references to the original HOP DAGs in order to regenerate runtime plans at any time during program execution. The recompilation hooks are given by the natural program structure or by artificially created cuts of program blocks. The primary target of recompilation are last-level program blocks (generic) or predicates. During recompilation, we exploit the size information of intermediates and propagate them through the DAG before re-applying dynamic rewrites and runtime plan generation. Summary Memory-Sensitive Compilation Steps: Many of the mentioned compilation steps include decisions related to available memory of CP or MR tasks. Table 4 gives examples of those decisions. First, the memory estimate of each HOP operator—with at least one input/output matrix—directly affects its execution type. This allows us, for example, to schedule the entire inner loop of L2SVM into CP memory. Second, efficient physical operators for matrix multiplication and binary elementwise operations are crucial. For example, consider the matrix-vector multiplications in lines 13, 20, and 43, which are the only operations on the large X. A mapmm operator (that broadcasts the vector) allows us to compute this multiplication in the mappers without the need for data shuffling of X but requires that the vector fits into the MR task memory. Third, rewrites like X> v → (v> X)> are only applied if the newly introduced operators can be executed in CP memory. Fourth, also piggybacking of operators into MR jobs is constrained by memory. In addition, there are also memory-related cost factors during runtime. The buffer pool size is relative to the memory budget which affects evictions. In conclusion, there are many memory-sensitive compilation decisions across the entire compilation chain. Online what-if analysis automatically takes all of them and there inter-dependencies into account by generating and costing runtime plans.
… while (lines 17-53), pred: generic (lines 18-23)
DAG (lines 18-23):
dd
while (lines 24-35), pred:
if (lines 32-34), pred:
Xd
…
(a) Statement Blocks
(801GB) ba(+*) MR X
(8KB) CP ua(+) (24KB) CP w
b(*)
0.1
CP
b(*)
generic (lines 36-44)
generic (lines 48-51)
CP
TRUE 0
if (lines 45-47), pred:
b(*)
wd
step_sz
generic (line 33)
generic (line 46)
CP
continue1
generic (lines 25-31)
u(cast) 0.1
Examples CP vs MR (all HOP operators with at least one matrix input or output) (a) MapMM (map matrix mult) (b) MapMMChain (MapMM chain) (c) PMM (permutation matrix mult) (d) Map* (elementwise matrix-vector) (a) Avoid large transpose by transposemm rewrite: X> v → (v> X)> . (b) CP vs MR data partitioning for all map-side binary operators. Bin packing constrained by sum of memory requirements of physical operators.
(16KB) CP
ba(+*) (16KB) CP r(t) s
(b) HOP DAG (after rewrites)
Figure 16: Example ML Program Compilation.
151
C.
Table 5: Spark Comparison: Different Data Sizes.
PARALLEL RESOURCE OPTIMIZER
Scenario (? CP only) XS (80 MB) S (800 MB) M (8 GB) L (80 GB) XL (800 GB)
In order to reduce optimization overhead for large ML programs, we exploit the property of semi-independent problems for parallelization. We aim for a scalable algorithm without global synchronization barriers, with small serial fraction, and without overhead for small or unknown problems. HIR
Master (Algorithm 1 lines 1-9, 15-18)
memo
rc=1GB ccmin
12s
ccmin 7s B3 2GB 134s ccmin 3s B5 3GB 283s
rc=2GB ccmin
12s
ccmin 7s ccmin 31s ccmin 3s 3GB 229s
(A, rc=2GB, {B5}) (E, rc=2GB, B5, Srm) (A, rc=1GB, {B3B5}) (E, rc=1GB, B5, Srm) (E, rc=1GB, B3, Srm)
async task creation
dequeue
Worker 1
# of Users (Scenario S) 1 8 32
Worker 2 Worker 3
lock-free memo update and aggregation
D.
Serial Opt Parallel Opt
30 20 10
4.9x
0
Optimization Time [s]
Optimization Time [s]
12 40
Serial Opt Parallel Opt
10 8 6 4 2 0
1
2
4 8 # of Threads
16
(a) Equi, m=45, dense1000 L
SystemML on Spark Plan 2 (Full) 0.48 app/min 0.84 app/min (1.8x) 0.83 app/min (1.7x)
XS
S
M Scenario
SPARK COMPARISON EXPERIMENTS
We also aim to analyze the potential of resource optimization for stateful frameworks like Spark [49]. Experimental Setting: The setup is the same as described in Subsection 5.1. We used Spark 1.2 (12/2014) and ran it in yarn-cluster mode, with a static resource configuration of 6 executors, 20 GB driver memory, 55 GB executor memory, and 24 cores per executor. Note that Spark (1) relies on static default configurations or per application parameters, and (2) uses more aggressive ratios for JVM overheads, which enabled to run all 6 executors besides the driver. SystemML uses the introduced resource optimizer and the application use case is L2SVM from Appendix A. Baseline Comparison: In the interest of a fair comparison, we ported our SystemML runtime operations on Spark’s JavaPairRDDs and compared (a) SystemML w/ resource optimizer on MR (w/o jvm reuse) with (b) SystemML runtime on Spark. Since Spark is on a lower abstraction level, we had to hand-code execution plans. We literally translated the L2SVM script and created two plans: (1) Hybrid, where only operations on X are RDD operations (lines 13, 20, and 43), while all others are CP-like operations, and (2) Full, where all matrix operations are RDD operations. Table 5 shows the results. First, single-node CP operations are important for small data sets (e.g., see scenarios XSM, Spark Plan 1 and 2). Up to scenario M, Spark Plan 1 does not fully utilize all executor cores. Second, Spark has a sweet spot, due to RDD caching, where data does not fit in a single node but fits in aggregated memory (L). Third, for large data (>2x aggregated memory) there are no significant differences due to similar disk IO and deserialization costs. Throughput Comparison: We also compare the resulting throughput of SystemML with our resource optimizer against SystemML on Spark, Plan 2 (Full). The use case is L2SVM, scenario S (800 MB) and we varied the number of users |U |. We reduced Spark’s driver memory to 512 MB in order to prevent cluster deadlocks without constraining maximum-am-resource-percent. Table 6 shows the results. Moderate resource requirements of SystemML (8GB CP memory, 1 core, no MR jobs) enabled a throughput improvement of 13.7x at 32 users. The speedup is suboptimal due to IO bandwidth saturation (disk/memory). In contrast, due to over-provisioning, even a single Spark application already occupied the entire cluster. The slight throughput increase with more users is due to latency hiding of driver setup and few overlapping applications each with fewer executors. In conclusion, resource optimization is also important for frameworks like Spark to achieve high performance without over-provisioning, while maintaining application isolation.
Figure 17 shows the architecture of our multi-threaded resource optimizer. We use a master and k parallel workers, where each worker creates its deep copy of the program and HOPs for concurrent recompilation. The basic idea is that the master enumerates CP memory budgets rc , and does baseline compilation and pruning, while workers process optimization tasks of enumeration (Enum_Srm, (rc , Bi0 , Srm )), and aggregation (Agg_rc, (rc , B 0 )). For each rc , we create (1) for each Bi0 ∈ B 0 an Enum_Srm task, and (2) a single Agg_rc task. We use a central task queue for load balancing, where workers dequeue and execute tasks. This task-based approach is similar to parallel query optimization in Orca [44] but due to a fixed dependency structure does not require a specialized scheduler. We extend our memo structure to an n × 2 · |Src | matrix that replicates the memo structure for each rc value, for which storage overhead is negligible. For Enum_Srm tasks, workers enumerate the second dimension and finally do a lock-free memo update of locally optimal resources and costs. For Agg_rc tasks, workers probe the memo structure until all blocks for a given rc value have been updated and determine the aggregated program costs. After all tasks have been executed, the master picks the resources with minimal aggregated costs. For small problems, we do not instantiate parallel workers if the initial baseline compilation resulted in B 0 = ∅. This architecture enables (1) task-parallel optimization of semi-independent problems, and (2) pipelining of baseline compilation and enumeration. Experiments Optimization Overhead: Figure 18 shows a comparison of serial and parallel optimization on GLM, dense, #Cols=1,000; ran on the head node (2x4 cores) of our cluster. Figure 18(a) shows Equi with a base grid of m=45. Even for one worker thread, there is an improvement due to pipeline parallelism. Figure 18(b) shows our default Hybrid and all scenarios. On scenarios M and L the benefit increases due to more points and less pruned blocks.
pipelining effect
SystemML on MR w/ Opt 5.1 app/min? 35.6 app/min? (7.0x) 69.8 app/min? (13.7x)
Worker 4
Figure 17: Parallel Resource Optimizer.
50
SystemML on Spark Plan 1 (Hyb.) Plan 2 (Full) 25 s 59 s 31 s 126 s 43 s 184 s 167 s 347 s 10,119 s 13,661 s
Table 6: Spark Comparison: Throughput #Users.
(Algorithm 1 lines 10-14)
Task Queue
SystemML on MR w/ Opt 6 s? 12 s? 40 s? 836 s 12,376 s
L
(b) Hybrid, All Scenarios
Figure 18: Parallel Optimization for GLM.
152