(Lond.) 284: 261-290), judging from the relation between AC and DC response components. At high sound levels pronounced response saturation is seen.
0270-6474/65/0506-l 591$02.00/O CopyrIght 0 Society for Neuroscience Prtnted in U.S.A.
Response PETER
The Journal of Neuroscience Vol. 5, No. 6, pp. 1591-1608 June 1985
Characteristics
of Mammalian
Hair Cells’
DALLOS
Auditory Physiology Laboratory (Audiology) Evanston, Illinois 6020 7
and Department
of Neurobiology
Abstract Intracellular recordings were made from the low frequency region (third turn) of the guinea pig cochlea. Response characteristics are compared to gross potentials obtained from the organ of Cot% fluid space. Inner hair cells (IHCs) possess relatively low (median, -32 mV) initial membrane potentials, whereas that of outer hair cells (OHCs) is higher (median, -53.5 mV). In response to tone burst stimuli, both cell types produce a combination of AC and DC responses. The latter are depolarizing for IHCs but may be of either polarity for OHCs. In terms of their AC responses, IHCs are about 12 dB more sensitive than OHCs. At low sound levels these cells are more linear than high frequency hair cells (Russell, I. J., and P. M. Sellick (1978) J. Physiol. (Lond.) 284: 261-290), judging from the relation between AC and DC response components. At high sound levels pronounced response saturation is seen. The overall tuning properties of the two hair cell types are rather similar, even though IHCs exhibit low frequency velocity dependence, whereas OHCs are displacement sensitive and the cell membrane time constant is larger for IHCs. In order to fit IHC experimental data it is necessary to assume the presence of an underdamped complex pole above the best frequency. The electrical behavior of the OHC does not disqualify it as a conveyor of auditory information to the central nervous system, even though its primary function may be that of a mechanical effector (evidence summarized by Dallos, P. (1985) in Contemporary Sensory Neurobiology, Alan R. Liss, Inc., New York, pp. 207230).
Explorations of the mammalian cochlea with microelectrodes date back to the early 1950’s (von Bekesy, 1952; Tasaki et al., 1954). In spite of this long history, the acousticolateralis system and, especially, the mammalian inner ear proved remarkably resilient to probing at the cellular level. In fact, until 1977, when the first recordings from Received Accepted
Cochlear
September December
11,1984; Revised 11, 1984.
December
10, 1984;
’ This effort, more than five years in duration, has been helped by several colleagues. The basic technique was developed in collaboration with Ake Flock at the Karolinska Institute. Histological verification of marked cells was accomplished by Ake Flock, Britta Flock, and Mary Ann Cheatham. Technical assistance was rendered by Evan Relkin, Jamie Begelman. and William Lutz. Kyle Dennis, Joseph Santos-Sacchi, and Elizabeth Oesterle took part in various phases of data collection. A. Flock, J. Siegel, S. Echteler, and the reviewers are thanked for therr comments on the manuscript. Research was supported by National Institute of Neurological and Communicative Disorders and Stroke Grant NS08635. Initial development of the project was under the ausprces of a John Simon Guggenheim Fellowship. 1591
and Physiology,
Northwestern
University,
single cochlear hair cells were obtained, all knowledge about the electrophysiology of the cochlea had to be derived from field potentials These were generally recorded with gross electrodes from the vicinity of the cochlea or from its fluid chambers (for an overview of this epoch, see Dallas, 1973a). Although a great deal of valuable information was garnered with these methods, rapid progress of auditory neurobiology was hampered by the difficulty of interpreting gross potential data. During this period physiologists and neurobiologists tended to shy away from studying the cochlea, and much of the pertinent literature was viewed as largely opaque to nonspecialists Reasons for these difficulties may be sought in several factors, The mammalian cochlea is quite inaccessible, is encased in bone, and is highly susceptible to damage. The auditory organs of lower than mammalian orders show a great deal of diversity, and it is not at all clear what information derived from them may be applied to mammalian hearing. Quantification and control of acoustic stimuli were long considered to be difficult. Finally, the complexity of the auditory system as a multistage transducer often made the interpretation of data obtained at a given stage somewhat tenuous, Technical advances and an influx of neurobiologists into the field during the 1970’s revitalized this area of study. The first intracellular recording from a hair cell in the lateral line organ was obtained by Harris et al. (1970). Russell and Sellick (1977) were the first to provide intracellular data from mammalian inner hair cells (IHCs). They followed the initial observations with a series of important papers describing many fundamental properties of high frequency IHCs in the guinea pig (Russell and Sellick, 1978, 1983; Sellick and Russell, 1980; Russell, 1983). Others, also working in the high frequency region of mammalian cochleas, also contributed to the basic understanding of IHC function (Nuttal et al., 1981; Goodman et al., 1982; Brown et al., 1983; Sellick et al., 1983). At the same time, great advances were made in recording from hair cells in submammalian species (for summaries, see Dallas, 1981; Hudspeth, 1983; Weiss, 1984). Progress in recording from outer hair cells (OHCs) has been much slower. The first fragmentary information appeared in 1980 (Dallas and Flock, 1980; Tanaka et al., 1980). Russell and Sellick (1983) reported some data from two cells, and a few preliminary reports have been published (Dallos et al., 1982; Dallos and Santos-Sacchi, 1983). One reason for the sparsity of data from OHCs is the difficulty of obtaining stable recordings from them. The problems are probably related to the situation of these cells within the organ of Corti, on the one hand, and conceivably to their ultrastructural properties, on the other hand. To explain, consider that OHCs are slender cylindrical structures, approximately 6 to 8 pm in diameter and graded in length (from approximately 20 to 60 pm) along the organ of Corti. The cells are supported by the organ of Corti cell matrix only at their apical and basal ends. Their cylindrical surface is entirely free-standing within the fluid space of the organ. It is possible that this configuration hinders electrode penetration through the cylindrical cell surface. In addition, the lateral cell wall may possess unusual morphological
1592
Dallas
characteristics, The thickened and corrugated appearance of the plasma membrane has been mentioned (Smith, 1978), and this membrane contains an unusually high concentration of large partcles when examined by freeze-fracture techniques (Gulley and Reese, 1977). Adjacent to the plasmalemma there is an extensive system of subsurface cysternae which interconnect with the cell membrane with fibrillar material (Smith, 1978; Saito, 1983). These surface properties may make microelectrode penetration difficult. OHCs are of particular interest not only to the specialist in hearing, but to neurobiologists in general. This is the case since this nonneural, epithelial receptor may have hitherto unsuspected, nonreceptor properties, Evidence has been accumulating during the past decade that IHCs, which possess 90 to 95% of afferent innervation (Spoendlin, 1969), may be influenced by the state of OHCs (for summary, see Dallas, 1985b). Motile responses have been attributed to the latter (Flock, 1983; Brownell, 1983). Thus, it is conceivable that OHCs may function as combined receptoreffector systems. Clearly, their electrophysiological properties are of interest. The present paper describes efforts to obtain both inner and outer hair cell data. The material IS based on experiments conducted during an approximately five-year period. Only those data are described that were obtained from the third cochlear turn in guinea pigs, The recording location is tuned to approximately 800 to 1000 Hz and, thus, it is possible to obtain from it both AC and DC receptor potential data at the best frequency (BF). All other mammalian recordings are from the round window region of the cochlea which is tuned to very high frequencies. As a consequence, information on the AC component of the receptor potential is difficult to obtain and quantify near the BF. The present work extends previous results for IHCs to a different region of the cochlea, and it provides the first extensive material on the behavior of OHCs. Materials
and Methods
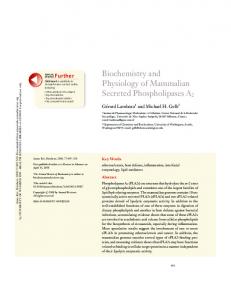
Because of the duratron of this experimental series, various methods and equipment were employed. Thus, during early experiments only tone burst stirnull were avarlable and data were evaluated off-ltne from tape-recorded matenal. Computer-controlled signal generation and data storage were gradually introduced, and most of the quantitative information was gathered in this fashion. Only those paradigms are descrrbed below that produced the majorrty of data described In this paper. Preparation. Young (200 to 400 gm) albino guinea pigs were used as experimental subjects. They were anesthetized with a combination of Nembutal (22 mg/kg) and lnnovar (0.45 ml/kg). Supplementary doses of the two drugs were given hourly in alternatron throughout the experiment. Tracheotomy was performed and the auditory bulla was approached ventrolaterally. All tissue was cleared from the ventral and lateral surface of the bulla, and the external auditory meatus was transected at the level of the bony meatus. The bulla was widely opened and it remained open during the experiment. The middle ear muscles were not disturbed. In order to stabilize the bulla, it was cemented to a metal bar which was attached to the headholder apparatus. The sound delivery tube (including a concentrically placed probetube mrcrophone) was also cemented to the external bony meatus to form a rigid and closed acoustic system. A light guide was placed behind the third turn of the cochlea so that the entrre structure could be transilluminated. An opening in the cochlear bone over the spiral ligament covering of the strra vascularis of the third turn was made by carefully scoring the bone in a rectangular pattern until a bone plate (about 0.3 X 0.5 mm) could be lifted away. Remaining bone chips were gently removed without touching the surface of the spiral ligament. At this stage the silhouette of the organ of Corti could be seen through the fenestra while observing through a stereo operating microscope. Under exceptionally good viewing conditions the Hensen’s cell layer could be seen through the Intact stna vascularis and spiral ligament. During experiments, recording electrodes were introduced into the organ of Corti after first traversing the surface cell layers of the spiral ligament and stna vascularis and passing through the endolymphatic space of the Scala media. In Figure 1 a drawing of the Scala medra space is shown with a schematic indrcatton of the electrode placement and an elaboration on various landmarks. The electrode was advanced with a motorized microdrive (A. B. Transvertex) in controllable step sizes ranging from 2 to 20 pm.
Vol. 5, No. 6, June 1985 sv
OHC
IHC
figure 7. Cross-section of the third turn of the guinea pig cochlea. The recording electrode is shown inserted through the stria vascularis (sv) through a fenestra on the cochlear bone. It was endeavored to insert the electrode parallel to the reticular lamina (rl) and situated just below it. hc, Hensen’s cell; tm, tectorial membrane; ot, outer tunnel; dc, Deiters’ cell; ns, Nuel space; pc, pillar cell; is, Inner sulcus. (Reproduced from Dallos et al. (1982) with permission from the American Association for the Advancement of Science. Copyright 0 American Association for the Advancement of Science.) Electrode position was continuously recorded on a chart recorder, along with the measured DC potential. As a convention, the peripheral boundary of the Hensen’s cell layer was taken as the depth reference, and where such a measure is given, zero indicates this location. Throughout surgery and experimental procedures the animal was kept warm with a hot water blanket. Rectal temperature was measured and maintained at 38.5”C. In some later experiments exhaled COn was also monitored. An electrocardiogram was also obtained from two subcutaneous needle electrodes on the chest, and heart rate was measured. Frequently a round window or an intracochlear first turn Scala tympani electrode was installed in order to monitor the tone burst-elicited compound action potential before and during the experiment. After the opening of the cochlear fenestra the animals were paralyzed (Flaxedil, 5 to 7 mg/kg) and artificially respirated for the duration of the experiment. Upon completion of the experiment the animals were sacrificed with an anesthetic overdose. It has been suggested recently (Bock and Steel, 1984) that albino animals should not be used for auditory research. Albino guinea pigs may have minimally poorer thresholds than pigmented ones, they show more deterioration of hearing with age ana may have central nervous system abnormalities; however, well documented abnormalities in the cochlear function of albino guinea pigs are lacking. Although potential aberrations in peripheral auditory physiology in guinea pigs due to the albino gene are recognized, advantages of using these animals outweigh the (largely unproven) disadvantages. First, at least in the Midwest, it is difficult to procure pigmented guinea pigs. Second, and more important, is our finding that the success rate of making a cochlear fenestra without strial injury is greater in albino anrmals. Finally, pigmentation interferes with the visualization of the organ of Cart during backlighted conditions. Stimuli. Two types of stimulus were used: sequences of tone bursts and pseudorandom noise. Sinusoidal signals with shaped envelopes were generated by a PDP-1 l/34 computer. Signal parameters were menu-controlled with clusters of parameters selectable at the time of the experiment. Typically, tone bursts were 30 msec in duration with 3-msec rise and fall times and 55. msec silent periods between them. Usually 15 different frequencies were produced at five levels each. Any signal condition was repeated a preselected number of times. Thus, low level presentations (0 or 10 dB sound pressure level (SPL); SPL reference throughout this paper is 20 pPa) consisted of 100 repetitions, high level ones (80 or 90 dB SPL) consisted of only 10 repetitions, and other levels in between. The total presentation time of a sequence consumed approximately 4.6 min. SPLs at the eardrum were measured with
The Journal
of Neuroscience
Cochlear
Hair Cell Responses
a probe-tube microphone at the beginning of the experrment over the range of frequencies to be tested and were stored in computer memory. Tone burst presentations were then made so that the computer kept the sound level constant at any frequency. The sound levels used were spaced at 20. dB Increments, usually from 10 to 90 dB SPL. The presentation of frequencies was so ordered that the anticipated BF (800 Hz) was presented first, followed by 200 Hz, and then all other frequencies. The sequence was closed by a repeated presentation of 800 Hz. Responses picked up by the recording electrode were preamplified. lowpass filtered (2000 Hz) with an anti-aliasing filter, analog-to-digital converted, and averaged on-line by the PDP-1 l/34. Averaged responses and identifying and timing information were stored on disks. In later experiments we incorporated an automatic gain control (AGC) system which, after x 500 preamplifrcatron, could add or remove gain in 6-dB increments. At the beginning of a tone burst run, a low frequency, maximum intensrty test stimulus was presented and, on the basis of the response to this stimulus, the AGC system optimized the gain so that the signal size was maximal without saturating the A/D converter. Off-line data evaluation consisted of plottrng out averaged waveforms and performing a fast Fourier analysis on the windowed center portion of averaged responses. Magnitude and phase of the fundamental component and the first five harmonics were computed along with the DC component. A table of values could be printed out and the frequency versus response (with sound level as parameter) plots produced for fundamental and DC components on an incremental plotter. Although tone burst responses generate the most fundamental informatron about harr cells, the collection of a full array of data is very time-consuming. Since lengthy contact with receptor cells does not often occur and, even if it does, changes in response properties with time are often seen, It was necessary to develop a method of obtaining data in a more efficient manner. To this end we adopted techniques using pseudorandom noise stimuli. Specifically, a deterministic ternary noise was generated (Zierler, 1959; Gyftopoulos and Hooper, 1964). This noise has three permissible amplitudes, -1, 0, and +l The noise used consisted of 728 transitions between levels with a samplrng frequency of 6250 Hz. The waveform of a ternary noise sequence, along with a representative response pattern, is presented in Figure 2. Only odd spectral components are produced and these are 17.17 Hz apart. The amplitude spectrum of this noise is shaped with a &x/x envelope; thus, up to the limit set by anti-aliasing (2000 Hz), spectral component magnitudes were essentially constant. Of course, the characterrstrcs of the sound delivery system shape this spectrum. In these experiments the spectrum was flattened either with the use of audio equalizers or by acoustic means so that it varied less than 6 dB between 200 and 1800 Hz. The total duration of the noise sequence is 116.48 msec, and usually 33 sequences were presented without interruption. The first sequence was disregarded; responses to the remaining 32 were averaged by the PDP-1 l/ 34. In this fashion the averaged response represents a behavior which IS free from onset effects. Averages were stored on disk. In later experiments the same AGC system described above was also used with these stimuli in order to maximize signal-to-noise ratios in the recorded signals. Five levels with 10.dB increments were presented in a given experimental run. Off-line analysis consisted of computing Fourier transforms of the averaged data and plotting the amplitude and phase patterns. All frequency response characteristics were corrected by subtracting the (logarithmic) magnitude and (linear) phase spectra of the sound field (also obtained with ternary noise stimulus) from the electrophysiological data. Random noise techniques are fundamentally linear methods (Lee and
I1RESPONSE
1593
Schetzen, 1961) whereas the peripheral auditory system is known to be highly nonlinear. It has been shown that ternary noise signals are insensitive to even-order nonlinearities and may be effectively used to estimate the linear filter characteristics of the system tested (Moller, 1974; Barker and Davy, 1975; Swerup, 1978). It is also possible, by usrng several levels of the noise, to correct for the presence of low order, odd nonlinearities and obtain an accurate estimate of the linear filter (Barker and Davy, 1975). The most important advantage for our purposes is the speed of data collection with the noise paradigm. The presentatron of the entire stimulus sequence and the simultaneous storage of responses consumes only 21 set and generates filter magnitude and phase characteristics at five sound levels. The major disadvantage is that no information is obtained about DC responses. The essential equivalence of hair cell filter characteristrcs at low sound levels (i.e., within the linear response region), as determined by the tone burst and ternary noise methods, can be demonstrated. An example is included in Figure 3. The only data derived from noise techniques that are utilized in this paper are those obtained at low sound levels. These demonstrably represent a valid estimate of the frequency dependence of the response. As a consequence, experimental results pertaining to linear response properties as based on the two methods are comingled in the descriptions to follow. Recording. Electrodes were pulled from 1 -mm-outer diameter glass capillaries containing a microfilament (A. M. Systems, type 6010) for easy backfilling by capillarity. A two-stage gas-jet puller (Brown and Flaming type, Sutter Instruments) was employed. When filled with 3 M KCI or 2 M KAc, tip resistances ranged between 80 and 200 megohms. In early experiments, when cell marking was attempted, the electrodes were pulled from 1 J-mmouter diameter glass (F. Haer Co.) on a vertical two-stage electrode puller (Narashige). These electrodes were dry-beveled. When filled with aqueous solutions of Niagara sky blue, Procion yellow, or Lucifer Yellow, they had resistances between 200 and 500 megohms. Potentials were recorded with a high impedance preamplifier (Mentor, type N950) and displayed on a chart recorder throughout the experiment. Before sending to the A/D converter, the responses were amplified in a passband of 1 to 5000 Hz and filtered for the purpose of anti-aliasing. The preamplifier was equipped with an active bridge circuit to permrt potentral recording and current injection at the same time. By reading the bridge setting after balance, the summed resistance of the preparation and the electrode may be obtained. Electrode tip potentials were balanced on the outer surface of the spiral ligament prior to penetration into the cochlea. The preamplifier was capable of injecting constant, preselected currents through the electrode. Dye marking was accomplished by passing from 1 to 5 nA of negative current. Cell resistances were measured by noting the change in bridge balance setting from before to after penetration. The shortcomings of this method are many; chief among them is the uncertainty that electrode resistance remains constant between the two
I
o
, 1 OTl’I”C,O~-p;;,
Frequency
Figure 2. Top, Electrical signal across the earphone showing the waveform of one cycle of the pseudorandom ternary noise used in these experiments. Bottom, Example of biologic response to this noise.
(kHz)
Figure 3. Comparison of tuning as measured with tone burst and pseudorandom noise stimuli. The example is chosen to represent one level (tone burst = 30 dB SPL and its approximately equivalent noise spectral density) of recording from an IHC for which more complete data are presented in Figure 10. At low levels the equivalence of filter characteristics obtained with the two methods is a general finding.
Dallas
1594
conditions. Because of this drffrculty we have only the most rudimentary informatron on hair cell resistances. Electrode filter characteristics were measured by passing ternary noise current through the electrode via the active bridge circuit. The Fourier transform of the recorded voltage drop was obtained. For the range of electrode resistances utilized in the study, the electrode bandwidth was between 1200 and 1700 Hz under conditions of optimal capacitance compensation. The data were not corrected for the filter effects of the electrodes. Cell identification. Early identification of receptor cells was made on the basrs of dye marking (Dallos et al., 1982). Once familiarity wrth the properties of these cells was established, dye injection was abandoned, inasmuch as this process made a difficult experiment produce even lower yield. At this trme the following means are used for establishing the identity of a cell. Receptor and supporting cells can be distinguished from the magnitude of the response recorded from them. We use BF tone bursts as search stimuli during penetration through the organ of Corti. Typically, in the third turn, this stimulus is at 800 Hz, 50 dB SPL. Response to this tone is approximately equal in Scala media and in the organ of Corf fluids; in supporting cells it is somewhat smaller than in either fluid space, and it is considerably greater (10 to 30 dB) in receptor cells. Thus, one may be able to dtstinguish between receptor and supporting cells without great difficulty. Another distinction is that applied polarrzing currents have no effect on responses recorded from supporting cells, whereas they do influence those obtained from receptors. It is noted that the choice of stimulus frequency for the search stimulus is critrcal. At very low frequencies, for example, the Scala media reference response can be larger than that seen in OHCs and srmilar to that measured rn IHCs. This is due to the differing filter characteristics of these recording locations. Thus, the use of low frequency search stimuli may fail to identify hair cells. In the early stages of this experiment we routinely used 150.Hz search stimuli and surely missed several hair cells because of the uninformed choice. Distinguishing OHCs from IHCs IS based on electrode depth and the sequence of DC potentials seen during the electrode track. Inner hair cells have never been obtained at electrode depths of less than 120 pm. Almost invariably, they are acquired directly in sequence with supporting cells, and advancing the electrode beyond them at distances less than 40 pm usually leads into a fluid space which is assumed to be the inner spiral sulcus. As a rule, OHCs are penetrated at depths less than 120 pm and the approach is from extracellular fluid space. There are exceptions to the above. For example, we have identified OHCs which were entered directly from supporting cells. It is likely in this case that the angle was such that the electrode penetrated the OHC at its base after having passed through a Derters’ cell. The total depth of penetration can rule out IHCs in such a situation. A much more difficult to judge case is when a cell, acquired at greater than 120 pm depth, behaves as an OHC. By behavior is meant membrane potential and stimulus-response relationships that we have learned to identify with OHCs. There are two such cells in our collection. Although it is likely that the large distance results from an oblique angle of penetration into the organ of Corti, these cells are considered unclassified. Some statistics on IHC and OHC depths are collected in Table II.
Results General observations We have described to some extent the sequence of resting potentials seen by a recording electrode during the usual electrode penetration (Dallas et al., 1982). The approach produces a variety of electrical landmarks which, when coupled with electrode depth, provide a fair appreciation of the position of the electrode tip within the cochlear canal. As shown in Figure 1, the electrode is aimed so that it ideally penetrates the organ of Corti parallel with the reticular lamina. During a normal penetration the electrode passes through the stria vascularis and into the endolymphatic space. The penetration through the stria is relatively rapid, and no attempt is made to penetrate strial cells. In fact, we have never done so. If the electrode track is too close to the basilar membrane, then before entering the endolymph one usually encounters a series of intracellular negativities. Several such cells were dye-marked and identified as cells of the spiral prominence. During normal penetration the first departure from zero potential occurs as the electrode tip passes through the stria and registers the endocochlear potential (EP). The magnitude of the EP provides one measure of the condition of the preparation. If the initial EP is less than +50 mV, the animal is not used for
Vol. 5, No. 6, June 1985
substantive data gathering. The median initial EP in this experiment was +67 mV. The EP tended to deteriorate with multiple penetrations of the stria vascularis. The DC recording sequence of a given track may be followed in Figure 4. The EP is encountered at location a and is maintained while the electrode traverses the Scala media space. For a properly aligned electrode this distance is between 100 and 140 pm. Shorter distances are occasionally seen; longer ones tend to indicate a somewhat tangential electrode orientation. Hensen’s cells are first encountered at location b, and the electrode dwells in the Hensen cell layer over distances from 10 to 80 pm, depending on the height of the track above the basilar membrane. It is assumed that if the track traverses the Hensen cell layer over a short distance, then it is probably near the reticular lamina. Hensen cells present very stable membrane potentials. Moving through these cells brings the electrode into the outer tunnel of Corti (position c, Fig. 4). This is recognized by the essentially zero resting potential that characterizes all fluid spaces within the organ of Corti and by the ability to advance the electrode over several-micrometer distances without observing electrode resistance changes which usually signify the encountering of cells. Advancing of the electrode may bring it into contact with an OHC (Fig. 4, position d), and there is occasional success in penetrating one. More often, these cells prove elusive and resist penetration. Further advance through the Nuel space brings the electrode into contact with a presumed outer pillar cell (Fig. 4, position e), inner pillar or inner phalangeal cell (Fig. 4, position f), and IHC (Fig. 4, position g). If the electrode is advanced even further, usually another cell (probably an inner border cell) is seen (Fig. 4, position h), followed by the entrance of the electrode into the inner spiral sulcus (Fig. 4, position i). The identification of this location is made by the rise of the resting DC level to that of the EP. Since it has been reported that the resting potential in the inner sulcus is zero (Manley and Kronester-Frei, 1980) we endeavored to ascertain that in fact these penetrations did terminate in the inner sulcus. In several animals, after obtaining the positive EP at the end of the electrode track, the electrode was withdrawn and the adjacent cell was reacquired and dye-marked. These were identified as inner border cells, indicating that the EP was in fact encountered within the inner sulcus. This sequence is routinely obtained. In other words, if the electrode is at the proper height above the basilar membrane and is advanced far enough, then the inner sulcus (positive EP) may be routinely entered. Manley and Kronester-Frei (1980) argue that the EP is seen in the inner sulcus under abnormal conditions, if the organ of Corti is so distorted that the tectorial membrane (which they regard as the potential barrier for the EP) is dislodged and the space under it thus becomes penetrable to endolymph. We cannot disprove this contention and, if true, the majority of our recordings were collected from abnormal preparations-a conclusion that we like not to believe. Some circumstantial evidence against the notion that the EP in the inner sulcus signifies abnormality is the following. During initial penetrations into Scala media (i.e:: before the electrode ever encountered the organ of Corti), response characteristics and EP were measured. Then the electrode was advanced through the organ into the inner sulcus. There EP and response properties were measured again. Finally, the electrode was withdrawn into the Scala media proper and the measurements were repeated. The three sets of measures were found to be essentially identical. Such a result is difficult to reconcile with the notion that the organ was normal during the first set of measurements and abnormal during the succeeding two. Electrode tracks that are further below the reticular lamina or those not oriented parallel with it may pass through either OHC or IHC regions or may miss the hair cell locale altogether. Certain tracks, presumably passing just under the IHCs, can provide information of an entirely different sort than what is sought in this project. In such situations we have encountered spike activity within the organ of Corti, presumably while the electrode contacted afferent IHC dendrites or nerve terminals. About half a dozen such encounters were
The Journal --j=
of Neuroscience
Cochlear
Hair
Cell Responses
1595
-------_--__
z i
80
1
100
--20
z
--40
= .-
--60
g a
;
60 t 200
- -80
Figure 4. Sample electrode track. Top, Depth of recording electrode in reference to the peripheral border of the Hensen’s cell layer (see Fig. 1 for position of scale relative to the cross-section of the organ of Corti). Bottom. DC potential registered by the electrode as it passes through the cochlear crosssection. These potentials are measured continuously and displayed on a strip-chart recorder. Features at various depths are, as follows: a, electrode enters the Scala media space and encounters the positive EP; b, entry into Hensen’s cell; c, exit from Hensen’s cell and contact with organ of Corti fluid that occupies the outer tunnel; d, brief encounter with an OHC; e, outer pillar cell; f, inner pillar cell or inner phalangeal cell; g, entry into an IHC; h, from IHC into an inner border cell; i, electrode passes into the inner spiral sulcus where the positive EP is once again recorded.
$f
x
--IO0
abed
e
fg
h
i
seen in the third turn and many more in the fourth (including several intracellular recordings from terminals). The majority of spiking neurons responded to sound of the appropriate frequency with short latency, and synaptic potentials could also be detected. These results will be presented in a separate publication. Thus far we have encountered only one neuron producing spike activity that was clearly located in the OHC region. These extracellular spikes were much slower than those seen in the vicinity of IHCs, and there was no apparent responsiveness to sound. We endeavored to measure hair cell resistance by noting the difference between the balance settings of the preamplifier’s active bridge circuit within and outside the cell. Only a limited number of reliable balances could be achieved due to uncertainty of the stability of the electrode resistance itself. The resistance values (see Table II) tend to be low, but consistently higher values are seen in IHCs than in OHCs.
Resting potentials Although stable recordings are frequently seen, the membrane potentials of cochlear hair cells tend to change during maintained contact. Such changes would be considered uninteresting byproducts of differing quality recordings, were it not for the observation that unexpected receptor potential variations may accompany the membrane potential change. Relationships between membrane potential changes and response characteristics are examined in the following paper (Dallos, 1985a). Material presented herein describes optimal recordings from a given cell. However, in many cases repeated measures are not available and, hence, it is not possible to assess whether a given recording is the best that may have been obtained from the cell in question. The initial membrane potential tends to be different for OHCs and IHCs. In Table I the relevant statistics are provided. These indicate that OHC membrane potential is considerably higher than that for IHCs, the respective median values being -53.5 and -32 mV. In previous publications (Dallos et al., 1982; Dallos and Santos-Sacchi, 1983) we reported steady-state values which tended to be different than the measure obtained at initial penetration. In fact, as shown in Table I, the median steady-state membrane potential in OHCs is more negative than the initial value, whereas the opposite trend is found for IHCs.
Membrane
TABLE I magnitude (mV) for initial and steady-state the membrane voltaoe
potential
Initial Value
Med.
UQ”
Steady-state LO
UQ
Med.
values of Value LQ
IHCs
-42
-32 N=30b
-28
-26.5
-20 N=13
-10
OHCs
-65.5
-53.5 N= 28
-38
-75
-71 N=14
-56
a UQ, upper b N, number
quartile; Med., of samples.
median;
Magnitude
LQ, lower quartile.
functions
When measuring responses to tone burst stimuli near the BF of third turn hair cells, one records a combination of AC and DC components. These AC and DC receptor potentials are the intracellular equivalents of the cochlear microphonic (CM) (Wever and Bray, 1930) and the summating potential (SP) (Davis et al., 1950), which are commonly seen with extracellular recording techniques in, and in the vicinity of, the cochlea. On the right sides of Figures 5 and 6, averaged response waveforms are shown, as obtained from an IHC and an OHC in the same organ of Corti. It is apparent from these responses that the DC receptor potential component is positive (depolarizing). At the BF of either hair cell type the response asymmetry is always in the depolarizing direction.’ Aside from the re-
‘Exceptions are abnormal polarity reversals that may be seen during prolonged penetration, as discussed in the companion paper (Dailos, 1985a). In measuring DC responses, more attention was paid to the characteristics of the waveform itself than to the average response component provided by Fourier transformation of that waveform. Specifically, if the depolarizing halfcycles are very peaked whereas the hyperpolarizing ones are broadened, then it is possible to get a net negative average response from Fourier transformation even if the departure from base line is much greater in the depolarizing direction. In such cases the DC component was determined as the difference between the center of the peak-to-peak AC response and the base line. It may be argued that this measure provides a physiologically more meaningful datum of response asymmetry than the true average value supplied by Fourier transformation.
1596
Dallas
800
Vol. 5, No. 6, June 1985
Hz
30
mV
IHC OTll3
co2
I
IO
30
Sound
Pressure
800
Figure 5. Input-output function at 800 Hz for AC and DC receptor potentials from one IHC. Left, Magnitude functions at different sound levels; right, averaged responses corresponding to the data points on the left. Note waveform asymmetries manifested by the DC component and the sharper peaks on the depolarizrng half-cycles. The pronounced afteroscillation seen at 50 dB SPL and above is a consequence of ringing in the sound system. Peak duratron of stimulus was 32.5 msec. Magnitude of AC response represents the peak value of the fundamental component derived from the tone burst responses.
50 Level
I
1
70
90 (dB)
Hz
ac
Figure 6. Input-output function at 800 Hz for AC and DC receptor potentials from an OHC. For description, see the legend to Figure 5.
IO Sound
30
50
Pressure
70 Level
90 (dB)
sponge component for which the frequency is the same as that of the stimulus (fundamental component), Fourier analysis reveals rich harmonic content, particularly at high stimulus levels. In order to study the harmonics, and the concomitant waveform distortion, one needs to examine responses to low frequency stimuli, so that at least the lower harmonics should be within the passband of both the cell membrane filter (Russell and Sellick, 1978; Dallas, 1984) and the recording electrode. The BF of third turn cells, approximately 800 Hz, is such that all harmonics are attenuated by the above filters. Consequently, the waveforms appear more sinusoidal than they really are. The harmonic content and waveform distortion of intracellular responses is discussed in another publication (P. Dallos and E. Oesterle, manuscript in preparation). From averaged waveforms of the type shown in Figures 5 and 6, the magnitudes of the fundamental AC and the DC components may be computed. These values are displayed on the left of Figures 5 and 6. In most cells the AC component increases linearly with sound pressure at low sound levels. However, the displayed cells (Figs. 5 and 6) are among the most sensitive ones in our collection, and even at the lowest levels the growth of the response is nonlinear.
Responses from all cells, IHC and OHC alike, saturate at some modest sound level. Above the input level where departure from linear response increase is discernible, the growth of the response may assume differing characters. Most functions decelerate and the response increases very gradually. In many cases, just as in the example shown, there is an actual decrease in the response at the highest measured levels which never exceed 90 dB. In third turn hair cells the DC response component is less pronounced than the AC receptor potential. In most cases well defined DC responses are seen only above 50 dB SPL. At low sound levels, where discernible, the DC response increases at a rate of 20 dB/iO dB change in sound level (slope of 2). The DC functions also decelerate with increasing sound, and saturation patterns similar to the AC characteristics are seen. Most functions increase at a very slow rate with the growth of sound level, but some, such as the examples shown, actually decrease at the highest levels. To give some indication of the maximum response magnitudes at BF, the following numbers are provided. The median AC response maxima for IHCs and OHCs, respectively, are 11.2 and 4.0 mV peak-to-peak (p-p), whereas the corresponding DC maxima are 3.5
Cochlear
The Journal of Neuroscience
Hair Cell Responses
and 2.6 mV. The largest AC responses at BF are 27 and 14.8 mV p-p for IHC and OHC, and the corresponding maximum DC potentials are 7.5 and 4.1 mV. In many cases largest responses occur not at the cell’s BF but at lower frequencies. The biggest potential we have seen in a third turn IHC is 35.2 mV p-p. In Figures 7 and 8, AC and DC magnitude functions are shown for one IHC and one OHC, measured at three different frequencies: well below BF, well above, and at the BF. The AC magnitude functions may increase linearly at the lowest sound levels, irrespective of signal frequency. Departure from linearity and saturation occurs at the BF at the least intensity. We note in the IHC response that low frequency AC potentials can grow to greater magnitudes than the response at BF. This pattern is further discussed when families of magnitude plots are considered as functions of frequency and with SPL as the parameter. The IHC DC response grows with a slope of 2 at all frequencies when the level is relatively low. In the example shown, these DC functions continue to grow within the range of sound levels studied, in spite of the saturation and decline of the corresponding AC responses. We have seen both patterns, the one shown here as well as the one depicted in Figures 5 and 6, where the DC response declines along with the AC one at the highest input levels. In studying the DC magnitude functions for the OHC shown in Figure 8, we observe that at BF and above, the low level rate of rise of the functions is again 20 dB/iO dB (slope of 2). The low frequency function in the same figure has a much steeper slope around 50 dB SPL. This is due to the fact that the DC receptor potential reverses polarity below this level and becomes hyperpolarizing. Its magnitude at 30 dB SPL is included in the figure. The dual polarity of OHC DC receptor potential deserves additional comments. The negative DC response is seen in OHCs well below the BF and generally at low sound levels. As Figure 9 demonstrates, the DC magnitude function at 150 Hz (with BF = 800 Hz) has two segments. At very low level the response is small and negative; it increases in magnitude and reaches a negative maximum. As level increases the response reverses polarity and then grows monotonically toward larger and larger values. This behavior is analogous to that seen in gross cochlear potentials, in which the SP also undergoes an intensity-dependent polarity reversal of this type (Davis et al., 1958). In general, when measured with the differential electrode technique or from the Scala media-the customary means of obtaining gross cochlear responses-the SP is positive at low sound levels and at frequencies which are well below the BF of the recording site. Here we demonstrate the intracellular response component that appears to be the counterpart of the positive SP. Inasmuch as the intracellular recording is obtained below the level of the reticular lamina, where polarity reversals of the gross responses are known I
I
I
1597
to occur (Tasaki et al., 19.54; Konishi and Yasuno, 1963) our negative response is probably the correlate of the positive component seen in the gross SP. Averaged response traces are included in Figure 9, and they are useful in demonstrating an aspect of the polarity reversal which may be indicative of its mechanism. When high level waveforms are examined (e.g., in Figs. 5 and 9) it is apparent that the AC wave shapes are rounded on the hyperpolarizing phase and peaked on the depolarizing phase. This asymmetry was noted by Russell and Sellick (1983) in first turn IHC responses, and it is also seen in saccular (Hudspeth and Corey, 1977) and turtle cochlear hair cells (Crawford and Fettiplace, 1981). In all of these examples, if the DC response is present, its polarity agrees with that of the peaked phase of the AC response; in other words, both are in the same rectifying direction. If one examines the traces for the two lowest levels in Figure 9, then it is apparent that, along with a reversal of the DC polarity, the waveform asymmetry is also reversed. Here the depolarizing half-cycles are rounded and hyperpolarizing ones are peaked. It appears that two rectifying mechanisms operate in the cochlear mechanics-OHC system in opposite directions, with one dominating at low levels and low frequencies, and the other dominating under all other conditions. Sensitivity In discussing sensitivity, two issues are of importance: first, what response magnitude corresponds to behavioral threshold at the cell’s BF, and, second, what is the sensitivity differential between IHCs and OHCs. Sensitivity is defined here as the SPL at the eardrum that produces a given amplitude of intracellular response. Prosen et al. (1978) found that at a frequency that corresponded to the BF of third turn hair cells (approximately 800 Hz), behavioral auditory threshold was reached between 12 and 22 dB SPL for four albino guinea pigs. The median value for the frequency is approximately 18 dB SPL. In order to relate this datum to our physiological measures, two effects need to be taken into consideration. First, the behavioral data represent free field sound pressures, presumably at the entrance of the ear canal, whereas hair cell responses are obtained with a closed acoustic system where the sound pressure is measured near the tympanic membrane. A knowledge of free field-to-eardrum sound transformation is lacking for the guinea pig. However, considering the length of the guinea pig’s external meatus, its resonance frequency is well above the range which is of interest here. Since the canal resonance contributes the major fraction of the acoustic transformation between free field and eardrum, the entire transformation may be quite negligible around 800 Hz. The second concern is the difference in sensitivity due to the fact that I
I
Figure 7. Input-output functions for one IHC. Left, Peak AC values; right, DC receptor potential magnitudes. Responses are shown at three frequencres: at BF = 800 Hz, well below. and well above BF.
SPL
(dB
re 20,uPa)
1598
Vol. 5, No. 6, June 1985
Dallas I
, IO
30
50
70 90 IO SPL (dB re
I
I
I
I
A: , ?HC,j 30 20
50
70
90
puPa)
Figure 8. Input-output functions for one OHC. Left, Peak AC values; rigght, DC receptor potential magnitudes. Responses are shown at three frequencies: at BF = 800 Hz, well below, and well above BF. In the right graph at 300 Hz, 30 dB, the polarity of the DC response is negative. This point is plotted at its absolute value and is identified by the arrow. If the responses from this OHC are compared to those from the IHC of Figure 7, then it is seen that the former are larger. This is unusual and is due to the fact that data from the most sensitive OHC are illustrated in this figure, whereas the IHC of Figure 7 is only of average sensitivity.
SPL
(dB
re 20pPa)
40 rll+l4l
when the bulla is opened, more acoustic energy is delivered to the cochlea at low frequencies. It is estimated that, at 800 Hz, this differential is 8 to 9 dB (Zwislocki, 1963). As a result, in the open bulla situation the sound pressure at the eardrum that corresponds to behavioral threshold is approximately 10 dB. The median peak AC intracellular response of IHCs at the BF and at 10 dB SPL is 0.2 mV. For the most sensitive animal in the sample, the corresponding value is 1.6 mV. For most animals no DC response can be discerned under such “threshold” conditions, and even for the most sensitive IHCs the DC response is less than 0.1 mV. A comparison of sensitivity of the two cell populations is made on the basis of six animals from which recordings were obtained for both cell types. The most informative comparison may be made if the intracellular response is referenced to that from the organ of Corti fluid space in the cell’s vicinity measured immediately before or after contact with the cell. This sort of comparison corrects for possible changes in the condition of the preparation that may occur between the two intracellular measurements. The resulting median difference is 12.4 dB with a range of 8 to 16.1 dB.
Frequency dependence AC response.
We report the characteristics of AC response magnitudes as functions of frequency and sound level, as determined from measurements of averaged responses to tone bursts. Families of plots for one IHC and one OHC are given in Figures 1 Oa and 11 a. Both sets of plots reveal an overall band-pass characteristic at low sound levels, whereas at high levels the appearance of the plots is best described as low-pass. At the lowest levels the response appears to grow linearly, except near BF, allowing the low level frequency plots to replicate one another after simple compensation for level. This is clearly seen in Figures 10b and 1 lb, where the magnitude functions are normalized by shifting them along the vertical scale to compensate for input level changes. In this mode of plotting, departures from overlap among plots signify the degree of nonlinearity that affects a given response (Rhode, 1971; Dallas,
b.
a.
OHC Figure 9. Input-output functions from an OHC along with averaged response waveforms. The purpose of this figure is to illustrate the level dependence of the nonlinearity that generates the DC receptor potential component. At this low stimulus frequency (150 Hz) low sound levels evoke hyperpolarizing DC responses, whereas high levels generate the more prevalent depolarizing potentials. Note that the waveform asymmetry also shifts: sharpened peaks point toward the direction of the DC potential’s polarity. Response traces are plotted with different gain settings. behavioral experiments are, of course, performed with the auditory apparatus intact, whereas in the hair cell measurements the auditory bulla is widely opened. It is known that the closed bulla functions as a high-pass filter (Mmller, 1963; Zwislocki, 1963). Consequently,
Frequency
C.
(kHz)
Figure 10. Frequency response functions at five sound levels (indicated in decibels of sound pressure level as parameters) from one IHC. a. Peak AC responses. b. Normaltzed AC responses (nor.) obtained by plotting the lowest level function (15 dB) so that its peak corresponds to unity and each successively higher level function by displacing the raw data with a corresponding pattern shifted an appropriate number of decibels. For example, the 50.dB plot is obtained by shifting the 50.dB pattern (from a) down by 35 dB relative to the 15-dB pattern. This mode of plotting is effective in revealing the degree of nonlinearity that affects a given recording. If the system were linear, all plots would superimpose. The more a plot differs from the lowest level response, the more nonlinear the process that generated it. Note that the greatest degree of nonlinearity is seen around BF, where even at 30 dB SPL no superposition obtains. c, DC receptor potentials.
The Journal
of Neuroscience
Cochlear
Hair Cell Responses
b.
Frequency
(kHz)
OHC OT’13 ‘I0
figure 7 7. Frequency response functions at five sound levels from one OHC. Arrangement and details are as in Figure 10. Note, however, that in contrast to the IHC DC responses shown in Figure 10, here the DC potenttal may be either positive or negative, depending on stimulus frequency and level. This figure incorporates some correctrons to the data. At the first two frequencies that were recorded, 800 and 200 Hz, the data are presented as obtained. After the presentation of these two frequencies, the response dropped 4 dB and then remained stable. All data points (except those at 800 and 200 Hz) are raised 4 dB (in the linear response region) or a smaller interpolated amount (in the nonlinear response region) in order that the across-frequency trends may be correctly rendered.
1973b). We note, for both IHCs and OHCs, that departure linear growth occurs contrast, most linear
at lowest behavior
sound is seen
ievels around at frequencies
from
the BF, and in furthest away
from BF. In the linear region IHC functions may be characterized by differing behaviors in different frequency regions. At the lowest frequencies, these constant sound level plots rise with a 12 dB/ octave slope, and, in some cases (not in the example given), flatten out around 300 to 400 Hz. This decrease in slope is generally followed by another steep segment of highly variable rate of rise which culminates in a maximum at the BF. In several examples the flat segment is missing and the secondary rise, often greater than 12 dB/octave, emerges directly from the initial slope. Beyond the BF the magnitude decreases at a steep rate. Quantitative details are provided below, in connecton with referring the responses to their extracellular counterparts from the organ of Corti fluid space. With an increase in stimulus level the responses saturate, especially around the BF, and at the highest levels measured there is actually a decline in response magnitudes at most frequencies. In most cases and as shown, the response is demonstrably more linear as stimulus frequencies depart from the BF toward higher values. The OHC patterns, shown in Figure 11, a and b, also possess the band-pass characteristics at low levels as described above. In fact, most properties, linearity at low stimulus levels, saturation at BF, lesser saturation, and greater maintenance of linearity away from BF, are repeated here. The most clearcut quantitative difference is in the low frequency slope of the linear plots which is 6 dB/octave for OHCs. Other quantitative properties are considered later. As for IHCs, the rate of rise from the 6 dB/octave segment to the BF maximum is highly variable from preparation to preparation. DC response. In Figures 1Oc and 1 lc the DC responses corre-
1599
sponding to the previously considered AC patterns are depicted. The IHC DC receptor potential component is depolarizing at all frequencies and levels. Its frequency dependence is again akin to that of a band-pass filter, particularly at low sound levels. The low level, low frequency slope of these plots is close to 24 dB/octave; the maximum occurs at BF as defined from the AC measurements, and the high frequency drop-off is steep. The OHC DC receptor potential is materially different from that seen in IHCs. As Figure 11 c shows, and as was discussed before, at low levels there is a transition from hyperpolarizing to depolarizing response polarity with an increase in frequency. At high levels the DC component is always positive; in fact, at the highest levels very little frequency dependence may be discerned. The negative response component is always smaller than its positive counterpart at a given sound level. The existence of this negative response, however, produces a greatly enhanced steepness of the frequency plots in the vicinity of the negative-to-positive transition and, thus, makes the “tuning” of the low level DC potentials from OHCs appear exceedingly sharp. Tuning relative to organ of Corti response. Certain advantages accrue from reporting frequency response characteristics relative to those measured in the organ of Corti fluid space. In other words, to depict the decibel difference between magnitudes and the difference between response phases at a given frequency and sound level is more advantageous for assessing certain response properties of the cell than the examination of the raw tuning data. For example, if the inherent frequency-dependent properties of the cell itself are sought, it may be advantageous to eliminate the overall tuning influence of cochlear mechanics. Relative tuning measures are largely free of the latter influence. To a large extent, this measure also eliminates the filtering effect introduced by the recording electrode. Finally, the relative measures yield information about the controlling influence of field currents generated by either cell type upon the extracellular potentials. Such questions have been examined in detail already (Dallas, 1984); only salient features are considered here. Reference measures are taken from the organ of Corti fluid during the same electrode track from which the intracellular response is obtained. The reference measure is from the extracellular space near the hair cell in question. This space tends to be the Nuel space for OHCs and usually the tunnel space near the IHCs as a referent for the latter. In Figure 12 relative AC responses are shown for one IHC and one OHC from the same organ of Corti. Both magnitude and phase characteristics are included. Let us consider the OHC response first, inasmuch as it appears simpler. The magnitude at low frequencies is flat but starts to drop around 1000 Hz. In this particular case the low frequency magnitude ratio is 10 dB, indicating that this OHC produced about 3 times the AC response that could be measured in the adjacent fluid space. The high frequency drop-off signifies that the intracellular response approaches the extracellular one in magnitude as frequency increases. The corresponding phase pattern is consistent with the amplitude plot. There is no phase difference between the intra- and extracellular responses at low frequencies, but the intracellular potential begins to lag that seen outside the cell as frequency approaches and passes 1000 Hz. The IHC response pattern is much more complex. At low frequencies the magnitude increases at a rate of 6 dB/octave vis-&is the extracellular response. This pattern flattens out somewhat below 1000 Hz, to rise again and form a distinct peak around 1200 Hz. Beyond the peak the intracellular response drops quite rapidly when referred to the potentials in the fluid space. The phase leads by almost 90” at low frequencies, and this phase difference is gradually eliminated as frequency is increased. The intra- and extracellular responses are roughly in phase around the cell’s BF. At high frequencies the intracellular response lags the gross response and the lag increases with frequency. In Figure 13 schematic magnitude and phase plots are shown in an attempt to generalize the features of the relative frequency response
Dallas
1600 I
I
I111111
phase data (f,‘). IHC magnitude functions are characterized by an initial rise of slope bp’ terminated by a flat plateau. The intersection of these two is the low frequency cutoff (f,‘). The low frequency phase pattern is a lead which decreases with frequency. The low frequency cutoff (45” lead) may be estimated from the phase pattern as well and is designated as f,‘. The flat amplitude portion gives way to a peak occurring at frequency fb’ and the magnitude of this peak relative to the plateau is B. The absolute level of the plateau itself is designated as C. The latter corresponds to the OHC magnitude ratio, A. The peak at fb’ is followed by a high frequency slope (b,‘). From the phase plot the high frequency cutoff may be estimated (frequency of 45’ lag) as f3’. Finally, zero phase is achieved at frequency f,‘. Estimates for the various quantities are collected in Table II.
I
0
--
-0 00 aa
Vol. 5, No. 6, June 1985
HC re OC
Discussion Overview
0 V
Frequency
(kHz)
Figure 72. IHC and OHC frequency response functions expressed relative to appropriate organ of Corti (OC) potentials measured in the vicinity of the hair cells (HC). Top, Magnitude patterns obtained as the decibel difference between hair cell and organ of Corti response magnitudes at a relatively low sound level. Bottom, Phase differences between intracellular and organ of Corti AC responses. The same recording electrode is used for a given hair cell-organ of Corti response set. (Reproduced from Dallos (1984). Used by permrssion of (0) Elsevier Science Publishers B.V.)
The first recording from cochlear IHCs was accomplished just eight years ago (Russell and Sellick, 1977). Since that time such recordings have been made in at least five laboratories. Although the process is far from being routine, one may expect a reasonable yield of results. Recording from OHCs is an altogether different matter. Fragmentary information appeared in 1980 (Dallos and Flock, 1980; Tanaka et al., 1980) and a preliminary report on the present work followed (Dallos et al., 1982). At this time, at least in our hands and (guessing from the absence of other published work) in the hands of others, recording from OHCs is still an excruciatingly difficult task. Altogether we have recorded from a total of 33 third turn OHCs, the first of which was encountered on March 28, 1978. Since that time we have performed at least 400 experiments to obtain the above yield. It is not unusual to conduct two experiments per week for several months without a single success. Coupled with the paucity of recordings is the uncertain quality of many encounters. Holding times tend to be short and, in many instances, when contact with the cell was maintained for a long period, there was reason to suspect
deteriorated
function.
This paper
attempts
to distill common
trends among more successful recordings. In harmony with other measures of cochlear function, we assumed that sensitivity, response size, and degree of nonlinearity are the best measures of integrity (Rhode, 1980; Khanna and Leonard, 1982). Stable, large (but not excessively large; see Dallas, 1985a) membrane potentials were also assumed to reflect healthy cells. In spite of this care, it is possible that all of our recordings are from suboptimally functioning OHCs. Although this possibility must be admitted, it is noted that in none of the encounters did we observe major qualitative or quantitative departures from the behavior described in this paper. Just as for IHCs, the proof of a correct assessment of intracellular behavior of OHCs should come from its comparison with afferent neuronal activity. Figure 73. Schematic frequency response patterns for IHC (left) and OHC (right) expressed relative to the AC potential in the organ of Corti fluid space near the hair cell. These plots reflect the type of data shown in Figure 12. As developed in a previous publicatron (Dallos, 1984) OHCs are fitted with sample low-pass filter patterns, and IHCs are fitted with a combination of lowpass filter, differentiator, and complex pole. Parameters necessary to describe these filter characteristics can be derived from desrgnated slopes (b), gains (A, B, and C), and characteristic frequencies ( f). Data reflecting these varrables are collected in Table II. characteristics that were just considered. The rationale the particular configurations is introduced in Dallas mentioned under “Discussion;” here certain features
for choosing (1984) and
of these patterns are quantified. It is evident that the OHC-to-organ of Corti response ratio is characterized as a simple low-pass filter. We attempt to quantify the low-frequency magnitude ratio (A), the high frequency (/I,‘) and low frequency (bZo) slopes of the magnitude function, and the cutoff frequency (45’ lag) estimated from the
Unfortunately,
no-one
has accomplished
the task
of record-
ing from OHC afferents as yet. An indirect measure of the integrity of OHC data derives from its comparison with gross response characteristics. As considered below, it is likely that gross responses are largely determined by OHCs. As such the similarity of intracellular OHC data and gross responses from the organ of Cot% bespeaks the conformity of behavior of the OHC in question with the group of its neighbors that produced the gross response. Lest it be misunderstood, it is emphasized that the intracellular response is not a passive reflection of what is seen in the extracellular space. This is attested by its considerably larger magnitude. One may assume that the grave difficulties in recording from OHCs stem from their morphology and relation to the organ of Cot% cell matrix. Whereas IHCs are flask-shaped, approximately 30 pm in length and 8 pm in diameter in the third turn, OHCs, although the same diameter, are about twice the length. Probably more importantly, IHCs are surrounded by supporting cells, whereas OHCs are suspended only at their apices and supported at their bases.
The Journal
of Neuroscience
Cochlear
Hair Cell Responses
1601
TABLE II Various hair cell statistics The first two data columns refer to general properties of the recordings; the remaining columns are organized according to the scheme 13. All of these statistics refer to the relationship between intracellular responses and those recorded from the organ of Corti fluid, Electrode
Depth km) IHCs
OHCs
a UQ, upper
UQ” Med. LQ N
192 185 165 16
UQ Med. LQ N quartile;
90 85 67.5 15 Med.,
median;
Rewtance
(megohms)
Gain (dW A&C
Low Frequency
45’ Lead
0” (Hz) fL
Peak Frequent! I
B
b: & b;
29 25 13 9
26 23.4 18.9 13
+6.6 +6.0 +3.5 14
19 12 9.5 9
15.2 11.7 8.2 13
+0.2 0.0 -1.0 15
LQ, lower quartile;
N, number
Peak ^ tiarn .-. (W
550 340 220 13
900 700 615 15
1350 1200 1000
13
4 3 1 13
depicted
in Figure
Hiah
Frequency Slope 1dBlnctaveI \--,----.-I b: &by
45” Lag (Hz) r:srp
-21 -17.4 -11 12
1550 1400 1225 15
-12 -7.5 -5 14
1450 1250 1000 14
of samples.
Encounter with these cells almost certainly occurs on their extensive lateral surfaces, and it is likely that the cell simply slips away from the recording electrode without penetration. If the cells also possess a contractile mechanism (Flock, 1983) then its activity may exacerbate the difficulty of electrode insertion through the cell wall. The resting input resistance of a small cell can give some indication about its integrity. Saccular hair cells are several hundred megohms (Hudspeth and Corey, 1977) and turtle hair cells are approximately 100 megohms (Crawford and Fettiplace, 1981). The median resistance value for first turn guinea pig IHCs is computed as 89.5 megohms from Russell’s (1983) data, and three cells reported by Russell and Sellick (1978) had resistances of 46, 48, and 61.5 megohms. The input resistance of a cell, assuming no other influences, is inversely related to its surface area. Considering this factor, the measurements of Russell and Sellick (1978) were extrapolated to third turn hair cells, and resistance values of 35.6 and 14.2 megohms were predicted for IHCs and OHCs, respectively (Dallos, 1983). The best IHC and OHC in the present data base possess input resistances of 34 and 15 megohms. From Table II the corresponding medians are 25 and 12 megohms. These numbers suggest that hair cells in the apical region of the mammalian cochlea do indeed possess relatively low resistances. Whether our numbers are unduly deflated by damage to the cells from the penetrating electrode or reflect normal values is difficult to tell. It is likely that some decrease due to damage is incorporated in the median figures. Yet, the general trend toward lower values that those seen in the first turn is probably real, as attested by measures from the best cells. Resting potentials The purpose of this discussion is to indicate a possible explanation for the apparent differences between IHC and OHC membrane potentials. Our IHC membrane potentials may be compared with those measured by Russell and Sellick (1978, 1983). From tables published by these authors one can compute medians of -30 and -35 mV for the 12 IHCs from 1978 and the 18 obtained in 1983, respectively. These values presumably represent steady-state potentials and, as such, they are of larger magnitude than the present median of -20 mV. The difference may indicate that Russell and Sellick (1978, 1983) have achieved higher quality recordings or, possibly, that there is a difference between resting potentials of third and first turn IHCs (Dallos, 1983). Our median initial value of -32 mV is similar to Russell and Sellick’s (1978, 1983) steady-state numbers, and it is not known what the time course of their membrane potentials may have been. OHC resting potentials have been reported by Tanaka et al. (1980) and by Russell and Sellick (1983). From 14 recordings in
OHCs, the former authors found a resting potential range of -5.2 to -29.3 mV. They also indicate that “the intracellular resting potentials in several outer hair cells were found to have a positive polarity” (Tanaka et al., 1980, p. 435). The recordings of Tanaka et al. (1980) appear to have been of very short duration as their electrodes (less than 50 megohms) were probably too large not to have damaged the cells. Russell and Sellick (1983) recorded from two identified OHCs which had membrane potentials of -65 and -70 mV, in the range of our steady-state OHC resting potentials. Considering the variability of membrane potentials and frequently observed changes in their value during the course of recording from a given hair cell (Dallos, 1985a), one may legitimately ask, what is the “real” membrane potential of inner and outer hair cells? Although a straightforward answer is not readily apparent, one can speculate as follows. If only “high quality” recordings are considered, ones in which response size and invariant membrane potentials suggest minimal or no influence by the recording electrode, then some tentative values may be obtained. For IHCs such membrane potential values are -31, -30, -34, -38, and -35 mV. For OHCs such values are -71, -75, and -65 mV. Since membrane potential changes do not appear instantaneously (Dallos, 1985a), one may rely on initial values for guidance. Thus, if one assumes that the top interquartile range represents the better cells, then from Table I the initial values of -42 mV for IHCs and -65.5 mV for OHCs obtain. It may not be unreasonable then to generalize the above and consider, for third turn location, the “generic” IHC resting potential as approximately -40 mV and the corresponding OHC value as -70 mV. A simple circuit model for cochlear hair cells has been presented which has proved useful in explaining the differences between IHC and OHC resting potentials (Dallos, 1983, 1984). The model assumes that either hair cell may be represented by resistances symbolizing the apical (endolymphatic) and basolateral (perilymphatic) boundaries of the cells, and a battery E, which describes the electrochemical potential of the basolateral membrane. It was demonstrated that the voltages analogous to the resting intracellular potentials depend on the ratios of basolateral and apical resting resistances. These ratios were christened “shape factors.” It is possible to tentatively associate shape factors with cellular morphology and thus to postulate that the approximately 5:l ratio of IHC and OHC shape factors is a consequence of the very large basal surface area of OHCs. In descriptive terms one may say that the OHC basolateral surface is “leaky,” with the consequence that the influence of the depolarizing EP is lessened, making the resting potential move in the hyperpolarizing direction. Magnitude functions Response magnitude versus stimulus level, or input-output functions from cochlear IHCs, have been published by Russell and
1602
Dallas
Sellick (1978) Patuzzi and Sellick (1983) Goodman et al. (1982) and Smith et al. (1983). The characteristics of these plots are in good agreement with our data. Thus, all AC plots exhibit an initial slope of unity, followed by a gradual decrease in the slope of the functions. Complete saturation, in other words, the flattening of the plot, or a decline in response magnitude with increasing sound level has not been reported. Admittedly, published AC data are quite fragmentary and, thus, it may not be prudent to assume that there exists a conflict between our third turn data and the published first turn material. A comparison of AC magnitude functions at various frequencies reveals a similarity between present and published data. Thus, departure from linear growth occurs first for the BF plot. For lower frequency inputs the input-output functions frequently grow to larger magnitudes than at the BF, revealing lesser nonlinearity. At higher frequencies the maxima reached by the functions tend to be smaller than at BF. Patuzzi and Sellick (1983) compared IHC inputoutput functions with those obtained for basilar membrane displacement. They concluded that the IHCs exhibit a simple, frequencyindependent, saturating nonlinearity. Thus the frequency-dependent effects seen, for example, in the differing saturation levels of BF and above-BF plots are attributed to the frequency-dependent nonlinearity of cochlear mechanics. Our data reveal no conflict with this notion. DC input-output functions from IHCs have received somewhat more attention in the past. The published characteristics are again in harmony with our findings. As for the AC plots, the DC pattern at BF first departs from the initial slope which in this case is approximately 2. This more rapid growth of the DC component is emphasized by Smith et al. (1983) and studied in detail by Patuzzi and Sellick (1983). Although the early data of Russell and Sellick (1978) are better fitted with unity slopes, it is probably correct to say that more recent material reflects the rapid growth of DC receptor potentials at low sound levels. Such higher slopes are predicted by models that describe receptor potential generation in terms of a polynomial nonlinearity (Molnar, 1974) or by circuit models that utilize parametric excitation (Dallos, 1973a, 1983). At frequencies lower than BF the slope of 2 is maintained at higher sound levels than at BF, but the slope eventually decreases, whereas the response magnitude may rise to higher levels than at BF. In most published examples either at BF or below, complete saturation is not achieved. Smith et al. (1983) in fact emphasize that there is a continued monotonic increase in the DC receptor potential at high levels, albeit at a very slow rate. In our third turn material complete saturation and, in fact, a decline in the response were often noted. Russell and Sellick (1978, Fig. 3A) also published DC input-output functions that clearly show a decrease at high levels. When such decrease occurs is not entirely clear. It is worth noting, both from our material and from that of Russell and Sellick (1978), that the decline in the response can occur at relatively modest sound levels, around 50 to 70 dB. Above BF the DC component behaves in a manner similar to that of the AC response. Both saturate at lesser response levels than the BF patterns. Input-output functions from cochlear OHCs have not been published before. Our data reveal no qualitative differences between AC input-output functions of IHCs and OHCs. The entire discussion above is largely applicable to a description of OHC AC magnitude patterns, including their linear and nonlinear properties. Similarly, input-output functions obtained at or above BF of the OHC are qualitatively similar to those recorded from IHCs; thus, no further elaboration on their properties is necessary. The major difference between DC receptor potentials obtained from IHCs and OHCs is seen well below the BF. Whereas IHC DC responses are always depolarizing in the normal condition, those recorded from OHCs are most frequently hyperpolarizing, at least at low sound levels. This frequency- and intensity-dependent, two-polarity nature of OHC receptor potentials represents a puzzling distinction for this cell class. The result is not entirely unexpected, however. It has often been asserted that the extracellular DC cochlear response, the SP,
Vol. 5, No. 6, June 1985
reflects extracellular currents produced by OHCs (Dallos and Cheatham, 1976). It IS well known that these SPs exhibit either positive or negative polarity, depending on stimulus frequency and level (Davis et al., 1958; Konishi and Yasuno, 1963; Honrubia and Ward, 1969; Dallos et al., 197213). Specifically, at frequencies well below the BF of the gross recording electrode the SP polarity is positive (when measured in the conventional manner from Scala media or with the differential electrode technique) at low sound levels, but turns negative as the input increases. This behavior is clearly the analogue of that seen in recording from OHCs. The polarity reversal between conventional gross recordings and intracellular recordings is a natural consequence of the current flow patterns in the cochlea (Bekesy, 1960; Dallas, 1973a). It is thus reassuring to find that the OHC DC response pattern is indeed similar to the well documented extracellular response, inasmuch as the latter response is thought to be largely produced by the former. Although the DC OHC data from the third cochlear turn are thus consistent with gross recordings, the very existence of DC receptor potentials in OHCs needs to be addressed. Only limited OHC data are published thus far. Tanaka et al. (1980) reported some material obtained from first turn OHCs in the guinea pig. They state that “the DC component is small compared with that of inner hair cells” (Tanaka et al., 1980, p. 437). Russell and Sellick (1983) describe recording from two identified turn one OHCs in the following manner: “In contrast to the receptor potentials of inner hair cells, those from outer hair cells are symmetrical and almost an order of magnitude smaller.” (Russell and Sellick, 1983, p. 202). To unequivocally demonstrate that OHCs exhibit nonlinear behavior, responses to tone bursts are presented in Figure 14 from three dyemarked OHCs. The presence of a DC receptor potential component is unmistakable in all three examples. Explanations for the discrepancies may be sought in different nonlinear behaviors in basal and apical regions of the cochlea, or in conceivable damage inflicted by the recording electrode. The linearization of the response under presumably abnormal conditions is described in the following paper (Dallas, 1985a). Sensitivity Russell and Sellick (1978) estimated that, at the threshold for the compound action potential (AP), an approximately 2-mV DC intracellular response is recorded from IHCs in the first turn. One may estimate the difference between behavioral and AP threshold as 10 to 20 dB (Dallos et al., 1978). Thus, at the threshold of hearing, first API61
5 mV
MY131
3 mV Ll
1
5 mV
Figure 74. Averaged receptor potentials from three dye-marked and identified OHCs. All three clearly show a pronounced response asymmetry and depolarizing DC receptor potential component.
The Journal of Neuroscience
Cochlear
Hair Cell Responses
turn IHCs produce an approximately 0.7- to 0.2.mV DC response. We have seen that our third turn IHCs generate negligible DC responses at threshold; however, the AC receptor potential median is 0.2 mV peak. It may be conjectured on the basis of these numbers that, although the DC potential is the probable agent for transduction in high frequency IHCs (Russell and Sellick, 1978) this role is largely assumed by the AC response for hair cells tuned to low frequencies. Ever since the anatomical distinctions between IHCs and OHCs have been known, theoreticians assumed that OHCs were considerably more sensitive. This was usually attributed to the presumed preferential location of OHCs over the segment of the basilar membrane which undergoes the greatest excursion. This premise is still generally accepted. A variety of experimental results have been used as well to support the notion of greater OHC sensitivity. For example, the compound AP input-output function possesses two segments, a slowly growing one at low sound levels and a rapidly rising segment at high intensities (Davis, 1961). The two segments are separated by roughly 40 dB along the sound pressure dimension. In the clinical electrocochleography and evoked response literature, almost without exception, the lower segment is identified with OHC neural output and the high level segment is identified with IHCs. Behavioral thresholds are also known to rise approximately 40 dB if OHCs are selectively destroyed (Ryan and Dallas, 1975; Prosen et al., 1978). Such data have been frequently misinterpreted by assuming that OHCs mediate hearing over the bottom 40 dB of the audible sound level range, whereas IHCs transduce sound at higher levels. In light of the numerical and morphological disparity between IHC and OHC afferent neurons (Spoendlin, 1969) and considering the electrophysiological results of Russell and Sellick (1978) and the present work, a better approach is to assume that IHC afferents carry the relevant neural information to the central nervous system, but that the operation of IHCs is facilitated at low levels by some influence from OHCs. This notion was espoused by Dallas and Harris (1978). The mechanism of interaction is now widely assumed to be in the form of a mechanical feedback from OHC, via cochlear micromechanics, to IHC input (Mountain, 1980; Wilson, 1980; Siegel and Kim, 1982; Davis, 1983; Neely and Kim, 1983). Frequency response Let us consider the most salient features of the frequency response functions of Figures 10 and 11. Probably the most striking observation is that the response patterns are markedly influenced by the input sound level. The AC frequency response is band-pass at low levels. As sound level increases and the responses saturate, the appearance of the frequency response becomes better characterized as a low-pass filter. This nonlinear behavior has received much attention in the past. The level-dependent change in the shape of the frequency response is clearly present in gross cochlear mechanics (Rhode, 1971) in the gross cochlear potentials (Dallas, 1973b), and in the discharge characteristics of cochlear nerve fibers (Hind et al., 1967). It is not surprising that the nonlinearity is manifested at the hair cell level as well. A comparison between IHC receptor potentials and basilar membrane displacement reveals that the nonlinearities present in the mechanical process are also seen in the hair cell responses, with the addition of a saturation process which is the property of the cellular electrophysiology (Sellick et al., 1983). No matter how it is measured, whether in the mechanics or at different stages postmechanical, the most nonlinear response is seen at the BF. Filter characteristics are best revealed in low level responses, Let us compare the 30.dB SPL plots. Around the BF the IHC AC responses are already significantly saturated and, as a consequence, the AC frequency response pattern appears to have a flattened top. At the lowest level, a clearcut peak emerges at the BF. In comparison, the OHC AC response pattern shows sharper tuning at 30 dB SPL due to the fact that the response is smaller and, at the sound level used, it is not significantly saturated. Other quantitative differences are seen in the slopes of the low and high
1603
frequency skirts of the functions. The low frequency slope of the IHC function is +12 dB/octave, whereas the high frequency slope is approximately -80 dB/octave. The OHC responses decrease at a slower rate at both extremes of the frequency scale, the low frequency slope being +6 dB/octave and the high frequency slope being roughly -60 dB/octave. These differences deserve some comment. When measured at a constant SPL at the eardrum, the expected basilar membrane displacement is proportional to the derivative of the sound pressure (Zwislocki, 1948). As the measured gross AC cochlear response (CM) is known to be proportional to basilar membrane displacement (Bekesy, 1960) data showing a derivative relationship between the microphonic potential and the sound pressure at the drum substantiate the theoretical argument (Dallas, 1970; Weiss et al., 1971; Dallas and Durrant, 1972). Apparently the +6 dB/octave low frequency slope of the OHC frequency response is a direct consequence of this relationship and, once again, indicates that at low frequencies OHCs respond in proportion to basilar membrane displacement. The latter has been shown to grow at a rate of 6 dB/octave with constant sound level (Rhode, 1971). The extra +6 dB/octave rise seen in IHC responses, coupled with the approximately 90” phase lead at low frequencies of IHC potentials over OHC ones (see Fig. 12) may be explained in the following manner. We suggested some time ago that, due to the nonexistent or tenuous coupling between tectorial membrane and IHC cilia, these cells should respond in proportion to basilar membrane velocity (Dallos et al., 1972a). In steady-state frequency response patterns this derivative relationship is manifested by the addition of a +6 dB/octave low frequency slope and phase lead of 90” (Dallos, 197313). These characteristics have been observed in intracellular recordings from basal-turn IHCs by Sellick and Russell (1980) and Nuttall et al. (1981). The present results extend these findings to low frequency IHCs and thus indicate that the velocity dependence of the IHC is a general phenomenon. We have considered before the observation that DC receptor potentials grow at a rate of 20 dB/lO dB with sound pressure, at least at low levels. Another way of seeing this behavior is to scrutinize the low frequency slope of the DC frequency response pattern. This is most profitably done for IHC responses since these are always of the same polarity. It is seen in Figure 1 Oc that the initial slope of the low level DC plots is 24 dB/octave, or exactly double that of the AC plot. This behavior is expected if the DC response is a distortion component, the generation of which is dominated by a quadratic nonlinearity. A comparison of the low level DC patterns in Figures 10 and 11 once again points to the greater magnitude of the IHC response and the greater complexity, due to its dual polarity, of the OHC potential. It is also seen that, because of the existence of the hyperpolarizing response at low frequencies, the dominant positive component around the BF is more sharply tuned for OHCs. It is also clear that, due to the slope differences, the DC magnitude pattern appears to be more sharply tuned than the AC one. The only available mechanical measurements of tuning in the low frequency region of the cochlea are those of Rhode (1980). He obtained amplitude response patterns at constant SPLs in the third and second turn of the squirrel monkey. The actual measurements reflected the displacement of Reissner’s membrane. In Figure 15 Rhode’s (1980) results are replotted in a normalized fashion so that the BFs of the two locations are equated. Also included is the AC plot copied (once again normalized for BF) from Figure 10a. It is clear that Rhode’s (1980) second turn function (with BF = 2500 Hz) is sharper than his third turn plot (BF = 400 Hz). Our IHC response pattern (actual BF = 900 Hz) falls between the two measures of Reissner’s membrane displacement. This comparison is meant to indicate that there are no radical differences between the only available measure of mechanical tuning and our receptor potential data. Exact comparisons are not warranted and are, in fact, tenuous, due to the species differences. Another, probably more quantitative, comparison of tuning may be made with neural response data. In Figure 16 single auditory
Dallas
1604
0.2
0.5
Normalized
I
2
Frequency
Figure 75. Normalized AC magnitude functions from one IHC (0) replotted from Figure 10 and from some mechanical measurements of Rhode (1980). The latter were obtained usrng the Mossbauer method, with the source located on Reissner’s membrane of the squirrel monkey cochlea. Two measurements are shown, one from the second cochlear turn at BF = 2500 Hz (0) the other from the thrrd turn at BF = 400 Hz (A). These bracket our BF = 900 Hz
70
0 “i g
60 50
IO
0 I
0.1
I
III
0.5 Normalized
I
1
I 2 Frequency
Figure 16. Normalized iso-response functions for AC (m) and DC (A) receptor potentials from one IHC, compared to +l SD of a group (N = 39) of auditory nerve fiber FTCs. The latter data were obtained from chinchilla neurons in our laboratory by Dr. Evan Relkin.
Vol. 5, No. 6, June 1985
nerve fiber frequency threshold curve (FTC) data are presented. Standard deviations about the means are shown by cross-hatching for chinchilla auditory nerve fibers measured in this laboratory (E. Relkin, unpublished data). Chinchilla neural FTCs are very similar to those obtained from guinea pigs (E. Relkin, private communication). A guinea pig FTC of the right frequency, based on the data of Evans (1972) almost duplicates the chinchilla median. Our best IHC AC magnitude data are recast in terms of the sound pressure necessary to produce a 2-mV-peak response as a function of frequency, and the resulting graph is included in the figure. It is apparent that the IHC response is within the range defined by the standard deviation about the mean. It is, however, slightly less sharply tuned than the mean neural FTC. It is more than likely that even the most careful manipulations of the cochlea interfere with its function to some extent, resulting in suboptimal recording conditions (Khanna and Leonard, 1982). In our situation, the opening of the cochlear capsule and the introduction of the recording electrode may have produced minimal detrimental effects which are not present during recording from the auditory nerve via the posterior fossa. The following discussion relates to the schematic frequency response functions shown in Figure 13 and the associated data of Table Il. More details on this topic may be found in Dallos (1984). From the vantage point of an intracellular recording electrode, the resistance-capacitance (RC) circuit symbolizing the passive electrical properties of the cell membrane constitutes a low-pass filter. Thus, the ratio of intracellular to extracellular voltages should reflect the characteristics of the RC low-pass filter. In other words, the magnitude ratio should be approximately constant up to the cutoff frequency, f, = %a RC, beyond which it should decrease at a rate of 6 dB/octave. The corresponding phase difference is zero at low frequencies and then tends toward a 90” lag, with the 45’ point occurring at f,. This representation is employed in Figure 13 for OHCs and is seen’ to be adequate when the data of Figure 12 are examined. From Table II we find that the median cutoff or corner frequency is 1250 Hz, representing a membrane time constant of TO = 0.127 msec. The fitting of IHC data by appropriate network elements is less straightforward. One may a priori assume that a low-pass filter representing the cell membrane needs to be a part of the circuit, as well as a differentiator (representing the presumed velocity dependence of IHC input), which in its pure form may be represented as a +6 dB/octave slope and a constant 90” lead. The combination of the differentiator and the low-pass filter is inadequate to match the high frequency behavior of the IHC (Fig. 12). It was found empirically that it is necessary to add yet another element, a complex underdamped pole,3 to match the overall pattern (Dallos, 1984). The combination of these elements then gives the characteristic depicted in Figure 13: low frequency slope of +6 dB/octave, followed by a flattening of the response due to the membrane low-pass filter. The low frequency corner is estimated as about 470 Hz, yielding the membrane time constant of 7’ = 0.34 msec. The effect of the complex pole is 2-fold. It provides the amplitude peak demanded by the data to occur above the BF; around 1200 Hz, and at high frequencies it yields the accelerated decrease of the response in comparison with the OHC cutoff rate. The effect of this pole pair on ‘A complex pole is the mathematical description of a three-element system (e.g., mass-elasticity-damping, or inductance-capacitance-resistance). If the pole is underdamped then it represents an oscillatory system. The frequency domain representation of such a pole is a low-pass filter with a flat, low frequency asymptote, a corner frequency (determined by the reactive elements) beyond which the magnitude asymptotes to a -12 dB/ octave slope. At the corner frequencq the pattern may show a gain, i.e., the magnitude rises above the low frequency plateau. The more underdamped the pole, the larger the gain at the corner frequency. The corresponding phase pattern shows zero phase asymptote at low frequencies and 180” lag at high frequencies. The phase is 90” lag at the corner frequency. The impulse response of such a system is a decaying oscillation.
The Journal of Neuroscience
Cochlear
Hair Cell Responses
the phase characteristics is primarily the addition of extra high frequency lag. Thus, whereas the OHC phase changes from zero at low frequencies to 90” lag at high frequencies, the corresponding change in IHC phase is from 90” lead to 180” lag. Some general considerations It is well to summarize some salient results that emerge from the data, to address a few issues of general consequence, and to touch upon some matters of potential controversy. Comparisons with published results. The data reported here for IHC receptor potentials are essentially in harmony with those obtained by others. Of course, when comparisons are performed, allowances need to be made for the different recording locations of this study and all others. Thus, Russell and Sellick (1978) and Nuttall et al. (1981) recorded from the round window (high frequency) region of guinea pigs, whereas Goodman et al. (1982) did so from the same region in the gerbil. This recording location yields cells for which the BF is above 15,000 Hz. As a consequence of the dual filtering actions of the cell membrane’s low-pass filter and the electrode-stray capacitance low-pass filter, the AC receptor potential around the BF is very small in these high frequency cells. Thus, only within-frequency comparisons are reasonable to make in such preparations, and absolute magnitude information for the AC response is difficult to produce. Because of these constraints much of our knowledge about high frequency IHCs is based on the properties of the DC receptor potential. In our preparation the BF of the cell is within the passband of the recording electrode, and it is less than an octave above the corner frequency of the membrane filter. Thus, the AC component is minimally attenuated around the BF and may be studied in a quantitative fashion. For our low frequency IHCs we find low membrane potentials, in agreement with all other published data. Low frequency AC responses (where comparisons may be made between different recording regions) are of the same order of magnitude here as in the data of Russell and Sellick (1983). Our DC responses, however, are smaller when measured at BF than are those seen in the first turn of the cochlea. This finding is true for even our very best cells in which the AC response is very large. It is parenthetically noted that the harmonic distortion content of the AC responses is quite significant; in other words, the waveform distortion is severe-indicating that the cells’ operation is highly nonlinear. In spite of this, the DC component is smaller than that seen in high frequency cells. It is then possible that there is a longitudinal gradation in the propensity of IHCs to generate DC receptor potential components. The mechanism of this location dependence is not obvious, but its existence may fulfill a need. The severe attenuation of AC responses by the membrane low-pass filter around the BF of high frequency cells largely prevents these potentials from being effective in transmitter release. Thus, there is a need for a DC component to fulfill this role. In contrast, in low frequency cells the AC component itself may serve as an agent of transmitter release and, therefore, the need for a large DC response is somewhat obviated. The growth patterns of AC and DC receptor potentials with sound level are quite similar in these data to those already reported. One interesting difference is the observed continued growth at high levels of the DC response in high frequency cells (Goodman et al., 1982) and frequent findings in the present material of a distinct maximum in the response followed by actual decline at higher levels. This discrepancy may well be due to differing recording locations and, if so, it has implications on the dynamic range of level information transmitted to primary neurons by high versus low frequency IHCs. Tuning properties of third turn IHCs are commensurate with other descriptions of peripheral tuning such as the FTCs of primary neurons. Just as these measures indicate less frequency selectivity than do comparable data for the high frequency region of the cochlea, our tuning is poorer than that obtained in basal turn hair cells. Thus, the well known gradation of tuning as a function of BF is apparently preserved in the intracellular receptor potentials, as is
1605
the general shape of the tuning curves. Thus, low frequency hair cell (or neural) responses do not exhibit the pronounced dichotomy between a sharply tuned tip region and a flat tail segment which is seen for high frequency IHCs (or neurons). An interesting observation is that essentially the same tuning curve is obtained for our IHCs when either AC or DC receptor potentials are used to establish the tuning. Note that the above holds for tuning curves; in other words, for a constant output (response magnitude) criterion (Fig. 16). When response magnitudes are plotted at a constant input (sound level), DC tuning is sharper than AC frequency selectivity (Fig. 10). The coincidence of the AC and DC tuning patterns suggests that these potentials are related by a frequency-independent-type, probably quadratic, nonlinearity. The low frequency behavior of third turn and first turn IHCs is qualitatively similar. In both the Russell and Sellick (1983) data and in the present material, when comparison is made with the organ of Corti electrical response the intracellular response shows a 6-dB/ octave initial slope and approximately 90” phase lead. Thus, the velocity dependence of IHCs is maintained throughout the cochlea. There are some quantitative differences between the two sets of data, however. With increasing frequency the phase lead disappears faster for the high frequency hair cells than for our low frequency ones. The median frequency of 45’ lead is 180 Hz in the Russell and Sellick (1983) data, whereas it is 340 Hz in our material. There is no ready explanation for this discrepancy, but it reflects the differing properties of low-pass filtering in the cell that occurs in addition to the simple membrane filter. To explain, from Russell and Sellick’s (1983) data one obtains a median membrane time constant of 0.34 msec, identical to our estimate (Dallos, 1984). Both sets of data require additional filtering in order to model the amplitude and phase relations of intracellular responses vis-a-vis the organ of Corti microphonic. Russell and Sellick (1983) found it necessary to incorporate an additional simple pole, whereas our data call for a complex pole, the latter being underdamped and at a higher frequency than the corresponding single pole. Russell and Sellick (1983) call attention to the curious finding that at very low frequencies the extracellular response exceeds the intracellular IHC receptor potential. They speculate that under such conditions the extracellular response dominates the transmembrane potential and, hence, transmitter release. Judging from their figures, such conditions arise for frequencies well below 100 Hz. We did not examine responses below this frequency and thus have not observed any situation in which the extracellular response exceeded the intracellular one. However, an examination of the trend in Figure 12 reveals that had we measured responses below 50 Hz, the IHC AC response may have dropped below the extracellular value. This matter is of some importance because electrical interactions between cells have been postulated (Geisler, 1974; Honrubia et al., 1976; Manley, 1978) to explain various facets of cochlear signal processing. The present data indicate that electrical interactions are restricted to extremely low frequencies and thus probably do not play a significant role in establishing the major features of the IHC response. Overall differences in amplitude and phase patterns between the two cell types provide an opportunity to assess their relative contribution to extracellular gross responses. Examination of Figure 12 reveals high correspondence between OHC magnitude and phase patterns and those recorded from the organ of Corti fluid. In the same figure marked dissimilarities are observed between the gross potential and the IHC response. These relationships can be reconciled if we assume that the gross response is largely determined by OHCs. A similar argument may be advanced on the basis of DC receptor potential patterns. It is well known that the gross DC response, the SP, may have two distinct polarities (Davis et al., 1958; Dallas et al., 1972b). It is also known from this work and from that of Russell and Sellick (1978) that the IHC DC response is of a singular depolarizing sign. The present work shows that OHC DC responses may be of either polarity. Again, the simplest assumption
1606
Dallas
that reconciles these data is that OHCs control the extracellular response. On the basis of recording gross potentials from cochleas having selective (either outer or inner) hair cell damage, it was suggested some years ago that OHCs exert greater influence upon gross potentials than do IHCs (Dallos and Cheatham, 1976). On the basis of comparing low frequency IHC responses with gross potentials in the Scala tympani, Russell and Sellick (1983) also conclude that the gross response is controlled by OHCs. Analysis of the cochlea’s electrical circuit also points to the primary role of OHCs in the production of gross potentials (Dallos, 1983). The present results further underscore the essential correctness of this notion. Comparisons between IHCs and OHCs. In the above we have addressed several clearcut differences between the electrical behavior of the two types of cochlear receptor cell. Here the aim is to consider which, if any, of these differences may be significant from a functional viewpoint, and to emphasize certain similarities. A great deal of attention was paid to the generally unequal resting membrane potentials and receptor potentials. In other publications (Dallos, 1983, 1984) we attempted to explain these differences by noting that a single mechanism can account for both. This is the different distribution of membrane resistances between apical (endolymphatic) and basal (perilymphatic) cell surfaces. It was shown that both resting and receptor potential magnitudes depend on the ratio of basal to apical membrane resistances (shape factor). These notions suggest that the significant-appearing discrepanctes between the two cell types are a consequence of their different configurations, but that they do not convey a meaning of functional difference. This is even more so if one considers that calculations indicate that the resting and transducer currents through the two cell, types are very similar (Dallas, 1983). Although the most obvious dissimilarities between IHCs and OHCs, resting and receptor potential magnitudes, may not imply functional dissimilarities, there are other electrical characteristics that suggest certain differences. The first of these is the velocrty dependence of IHCs which is reflected in the low frequency amplitude and phase patterns. The identification of this feature is not new (Dallos et al., 1972a; Dallas, 1973b; Sellick and Russell, 1980; Nuttall et al., 1981) but these results extend its applicability to the low frequency region of the cochlea besides the previously studied high frequency segment. Another difference is the existence of hyperpolarizing DC receptor potentials in OHCs that are evident at low frequencies and low sound levels. Although this finding clearly indicates that some nonlinear mechanisms are not shared by both receptor cells, the functional srgnificance of this generally small potential, which is found only under limited stimulus conditions, is obscure. One unknown of considerable interest is the identity of the complex pole pair that was found necessary to incorporate in the model of the IHC in order to fit its frequency response pattern. The physical basis for this mathematical abstraction may be in voltage-dependent conductances of the hair cell membrane, or alternatively, the complex pole could be related to the mechanical excitation process of the IHCs. Only further research will discriminate between these posstbilities. If the complex pole is the representation of membranebound, voltage-dependent conductances, then its presence signals the first observation of such phenomena in mammalian hair cells. Underdamped (oscillatory) responses have been seen in other hair cell systems, such as turtle cochlear hair cells (Crawford and Fettiplace, 1981) and frog saccular hair cells (Lewis and Hudspeth, 1983) under conditions where an electrical resonance phenomenon is implicated. In these systems the electrical resonance IS the mator contributor to the tuning characteristics of the cells which show gradations in their BFs. The complex pole fitted to IHC data may produce oscillatory response components that are of lesser importance. The reason for this is that the cell’s BF and the frequency of the complex pole do not corncrde. In turtle and frog, mechanically and electrically determined BFs are the same for a given cell. The
Vol. 5, No. 6, June 1985
tuning of cochlear IHCs is apparently dominated by their mechanical input. It may be said, on the basis of data presented above, that IHCs and OHCs have electrical characteristics that share more commonalities than differences. Tuning properties are relatively similar, sensitivity differences are not pronounced, response saturations at high levels are alike, and response phases at BF show only minor divergence. Two of these similarities are first re-emphasized, inasmuch as they represent new and perhaps surprising findings; then the general consequence of the overall similarity is considered. First, recordings from both types of hair cell from the same organ of Corti revealed that IHCs are more sensitive, albeit only by about 12 dB. These observations contradict the established notion that OHCs are the more sensitive ones (von Bekesy, 1970). Second, it has been often suggested that OHCs and IHCs operate in phase opposition (Karlan et al., 1972; Zwislocki, 1975; Honrubia et al., 1976; Pierson and Mmller, 1980). At least for third turn hair cells, this notion is not supported. In fact, around the BF of the cells the phase difference between their receptor potentials is quite negligible. Nowhere within the response range of the cells does the phase differential between them approach 180”. We have reviewed some differences and similarities in the electrical signs of the operation of OHCs and IHCs. It may be argued that the similarities are of a more fundamental nature and that they outweigh the differences. If this is the case, then the argument may be extended to a consideration of function. The similarity of receptor potential characteristics may imply a similarity of some aspects of the cells’ functional behavior. At first glance there is nothing surprising about attributing certain similarities of function to the two cochlear hair cell types. In the context of recent work and thinking, however, the notion requires consideration. There is probably little doubt about the role of IHCs in hearing. Endowed with a rich and punctate afferent nerve supply (Spoendlin, 1969) these cells are the primary link between the cochlea and the central nervous system and, in fact, neurons connected to them may carry essentially all communication- and survival-related auditory information. All available data on the response properties of auditory ascending primary neurons describe the behavior of IHC afferents. There is no proven recording from OHC afferents extant in the literature. Until recently it was even in doubt whether these fibers make central connections (Spoendlin, 1979). They apparently do (Morest and Bohne, 1983) and thus they could convey some information about the auditory environment to the brain. Although this aspect of the OHC’s operation is entirely obscure (due to a lack of recordings from their afferents), evidence is accumulating about their effector role. This evidence is summarized elsewhere (Davis, 1983; Dallas, 1985b), and it is quite compelling in showing that OHCs, via some contractile mechanism, influence the micromechanical environment of the IHCs. It is thus possible, even likeiy, that the primary role of OHCs in the mammalian cochlea is that of an effector. The similarity in response properties between IHCs and OHCs that we presented above suggests that OHCs may have at least the potential to function as receptors as well as effecters. If so, it is conceivable -that their messages to the central nervous system pertain primarily to the signaling of the state of the organ of Corti, aside from reporting on the acoustic input to the cochlea. References Barker, H. A., and R. W. Davy (1975) System rdentifrcatron using pseudorandom srgnals and the discrete Fourier transform. Proc. I.E.E. 722: 305311. Bock, G. R., and K. P. Steel (1984) Use of albino anrmals for auditory research. Hear. Res. 73: 201-202. Brown, M. C., A. L. Nuttall, R. I. Masta, and M. Lawrence (1983) Cochlear inner harr cells: Effects of transrent asphyxra on tntracellular potentials. Hear. Res. 9: 131-144. Brownell, W. E. (1983) Observations on a motile response in isolated outer hair cells. In Mechanism of Hearing, W. R. Webster and L. M. Aitkin, eds., pp. 5-10, Monash University Press, Clayton, Australia. Crawford, A. C., and R. Fettiplace (1981) Non-linearities In the responses of
The Journal
of Neuroscience
Cochlear
Hair Cell Responses
turtle hair cells. J. Physrol. (Lond.) 375: 317-338. Dallas, P. (1970) Low-frequency auditory characteristics: Species dependence. J. Acoust. Sot. Am. 48: 489-499. Dallas, P. (1973a) The Auditory Periphery. Biophysics and Physiology, Academic Press, Inc., New York. Dallas, P. (1973b) Cochlear potentials and cochlear mechanics. In Basic Mechanisms in Hearing, A. Mraller, ed., pp. 335-372, Academic Press, Inc., New York. Dallas, P. (1981) Cochlear physiology. Annu. Rev. Psychol. 32: 153-190. Dallas, P. (1983) Some electrical crrcurt propertres of the organ of Cortr I. Analysis without reactive elements. Hear. Res. 72: 89-l 19. Dallas, P. (1984) Some electrical circuit properties of the organ of Corti. II. Analysis including reactive elements. Hear. Res. 74: 281-291. Dallas, P. (1985a) Membrane potential and response changes in mammalian cochlear hair cells during intracellular recordrng. J. Neurosci. 5: 16091615. Dallas, P. (1985b) The role of outer hair cells in cochlear function. In Contemporary Sensory Neurobiology, M. J. Correia and A. A. Perachio, eds., Alan R. LISS, New York, 207-230. Dallas, P., and M. A. Cheatham (1976) Production of cochlear potentials by Inner and outer hair cells. J. Acoust. Sot. Am. 60: 510-512. Dallas, P., and J. D. Durrant (1972) On the derivative relationship between stapes movement and cochlear microphonic. J. Acoust. Sot. Am. 52: 1263-l 265. Dallas, P., and A. Flock (1980) Comment on “The electrophysiological profile of the organ of Cort~” (G. A. Manley and A. Kronester-Frei) in Psychophysical, Physiological and Behavioural Studies in Hearing, G. van den Brink and F. A. Bilsen, eds., p. 32, Delft University Press, Delft, The Netherlands. Dallas, P., and D. M. Harris (1978) Properties of auditory nerve responses in absence of outer hair cells. J. Neurophysiol. 47: 365-383. Dallas, P., and J. Santos-Sacchi (1983) AC receptor potentials from hair cells in the low-frequency region of the guinea pig cochlea. In Mechanisms of Hearing, W. R. Webster and L. M. Aitkin, eds., pp. 11-16, Monash University Press, Clayton, Australia. Dallas, P., D. Harris, 0. Ozdamar, and A. Ryan (1978) Behavroral, compound action potential, and single unit thresholds: Relationship in normal and abnormal ears. J. Acoust. Sot. Am. 64: 151-157. Dallas, P., M. C. Billone, J. D. Durrant, C. Y. Wang, and S. Raynor (1972a) Cochlear inner and outer hair cells: Functional differences. Science 777: 356-358. Dallas, P., Z. G. Schoeny, and M. A. Cheatham (197213) Cochlear summating potentials. Acta Otolaryngol. SuppI. 302: l-46. Dallas, P., J. Santos-Sacchi, and A. Flock (1982) Intracellular recordings from cochlear outer hair cells. Science 278: 582-584. Davis, H. (1961) Peripheral coding of auditory information. In Sensory Communication, W. Rosenblith, ed., pp. 119-141, John Wiley & Sons, Inc., New York. Davis, H. (1983) An active process in cochlear mechanics. Hear. Res. 9: 7990. Davrs, H., C. Fernandez, and D. R. McAuliffe (1950) The excitatory process in the cochlea. Proc. Natl. Acad. Sci. U. S. A. 36: 580-587. Davis, H., B. H. Deatherage, D. H. Eldredge, and C. A. Smith (1958) Summating potentrals of the cochlea. Am. J. Physiol. 795: 251-261. Evans, E. F. (1972) The frequency response and other properties of single fibers in the guinea-prg cochlear nerve. J. Physrol. (Lond.) 226: 263-287. Flock, A. (1983) Hair cells, receptors with a motor capacity? In HearingPhysiological Bases and Psychophysics, R. Klinke and R. Hartmann, eds., pp. 2-7, Springer-Verlag, Berlin. Geisler, C. D. (1974) Model of crossed olivocochlear bundle effects. J. Acoust. Sot. Am. 56: 1910-1912. Goodman, D. A., R. L. Smrth, and S. C. Chamberlarn (1982) Intracellular and extracellular responses In the organ of Corti of the gerbil. Hear. Res. 7: 161-179. Gulley, R. L., and T. S. Reese (1977) Regional specialization of the hair cell plasmalemma in the organ of Corti. Anat. Rec. 789: 109-123. Gyftopoulos, E. P. and R. J. Hooper (1964) Signals for transfer function measurement In nonlinear systems. In Noise Analysis in Nuclear Systems. United States Atomic Energy Commission Symposium, Series 4, Publrcation no. TID-7679, pp. 335-353, United States Atomic Energy Commission, Gainesville, FL. Harris, G. G., L. Frishkopf, and A. Flock (1970) Receptor potentials from hair cells of the lateral line. Science 767: 76-79. Hind, J. E., D. J. Anderson, J. F. Brugge, and J. E. Rose (1967) Coding of information pertaining to paired low-frequency tones in single auditory nerve fibers of the squirrel monkey. J. Neurophysiol. 30: 794-816.
1607
Honrubia, V., and P. H. Ward (1969) Properties of the summating potential of the gurnea pig cochlea. J. Acoust. Sot. Am. 45: 1443-l 450. Honrubia, V., D. Strelioff, and S. Sitko (1976) Physiological bases of cochlear transduction and sensitivity. Ann. Otol. Rhinol. Laryngol. 85: 697-710. Hudspeth, A. J. (1983) Mechanoelectrical transduction by hair cells in the acousticolateralis system. Annu. Rev. Neurosci. 6: 187-215. Hudspeth, A. J., and D. P. Corey (1977) Sensitivity, polarity, and conductance change in the response of vertebrate hair cells to controlled mechanical stimuli. Proc. Natl. Acad. Sci. U. S. A. 74: 2407-2411. Karlan, M. S., J. Tonndorf, and S. M. Khanna (1972) Dual origins of the cochlear microphonics-Inner and outer hair cells. Ann. Otolaryngol. 87: 696-704. Khanna, S. M., and D. G. B. Leonard (1982) Basilar membrane tuning in the cat cochlea. Science 275: 305-306. Konishi, T., and T. Yasuno (1963) Summating potential of the cochlea of the guinea pig. J. Acoust. Sot. Am. 35: 1448-1452. Lee, Y. W., and M. Schetzen (1961) Measurement of the kernels of a nonlinear system by crosscorrelation. MIT Res. Lab. Electronics Q. Prog. Rept. 60: 118-130. Lewis, R. S., and A. J. Hudspeth (1983) Voltage and ion-dependent conductances in solitary vertebrate hair cells. Nature 304: 538-541, Manley, G. A. (1978) Cochlear frequency sharpening-A new synthesis. Acta Otolaryngol. 85: 167-l 76. Manley, G. A., and A. Kronester-Frei (1980) The electrophysiological profile of the organ of Corti. In Psychophysical, Physiological and Behavioural Studies in Hearing, G. van den Brink and F. A. Bilsen, eds., pp. 24-31, Delft University Press, Delft, The Netherlands. Meller, A. R. (1963) Transfer function of the middle ear. J. Acoust. Sot. Am. 35: 1526-l 534. Meller, A. R. (1974) Use of stochastic signals in evaluation of the dynamic properties of a neuronal system. Stand. J. Rehabil. Med. Suppl. 3: 3744. Molnar, C. E. (1974) Analysis of memoryless polynomial nonlinearities. J. Acoust. Sot. Am. 56: S21(A). Morest, D. K., and B. A. Bohne (1983) Noise-induced degeneration in the brain and representation of inner and outer hair cells. Hear. Res. 9: 145151. Mountain, D. C. (1980) Changes in endolymphatic potential and crossed olivocochlear bundle stimulation alter cochlear mechanics, Science 270: 71-72. Neely, S. T., and D. 0. Kim (1983) An active cochlear model showing sharp tuning and high sensitivity. Hear. Res. 9: 123-130. Nuttall, A. L., M. C. Brown, R. I. Masta, and M. Lawrence (1981) inner hair cell responses to velocity of basilar membrane motion in the guinea pig. Brain Res. 277: 171-174. Patuzzi, R., and P. M. Sellick (1983) A comparison between basilar membrane and inner hair cell receptor potential input-output functions in the guinea pig cochlea. J. Acoust. Sot. Am. 74: 1734-l 741, Pierson, M., and A. Meller (1980) Some dualistic properties of the cochlear microphonic. Hear. Res. 2; 135-150. Prosen, C. A., M. R. Petersen, D. B. Moody, and W. C. Stebbins (1978) Auditory thresholds and kanamycin-induced hearing loss in the guinea pig assessed by a positive reinforcement procedure. J. Acoust. Sot. Am. 63: 559-566. Rhode, W. S. (1971) Observations of the vibrations of the basilar membrane in squirrel monkeys using the Mossbauer technique. J. Acoust. Sot. Am. 49: 1218-1231. Rhode, W. S. (1980) Cochlear partition vibration-Recent views. J. Acoust. Sot. Am. 67: 1696-1703. Russell, I. J. (1983) Origin of the receptor potential in inner hair cells of the mammalran cochlea-Evidence for Davis’ theory. Nature 307: 334-336. Russell, I. J., and P. M. Sellick (1977) Tuning properties of cochlear hair cells. Nature 267: 858-860. Russell, I. J., and P. M. Sellick (1978) Intracellular studies of hair cells in the guinea pig cochlea. J. Physiol. (Lond.) 284: 261-290. Russell, I. J., and P. M. Sellick (1983) Low-frequency characteristics of intracellularly recorded receptor-potentials in guinea-pig cochlear hair cells. J. Physiol. (Lond.) 338: 179-206. Ryan, A., and P. Dallos (1975) Effect of absence of cochlear outer hair cells on behavioural auditory threshold. Nature 253: 44-46. Saito, K. (1983) Fine structure of the sensory epithelium of guinea pig organ of Corti: Subsurface cisternae and lamellar bodies in the outer hair cells. Cell Tissue Res. 229: 467-481. Sellick, P. M., and I. J. Russell (1980) The responses of inner hair cells to
1608
Dallas
basilar membrane velocity during low frequency auditory stimulatron in the guinea pig cochlea. Hear. Res. 2: 439-445. Sellick, P. M., R. Patuzzi, and B. M. Johnstone (1983) Comparison between the tuning properties of inner hair cells and bastlar membrane matron. Hear. Res. 10: 101-108. Siegel, J. H., and D. 0. Kim (1982) Efferent control of cochlear mechanics? Olivocochlear bundle stimulation affects cochlear biomechanical nonlinearity. Hear. Res. 6: 171-182. Smrth, C. A. (1978) Structure of the cochlear duct. In Evoked Electrical Activity in the Auditory Nervous System, R. F. Naunton and C. Fernandez, eds., pp. 3-19, Academic Press, Inc., New York. Smith, R. L., R. D. Frisina, and D. A. Goodman (1983) Intensity functions and dynamic responses from the cochlea to the cochlear nucleus. In HearingPhysiological Bases and Psychophysics, R. Klinke and R. Hartmann, eds., pp. 112-I 17, Springer-Verlag, Berlin. Spoendlrn, H. (1969) Innervation patterns in the organ of Cort in the cat. Acta Otolaryngol. 67: 239-254. Spoendlin, H. (1979) Neural connections of the outer harr cell system. Acta Otolaryngol. 87: 381-387. Swerup, C. (1978) On the choice of noise for the analysis of the peripheral auditory system. Biol. Cybern. 29: 97-104. Tanaka, Y., A. Asanuma, and K. Yanagisawa (1980) Potentials of outer hair cells and their membrane properties in cationic environments. Hear. Res. 2: 431-438.
Vol. 5, No. 6, June 1985
Tasakr, I., H. Davis, and D. H. Eldredge (1954) Exploration of cochlear potentials with a microelectrode. J. Acoust. Sot. Am. 26: 765-773. von Bekesy, G. (1952) D-C resting potentials inside the cochlear partition, J. Acoust. Sot. Am. 24: 72-76. von Bekesy, G. (1960) Experiments in Hearing, McGraw Hill, New York. von Bekesy, G. (1970) Enlarged mechanical model of the cochlea with nerve supply. In foundations of Modem Auditory Theory. J. V. Tobias, ed., Vol. I, pp. 307-341, Academic Press, Inc., New York. Weiss, T. F. (1984) Relation of receptor potentrals of cochlear hair cells to spike discharges of cochlear neurons. Annu. Rev. Physiol. 46: 247-259. Weiss, T. F., W. T. Peake, and H. S. Sohmer (1971) lntracochlear potential recorded with micropipets. III. Relation of cochlear microphonic potential to stapes velocitv. J. Acoust. Sot. Am. 50: 602-615. Wever, E. G., and C. W. Bray (1930) Action currents in the auditory nerve in response to acoustic stimulation. Proc. Natl. Acad. Sci. U. S. A. 16: 344350. Wilson, J. P. (1980) Model for cochlear echoes and tinnrtus based on an observed electrical correlate. Hear. Res. 2: 527-532. Zierler, N. (1959) Linear recurring sequences. J. Sot. Ind. Appl. Math. 7: 3148. Zwislocki, J. (1948) Theone der Schneckenmechanik. Acta Otolaryngol. Suppl. 72: l-76. Zwislocki, J. (1963) Analysis of middle ear function. II. Guinea pig ear. J. Acoust. Sot. Am. 35: 1034-1040. Zwislocki, J. J. (1975) Phase opposition between inner and outer hair cells and auditory sound analysis. Audiology 14: 443-455.