For example, no consideration has been taken into account for properly evaluating the ...... spiking interneurons that receive direct input from exteroceptors.
The Journal
of Neuroscience,
June
1993.
U(6):
2287-2305
Response Dynamics and Directional Properties Interneurons in the Cockroach Cereal System Y. Kondoh,
T. Arima,
J. Okuma,
and
Y. Hasegawa
Honda R&D Co. Ltd., Wako Research Center, Wako, Saitama 351-01, Japan
The response properties and directional receptive fields of nonspiking local interneurons in the cereal system of the cockroach are described. Wind-evoked responses were recorded intracellularly, and then analyzed by means of the Wiener kernel method in which a Gaussian white noise signal was used as a stimulus. Cross-correlation between the response and the white noise signal produced first- (linear) and second-order (nonlinear) kernels that were used to define hrput-output characteristics of the interneurons. Three sets of interneurons were distinguished on the basis of kernel analysis. First, responses in interneurons 101,107, 111, and 203 were characterized predominantly by a differentiating, first-order kernel, which suggests a linear relationship to the stimulus. The amplitude and waveform of the kernel changed with the change in stimulus angle, indicating that these four cells are directionally sensitive. Second, responses in interneurons 102 and 103 were also directionally sensitive but highly nonlinear. The first-order kernel was biphasic, whereas the second-order kernel had an elongated depolarizing peak on the diagonal. The response dynamics were accounted for by a cascade of two filters, a linear band-pass filter and a static nonlinear filter, in which the nonlinearity is a signal compression (or a rectification). Third, responses in interneurons 104 and 201 consist largely of the second-order nonlinear component. The second-order kernel, which had an elongated depolarizing peak or a hyperpolarizing valley on the diagonal, did not show any directional preference. The second-order nonlinearity was dynamic, and could be modeled by a band-pass linear filter-static nonlinearity-low-pass linear filter cascade, where the static nonlinearity is a full-wave rectification. The band-pass filter would simply reflect the mechanical property of cereal hair sensilla, whereas the low-pass filter represents the transfer at synapses between the cereal afferents and the interneurons. The nonlinear response thus explains the difference in the directional sensitivity while the differentiating first-order kernel explains the velocity sensitivity of the interneurons. We show that 101 and 107 respond most preferentially to wind from the left versus right, whereas 102, 103, 111, and 203 respond to wind from the front versus rear. Thus, it is sugReceived Apr. 6, 1992; revised Sept. 21, 1992; accepted Nov. 2, 1992. We are grateful to Prof. K.-I. Naka and Dr. P. Newland for their valuable comments on the manuscripts, and to M. Nasu for his help in computation. We also thank F. Takahashi for his encouragement. Correspondence should be addressed to Dr. Yasuhiro Kondoh, Honda R&D Co. Ltd., Wako Research Center, Chuo 1-4-1, Wako, Saitama 35 l-01, Japan. Copyright 0 1993 Society for Neuroscience 0270-6474/93/132287-19$05.00/O
gested that there are two subsystems responding maximally to wind displacement along two coordinate directions, one for the longitudinal direction and the other for the transverse direction. On the other hand, the full-wave-rectifier nonlinear interneurons are omnidirectional, and thus suggested to code simply the power of the wind displacement. [Key words: nonspiking interneurons, white noise analysis, cross-correlation, directional coding, cereal system, cockroach]
Only in a few systemshave the dynamics of the neuronal elements been examined to model neural coding and nonlinear processingof mechanosensorysignals,and in the insectsthese have concentrated mainly on wind-sensitive hairs on the terminal abdominal appendages,the cerci. Air disturbanceor wind is the essentialcue for eliciting escapebehavior in the cockroach (Camhi, 1980). It is initially detected by filiform hairs on the cerci, which have preferred directions of deflection such that the sensory neurons are excited by movement in only one direction (Dagan and Camhi, 1979; Westin, 1979). The sensory neurons make direct connections with a number of intersegmental interneurons, someof which have large-diameteraxons, referred as cerealgiant interneurons (GIs), and are involved in escapebehavior (Camhi and Tom, 1978; Ritzmann and Camhi, 1978; Camhi, 1980;Camhi and Nolen, 1981). The velocity and directional sensitivities to wind stimuli of the cereal GIs have been extensively studied, and were estimated by analyzing the responsesto a step or sinusoidal changesin wind velocity in terms of the normalized postsynaptic potential area, the spike frequency (or the poststimulus time histogram), and the spike threshold (cricket: Bacon and Murphey, 1984; Kanou and Shimozawa, 1984; Jacobs et al., 1986; Miller et al., 1991; cockroach: Daley and Camhi, 1988; Camhi and Levy, 1989).In such conventional analyses,lessattention has been directed to the dynamics of the cellular processesto encode the cereal input. For example, no consideration hasbeen taken into account for properly evaluating the cerealinput, particularly inhibition. Most of thesestudies,therefore, have determined the receptive fields of the interneurons only in terms of excitatory, or simply the most optimal directions. A popular method used to test the dynamic responseof a system, whether or not it is physiological, is to examine its responseto an impulse or a step.If a systemis linear, its impulse responseallows us to predict the system’sresponseto any arbitrary input. It is, however, not always possibleto obtain a system’simpulse response,especiallyin many mechanosensory systems.Sinusoidal modulation of the stimulus was therefore usedmost often in thesesystems,although the mechanosensory
2288
Kondoh
et al.
l
Response
Dynamics
of Nonspiking
Local
Interneurons
signal naturally varies in a chaotic or a white noise-like fashion for an individual neuron. Wiener kernel analysis using Gaussian white noise as the stimulus is a powerful method by which to examine quantitatively the dynamic responses in such a system. The Gaussian white noise signal contains, as well as an impulse, every possible frequency and all amplitudes, with a Gaussian distribution of signal amplitude, making it the most effective stimulus. Using this analysis, a cellular response is decomposed into a series of orthogonal functionals (Wiener kernels) or filters that are produced by cross-correlation of a generalized input, Gaussian white noise, and the response (Marmarelis and Naka, 1972; Marmarelis and Marmarelis, 1978; Naka et al., 1985). In the cockroach cereal system, we have shown that slow potential (graded) response in a wind-sensitive interneuron of the terminal ganglion can be modeled by a differentiating first-order kernel, suggesting that the response is linearly related to the stimulus wind, and sensitive to the wind velocity (Kondoh et al., 199 la). Computing the kernels by cross-correlation between the wind stimulus and a spike train of the cereal afferents, we have also shown that the cereal receptors act as band-pass filter with peak frequencies of 106 Hz (Kondoh et al., 199 1b). The afferents are thought to be velocity sensitive because of the differential, firstorder kernel. In the present article, we characterize the response dynamics (frequency and gain characteristics) and directional sensitivities of several wind-sensitive, nonspiking local interneurons in the cockroach terminal ganglion by means of the Wiener kernel method. A survey based on intracellular recording and staining has uncovered a great number of wind-sensitive, local intemeurons in the cockroach terminal ganglion (Kondoh et al., 1989) as well as in the cricket (Kobashi and Yamaguchi, 1984; Bodnar et al., 1991) and the locust (Boyan et al., 1989). Some of the local intemeurons are nonspiking, whereas others produce spikes. Of special interest are the nonspiking intemeurons that are shown here to be involved in processing of information from the primary cereal afferents, whereas such nonspiking local intemeurons are usually involved in the control and coordination of motor output in insect segmental ganglia (Siegler, 1984). They normally respond to wind in a graded manner without producing spikes, and are thereby particularly suited to this systematic analysis because the spike process is a highly nonlinear event. From the kernel analysis emerge three sets of intemeurons, one linear and two nonlinear types. We show that the linear interneurons are characterized mainly by differentiating first-order kernels, suggesting they are velocity sensitive. The nonlinear types are modeled by a cascade of a band-pass linear filter, a static nonlinear filter (either half-wave or full-wave rectification), and then a low-pass linear filter (LNL filter cascade). The linear and half-wave rectifier intemeurons are directionally sensitive, and are suggested to respond maximally to wind displacement along one of two coordinate directions, the longitudinal or transverse one.
Materials
and Methods
Preparation. We used adult malecockroaches, Periplaneta americana, takenfrom a laboratorycolony in all experiments.For physiological experiments, wefollowedthe proceduredescribed previously(Kondoh et al., 199 la). Briefly, animals were pinned, dorsal side up, to a corkcovered platform and fixed with beeswax. After exposing the ventral nerve cord and the terminal ganglion, the body cavity was flooded with standard cockroach saline. To provide the appropriate tension to the ganglion, a silver platform was introduced posteriorly between the right and left cereal nerves to support it. A bipolar silver hook electrode
placed under the cereal nerve was used to stimulate the cereal afferents electrically. Stimulation and recordings. Details of the method for stimulating the intemeuron by Gaussian white noise and a sinusoidal wave are given in our previous article (Kondoh et al., 199 la). The stimulus wind was delivered to the animal through a plastic tube 10 cm in length and 5 cm in diameter; the other end of the tube was closed by a loudspeaker with a diameter of 10 cm. The stimulus angle was varied by rotating the wind tube about the specimen in the horizontal plane. The direction, intensity, and phase of air displacement were calibrated with respect to the loudspeaker voltage by means of a displacement transducer attached t 3 the surface of the loudspeaker moving plate. The rising phase of the source signal corresponds to a push of the moving plate toward the specimen, and the falling phase corresponds to a pull. Intracellular recordings were usually made from the neuropilar segment of interneurons during stimulation by Gaussian white noise or sinusoidal modulation of wind. A glass micropipette filled with 0.1 M Lucifer yellow in 0.1 M LiCl at the tip and with 2 M KC1 at the shaft served as an intracellular recording electrode, Electrodes with DC resistance of 150-200 MQ were used. The mean resting potential obtained for some of the intemeurons ranged from -37.7 to -46.2 mV under this condition. For later analysis, stimulus and cell response were stored on magnetic tape using an FM data recorder (A-65, Sony Magnescale Inc.). They were shown to be nonspiking according to a set of physiological criteria established in locust ganglia by Burrows and Siegler (1976). After the recording of neuronal activity, neurons were stained by iontophoretical injection of Lucifer yellow (- 5 nA for 2-5 min). The filled ganglia were then dissected out, fixed in 10% formalin in saline, dehydrated in alcohol series, and cleared in methyl benzoate. The dyefilled cell was viewed on a fluorescence microscope and drawn using a drawing tube. Analysis ofthe response. Cellular responses recorded were first fed to a 16-bit personal computer (PC-98OOVX, NEC, Tokyo, Japan) through a 12-bit analog-to-digital converter (ADX-98H, Canopus Electronics Corp.) at a sampling rate of 2 kHz for 10-20 sec. Data were then transferred to a VAXstation 3 100 computer (Digital Equipment Corp.) on which software for white noise analysis, STAR, was run. The firstand second-order kernels were used to identify the dynamics of the system whose input was the movement of a loudspeaker’s moving plate, and whose output was cell response. For computation of kernels and convolutions, we followed the technique performed on the slow potentials in catfish retinal cells described by Sakuranaga and Naka (1985a,b). The first-order kernel is the first-order cross-correlation between the input, a Gaussian modulation of wind stimulus, and the output, cellular response. The kernel is the best linear approximation of a system’s impulse response. Therefore, if a system is linear, its impulse response can predict the system’s response to any arbitrary input. The secondorder kernel is a function of two time lags, r, and T*, and defines the multiplicative interaction between two impulse responses. The magnitude of the nonlinear response is shown on the third dimension with the contour lines in a two-dimensional plot. In figures, solid lines indicate positive or depolarizing peaks, and broken lines, negative or hyperpolarizing valleys. The kernel unit for the first-order kernel is mV.pm-‘.secl, and that for thesecond-orderkemelismV.pm-*.sec-* for slow potential response. Models were predicted by convolving white noise input with the firstand second-order kernels. Discrepancy between the response and model (kernel prediction) was represented by a mean square error (MSE) between the response and model. The MSE is given as a percentage by computing the ratio of the deviation between the response and the model, and indicates the accuracy ofthe model prediction by the kernels. For example, the MSE for the linear model represents the degree of linearity, that is, the ratio of a linear component in a total response. Detailed algorithms for computing the kernels, model responses, power spectra, and MSEs have been described in Sakuranaga and Naka (1985a) and Sakai and Naka (1987). C’lassQication of interneurons. There is a relatively large number of local and intersegmental intemeurons involved in the cereal system of the cockroach terminal ganglion. Thus, we designated the intemeuron by a three-digit number similar to the designation adopted in the thoracic intemeurons of locust (Robertson and Pearson, 1983) and cockroach (Westin et al., 1988). The first numeral indicates the course of axons in the anterior connective and the location of cell body and dendritic fields. The two subsequent numerals specify the intemeuron within the class. The general classes are 101-l 99 for the bilateral type
The Journal of Neuroscience,
June 1993. f3(6)
2269
Cereal nerve
00 pm
I
-
f
203
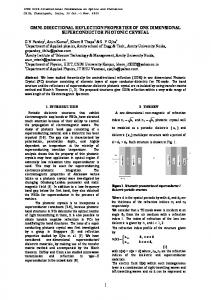
Figure 1. Morphology of a group of interneurons whose wind-evoked responses were linearly related to stimuli. The drawings are of a wholemount of the terminal ganglion, viewed dorsally and with anterior at the top. The smallerdrawingsshow the location of the interneuron within the contours of the ganglion. The brokenline indicates the midline of the ganglion. of local interneurons, 201-299 for the unilateral type of local intemeurons with dendritic fields ipsilateral to the cell body, and 301-399 for the unilateral type of local interneurons with dendritic fields contralatera1 to the cell body. The first numbers of our cells, representing the general classes, do not match those given by Westin et al. (1988). This is because the terminal ganglion lacks the intersegmental interneurons with a descending axon. Thus, the same digit number of a neuron in the terminal abdominal ganglion and in the thoracic ganglion does not indicate that they are serially homologous.
Results Interneurons 101, 107, 111, and 203 The nine uniquely identifiable interneurons examined in this study werecategorizedinto three physiologicaltypes on the basis of kernel analysis. The first type comprisesinterneurons 101, 107, 111, and 203, in which the wind-evoked responsewas found to be linear, and characterized by a differentiating firstorder kernel. Figure 1 showsthe morphology of this set of intemeurons. Interneurons 101 and 107 resembleeach other in morphology as well as in physiology. Both have a small cell body (approximately 20-30 pm in diameter) lying in the ventrolateral cortex of the ganglion and two dendritic arborizations on either side. However, the transverse neurite that interconnects the bilateral dendritic fields is 30-40 pm in diameter for 101, much thicker than that of 107 (about 10 pm in diameter).
Interneuron 111 has a cell body (40-50 pm in diameter) on the dorsolateralcortex of the ganglion,and three transverseneurites intervening the dendritic fields on both sidesof the ganglion. On the other hand, 203 has a 20-pm-diameter cell body near the baseof the cereal nerve and dendritic branchesonly on the side ipsilateral to the cell body. Figure 2 shows polar representations of first- and secondorder kernels in 101, 107, 111, and 203 at various angles.Responsesto white noise evoked in 101 and 107 were almost the samewith respectto their kernel configurations and directional properties. Around the long-axis or midline of the animal, the polarity of the first-order kernel wasreversed (Fig. 2AJ). Wind stimuli directed at ipsilateral (ipsi) 90” and contralateral (cant) 90” had the largest amplitude and were roughly mirror images of each other; the ipsilateral stimulus produced an initial depolarization, whereas the contralateral stimulus produced an initial hyperpolarization. Thus, the linear responseevoked on the opposite side of the animal’s body is equivalent to that evoked by a polarity-inverted stimulus. This is to be expected from a linear system. The mean peak time of the first-order kernel rangesfrom 6.1 msecto 6.7 msec(n = 10) for 101, and from 7.3 msecto 7.6 msec(n = 3) for 107,in preferreddirections. The waveform of the first-order kernel is approximated by a time differential of a brief pulse, indicating that the linear part
Kondoh
et al. - Response
Dynamics
of Nonspiking
Local
Interneurons
1St-order
Figure 2. Polar representations of the first- and second-order kernels in 101, 107, 111, and 203, showing the directional selectivity of the first-order kernel. The two kernels identify the dynamics of a system whose input is the movement of a loudspeaker’s moving plate, and whose output is the cell’s response. The second-order kernel is produced by the nonlinear interaction between two impulse responses, and thereby has two time axes. The magnitude of nonlinear response is shown on the z-axis as a contour. Depolarizing peaks are shown by solidlinesand hyperpolarizing valleys by brokenlines. Orientation of the stimulus is in relation to the body axis of the animal body. For example, 0” represents wind stimulus delivered posteriorly along the long axis of the animal’s body, and 180” represents wind delivered anteriorly. Ipsi 90” represents wind stimulus perpendicular to the long axis and ipsilateral to the cell body of the intemeuron, and Cont 90” represents wind delivered to the cell body. Left column, The firstorder kernels obtained from three or four different animals were superimposed. Note that the waveform of the kernels is reversed in polarity at ipsi 60” and cant 120” in 111 and 302, and at Wand 180”in 101 and 107. Rightcolumn, The second-order kernels.
203
0
kernel
2nd-order
kernel
The Journal
AI
Interneuron
of Neuroscience,
June
1993,
f3(6)
2291
A2
107
0”
Response z 0
Linear model
2nd-order
Stimulus.
model
”
50 ms
B2
lpsi 90”
1
10 Frequency
102 (Hz)
103
0”
1
102 Frequency (Hz) 10
103
Figure 3. A, Intracellular recordings from 107 evoked by white noise modulation of wind (Stimulus) at ipsi 90” (A,) and 0” (A,), and the linear and second-order nonlinear models. When stimulated at ipsi 90”, the linear (first-order) model predicted the actual response quite well. MSEs for the linear and second-order model were 28.2% and 23.7%, respectively. Thus, the linear component comprises a major part of the total response, whereas the second-order nonlinear component comprises a very small part, as it improves the MSE only by 4.5%. At 00, the response was significantly small. MSEs for the linear and second-order nonlinear models were 93.6% and 75.3%, respectively. B, Frequency responses in 107, showing power spectra of the input white noise (Stimulus) and cellular responses; the kernel predicted models are shown for ipsi 90” (B,) and 0” (BJ stimulus.
of response in 101 and 107 is a differential of sensory input, that is, a wind-velocity wave. The function of theseinterneurons as seenby its linear component is to detect the wind velocity. The similar waveform of kernels at all stimulus angles(except their polarity), showsthat although the amplitude (gain) of the linear component differed, the frequency characteristics were invariable irrespective of the stimulus angle. The first-order kernelsin 111and 203 were alsodifferentiating (Fig. 2C,D). In both intemeurons, the first-order kernels were largestin amplitude when the wind stimuluswasat 0”, ipsi 150”, cant 30”, and 180”, that is, when the wind was almost longitudinal to the animal’s long axis. They were very small or noisy when the wind stimulus was orthogonal but somehowdiagonal to the animal’s long axis. The polarity of the kernels reversed at ipsi 60” and cant 120”. Thesewere null directions. The kernels were initially hyperpolarized when stimulated at ipsi 120”, whereasthey showedinitial depolarization when stimulated at cant 60”. The time to the peak ranged from 8.3 to 8.5 msec(n = 2) for 111 and from 7.3 msecto 7.8 msecfor 203 (n = 3) in
the preferred directions. Thus, the peak time of the first-order kernel in 111 wasslightly longer than that in 101, 107, and 203, suggestingthat the responsein 111 was slower. The second-orderkernels in this set of intemeurons were not distinctive. The kernel configurations were considerably different from angle to angle: some kernels had an elongated depolarizing peak on the diagonal, whereasthe others had only offdiagonal valleys (Fig. 2). This was becausethe second-order nonlinear component was very small as indicated by the large MSEs of the second-ordermodel. Figure 3 showsthe responses and modelsto the white noise stimulus in 107 for two different stimulus angles,one for a preferred (ipsi 90”) and the other for a null direction (0’) which were orthogonal to each other. At ipsi 90”, the linear (first-order) component (or model) waslarge and reasonably similar to the responsewith an MSE of 28.2%, whereas the second-order component was much smaller (Fig. 3A,). MSE for the second-ordermodel was 23.7%. As MSE for the second-ordermodel wascomputed betweenthe summation ofthe two modelsand the actual response,the linear and second-
2292
Kondoh
et al.
l
A1
Response
Dynamics
Interneuron
of Nonspiking
Local
Interneurons
111
Response
5 mv, 80 pm 11 2nd-order
model
50 ms
B2-
Linear
models
lpsi 60”
I B32nd-order
2nd-order
models
model
Frequency
(Hz)
Figure 4. A, Intracellular recordings from 111 evoked by white noise stimuli at 0” (A,) and ipsi 60” (AI) corresponding first-order (linear) and second-order nonlinear models. In a preferred direction (O’), the linear model makes a good match with the actual response (the MSE was 37.8%). MSE for the second-order model was 35.4%. At ipsi 60”, MSEs for the linear and second-order model were 94.7% and 87.1%, respectively. B, Frequency responses in 111, showing power spectra of the input white noise (B,), cellular response (B,), and kernel predicted models for 0” and ipsi 60” stimuli (B2 and B,).
order nonlinear components were thought to constitute 7 1.8% and 4.5% of the total response,respectively. Those parts of the responsenot predicted by the linear or second-ordernonlinear componentswere due to noiseor a higher-order nonlinear component. At O“,the linear model was very small (Fig. 3A,). This confirmed our observation that the first-order kernel was very small and noisy when wind was delivered orthogonally to the long axis ofthe animal’sbody (Fig. 2B). Analyses of the response in the frequency domain confirm the observations we made on the kernels and the predictions. The power spectrum of the responsefrom 107 evoked at ipsi 90” always had a peak at 4050 Hz (Fig. 3B,). The linear model wasvery sharply band-passed with a peak at 70-90 Hz, and had power comparableto that of the responsesin a higher-frequency region, whereasthe secondorder nonlinear component was much smaller. It was significantly reduced when stimulated at 0” (Fig. 38,). Figure 4 showsanother example of responsesto white noise and the correspondingmodel predictions, which was from 111 at the stimulus anglesof 0” and ipsi 60”. In contrast to 101 and 107, the linear component for the 0” stimulation was large and reasonably similar to the actual response(Fig. 4A,), while the second-ordernonlinear component wasmuch smaller(Fig. 4A,). MSE for the models suggestedthat the linear component pre-
dieted 62.2% of the total response,whereasthe second-order model predicted only 2.4% of a total response.The power spectra of the responseat 0” and the linear models had a peak at about 70 Hz (Fig. 4B,), indicating that the responseand linear component are band-passed.The power of the linear model was comparable to that of the responsearound the peak, indicating that the high-frequency responseof 111 is almost linear. In a null direction (ipsi 60”), neither the linear nor the second-order nonlinear
model could predict
the response (Fig. 4A,). The MSE
for the second-ordermodel wasat most 87.1%. The linear model at ipsi 60” had a power of 20-40 dB lessthan that evoked at 0” (Fig. 4BJ. This confirmed our observation that for the ipsi 60” stimulus, the interneuron produced no significant response.In both directions, the second-order nonlinear component had a power of 20 dB below that for the actual response(Fig. 4B,). Interneurons 102 and 103 The second type comprisesinterneurons 102 and 103 whose wind-evoked responseswere also directionally sensitive but highly nonlinear. Both interneurons have a cell body with a diameter of 30-40 pm in the dorsal cortex of the ganglion (Fig. 5). Near the midline of the ganglion, the primary neurite loops ventrally to run into the ventral neuropil, where it increasesits
The Journal
of Neuroscience,
June
1993,
f3(6)
2293
Anterior connective
Cereal net&
diameter up to lo-20 Mm. In 102, the main neurite bifurcates into two thick net&es, which then turn medially to form a “(Y-shaped structure and run into the contralateral neuropil, where they give rise to numerous finer processes.By contrast, 103 hasthree thick transverse neurites (20-30 pm in diameter) that run parallel to each other near the ventral surface of the ganglion and connect the bilateral arborizations. Interneurons 102 and 103 produced well-defined first-order kernels that were biphasic with the initial depolarizing or hyperpolarizing phase,asshownin Figure 6. The time to the peak, ranging from 6.9 msec to 7.4 msec(n = 4) for 102 and from 6.8 msec to 7.1 msec (n = 8) for 103, was relatively constant irrespective of the stimulating angles.This value was comparable to those for 101, suggestingthat the frequency characteristics of the linear component are similar to those in 101. On the other hand, second-order kernels from 102 and 103 were very similar to eachother (Fig. 6). The kernelshad an elongated depolarizing peak on the diagonal line where T, = r2 with two off-diagonal valleys at 7, z T*. This configuration wasbasically invariant irrespective of the stimulus angle. The magnitude of the valleys and peaks,however, werereducedwhen the stimulus angleswere ipsi 30” and cant 150”, which was accompaniedby a significant decreasein amplitude of the first-order kernel. Figure 7 showsresponsesfrom 102 evoked by white noise at ipsi 150”and ipsi 60”, and the correspondinglinear and secondorder models. When stimulated at ipsi 150”, the summation (labeled Sum) of the two models accurately predicted the cell’s actual responsewith an MSE of 37.7% (Fig. 7A,). In this recording, MSE for the linear model was 76.3 %. There was therefore a 38.6% improvement in the MSE by adding the second-order model. The power spectrum of the responseand second-order model beganto fall off at 20-30 Hz, whereasthat of
Figure 5. Morphology of a groupof nonlinearintemeurons,vieweddorsally. Brokenline indicatesthe midlineof the ganglion.Anterior is to the top.
the first-order model had a peak at 70-90 Hz (Fig. 7B,). Both of the linear and second-ordernonlinear componentswere very small for the ipsi 60” wind stimulation, where MSEs for the modelswere 93.9% and 80.6%, respectively (Fig. 7AJ. Indeed, they had a power much lower than that of the response(Fig. 7BJ. Interpretation of the nonlinearity in 102 and 103 Figure 8 showstwo examples of the second-orderkernel from 102 at cant 30” and ipsi 150”. The kernels had an elongated, depolarizing peak on the diagonal line (Fig. SA). The kernels generated by 102 and 103 showedthis pattern irrespective of stimulusangle. This was becausethe second-orderkernelswere quadratic for input. In Figure SB, the first-order kernel (solid line) computed from the samerecording asshownin Figure SA, on which the diagonal cut, the side view of the second-order kernel, is superposed (broken line). The first-order kernel is biphasic, whereasthe diagonal cut is monophasic. At either stimulus angle, the hyperpolarization of the first-order kernel was offset by the depolarizing peak of the second-orderkernel. On the other hand, the depolarization of the first-order kernel is enhanced by the diagonal cut. This is a compressionnonlinearity, and implies that the interneuron respondsby producing a depolarizing potential only when wind is directed from the front. This was confirmed by model predictions for 102, asshownin Figure SC. In this recording (stimulated at ipsi 150”) the summationof the linear and second-ordermodels showeda good match with the actual responsewith an MSE of 38% for the second-ordermodel. We note that a hyperpolarization in the linear model was compressedby a depolarization of the second-ordermodel (arrows in Fig. SC).
2294 Kondoh et al.
l
Response
Dynamics
of Nonspiking
Local Interneurons
1 St-order
kernel
2nd-order
kernel
Figure 6. First- and second-order kernels in 102 and 103 at different stimulus angles. All kernels were normalized. In left diagrams, four first-order kernels from different animals were superposed. Note that the waveform of the kernel was reversed at ipsi 60” and cant 120” in 103, and ipsi 30” and cant 150” in 102. When stimulated anteriorly, the interneurons produced the first-order kernel with an initial hyperpolarization. The kernel was, however, initially depolarized when stimulated posteriorly. The second-order kernels shown in the right diagrams here were closely similar to each other, and had a diagonal depolarizing peak with two off-diagonal hyperpolarizing valleys. Unlike the first-order kernels, no directional sensitivity was found in the signature of the second-order kernel.
Interneurons
104, 108, and 201
note that the first-order
The third type comprisesinterneurons 104,108, and 201, whose neuronal structures are shown in Figure 9. The cell body of 104 is approximately 35 pm in diameter and liesin the ventral cortex of the ganglion. The primary neurite arising from the cell body expandsabruptly in diameter over 30 pm and gives off numerous fine processesposteriorly. After crossingthe midline, the primary neurite turns posteriorly and then branchesrepeatedly to form the field of densely packed branches.Interneuron 201 has a cell body with a diameter of approximately 20 pm near the baseof the cereal nerve. The primary neurite bifurcates to extend
two main net&es
anteriorly
and posteriorly.
The an-
teriorly directed neurite runs parallel to the midline for 700800 pm to terminate, whereasthe posteriorly directed neurite subsequently turns anteriorly and ventrally to run along the ventral edgeof the neuropil, forming a denselypacked dendritic field. Interneuron 108 hasa cell body with a diameter of 20-30 pm lying laterally in the dorsal cortex of the ganglion. The primary neurite runs medially before turning sharply in a ventrolateral direction at a point 100 pm from the midline, and then bifurcates in a T-shape to send two major neurites anteriorly and posteriorly. They are further subdivided into two thick neurites that sendout numerous brancheson both sidesof the ganglion. Figure 10 showsfirst- and second-orderkernelsproduced by stimuli delivered at various anglesfor 104, 108, and 201. We
kernels were very small or noisy in any
stimulus direction. The second-orderkernels did not show any directional preference;the 12 kernelswere very similar in their signature aswell as in their magnitude. The kernelsin 104 had an elongated hyperpolarizing valley on the diagonal line (Fig. lOA), whereasthose in 108 and 201 had a depolarizing peak (Fig. IO&C). Both kernels also had two off-diagonal valleys in 201 and 108, and two off-diagonal peaks in 104. Thus, this kernel pattern closely resemblesthat seenin 102 and 103. Figure
11 shows a typical example
of responses in 104, which
was evoked by white noise and sinusoidal of wind delivered along the long axis of the animal’s body. The wind stimulus usually produced a hyperpolarization in 104. The second-order model matched well with the actual response,whereasthe firstorder (linear) model wasvery small (Fig. 11A). Indeed, the MSE for the linear model was 98.9%, whereasthat for the secondorder modelswas 42.7%. Thus, there was 56.2% improvement of MSE after adding the second-ordercomponent. Figure 11C showsthe power spectraof the input white noiseand responses at two different angles(ipsi 90” and 0’). The second-ordernonlinear component had a power comparable to that of the responseat O”, whereasthat of the linear component was much smaller (Fig. 1lC,). A similar observation was made at the stimulus angle of ipsi 90” (Fig. 11C,), confirming our observation that the responsein 104 was omnidirectional. In Figure 1lB, the linear and second-order models were also predicted
The Journal
AI
Interneuron
A2
102
of Neuroscience,
June 1993. 13(6) 2295
lpsi 60”
Response E 0
Sum
(lst+2nd)
Linear
model
2nd-order
Bl
B2
65 B c?
model
-
lpsi 60”
hesponse 2nd-order
\ Stimu’us
model
$ 6 a
I
I
1
10 Frequency
102 (Hz)
103
1
10 Frequency
10’ (Hz)
103
Figure 7. A, Intracellularrecordingsfrom 102to white noiseat ipsi 150”(A,) andipsi 60” (A,), and the corresponding first- and second-order
models.At ipsi 1SO’,the summationof the first- andsecond-order modelpredictedthe cell’sactualresponse very well. The MSEsfor thesetwo modelswere76.3%and37.7%at ipsi 150”,and 93.9%and80.6%at ipsi 60”,respectively.The summationtrace(Sum)wasproducedby summing the linear and second-order nonlinearmodeltraces.B, Frequencyresponses in 102,showingpowerspectraof the responses; kernelpredicted modelsareshownfor 150”(B,) andipsi 60” (B,) stimulus. by convolutions of the input sinusoidalsweepwith the secondorder kernels. The second-order model as well as the actual responsehad a hyperpolarizing trend at 70-100 Hz. Although the power spectrum for the responseshoweda low-pass filter nature, the interneuron produced no significant responseat a lower frequency range. We also note that the power spectrum of the responseis beyond the frequency range of the stimulus. This is consistent with our observation that 104 showsa frequency-doubling responseto a sinusoidal wave (Fig. 1lB; see also Fig. 12C). The electrical stimulation of the cereal nerves on the ipsilateral side evoked a hyperpolarization that was 810 mV in amplitude with a latency of 2.5 msec(Fig. 11D). The stimulation on the contralateral side elicited a small (2-3 mV) depolarization with a latency of 1.5 msec, which was followed by a hyperpolarization. Responsesin 108 and 201 were very similar to each other, and were reasonablywell predicted by the second-orderkernel. Figure 12A shows a typical example of the responsein 201, which was evoked by white noise modulation of wind. MSEs for the linear and second-ordernonlinear models were 99.0% and 42.4%, respectively. Frequency characteristics of the responseevoked in 108 and 20 1 were nearly the sameas in 104
(Fig. 12B). The power spectra of the white noise-evoked responsehad their cutoff frequency at 20 Hz (Fig. 12B,). The second-order model had power almost comparable to that of the response(Fig. 12B,,B,), whereas the linear model had a power of 20-40 dB lessthan the actual response,indicating that the linear component comprises only a minor part of the response.In this type of interneuron, a frequency-doubling responsewas substantial when stimulated by a sinusoidal wave at a higher-frequency range (Fig. 12C). This wasexpected from the fact that the wind-evoked responsesin 104 and 201 were bestapproximated by the second-orderkernel, a squaringfunction.
Modeling of the second-order nonlinearity Figure 13 showsa diagram of the generation of the second-order kernel in a 201 interneuron, which has a characteristic threebar structure with an elongateddepolarizing peakon the diagonal and two off-diagonal hyperpolarizing valleys. The second-order nonlinearity was reproduced by a filter cascadeof Korenberg type (Korenberg and Hanter, 1986). The arrangement was a linear (band-pass)filter followed by a static nonlinearity (square) and a secondlinear (low-pass)filter (Fig. 13A). White noiseinput
2296
Kondoh
et al. * Response
Dynamics
of Nonspiking
Local
Interneurons
was initially passedthrough a band-passfilter. In this case,the input was convolved with a parallel cut of the second-order kernel that was usedasa band-passfilter (Fig. 13B). The bandpassfilter’s output wassquared,and then passedthrough a lowpasslinear filter (Fig. 130). The cascademodel was then crosscorrelated againstthe original input to compute a second-order kernel. The two kernels, one from 201 (Fig. 13B) and the other synthesized (Fig. 13C), are very similar, consistingof an elongated depolarizing peak with two off-diagonal valleys. The squared output is therefore a reproduction of 201’s response. Indeed, the second-order model to a sinusoidal wave had a secondharmonic at high-frequency range.
Cont 30”
end-order
kernel
Tau (ms) Response
2nd-order
Directional responsecurves MSE for a kernel prediction representsthe ratio of the deviation againstthe actual response,and thereby evaluates the accuracy of the kernel prediction. Thus, plots for MSEs on the polar ordinate allow us to draw directional responsecurves for the linear and nonlinear part of the response,asillustrated in Figure 14. In 101, 107, 111, and 203, the linear component is directionally sensitive, and comprisesabout 60%of the total response at least for 101, 107, and 111 in preferred directions (i.e., the first-order model had an MSE of lessthan 40%) (Fig. 14A). It forms two responserangesthat are symmetrically arrangedacross the null directions (0” and 180” for 101 and 107, and ipsi 60” and cant 120” for 111 and 203). On the other hand, the secondorder component contributes only a few percent to improve MSE regardlessof the stimulus angle. The plots from 102 and 103 show that both first- and second-order components are directionally sensitive, and each comprises20-30% of the total responsein a preferred direction in those interneurons (Fig. 14B). Moreover, the first-order component has two response ranges approximately quadrant, which are symmetrically arranged acrossnull directions, ipsi 60” and cant 150”. The directional curves in 104, 108, and 201 show that responsesin these interneurons are omnidirectional, and that the secondorder component comprisesa major part (50-60°/9)of a total response(Fig. 14C). The linear component is minor, as suggestedby MSEs for the first-order model, which were 90-95% on average.
Discussion
model
V
5
ms
Figure 8. A, Contour plots of second-order kernels from 102 when stimulated at cant 30” and ipsi 150”, on which the diagonal cuts of the kernels were superimposed. The kernel had an elongated depolarization peak on the diagonal with two off-diagonal valleys. B, The diagonal cuts at the second-order kernels at 180” (left) and 0” (right)are shown by the broken lines. The figure also shows the first-order kernels from the same cell (solidlines)and the summation traces (broken lines), which were produced by summing the trace of the first-order kernel and that of the diagonal cut. Note that the hyperpolarizing peak of the first-order kernel was offset by the depolarizing peak of the second-order kernel; this is a compression nonlinearity. C, A part of the record, the response trace and its linear and second-order models in Figure 7A,, is expanded. Note that a hyperpolarization of the first-order model, indicated by arrow, was opposed by a depolarization of the second-order model. The summation traces suggest that the interneuron produces a depolarizing potential only when a wind is directed from the head to tail.
Three setsof nonspiking local interneurons are recognized on the basisof the kernel analysisin the terminal ganglion of the cockroach. The first group, in which the responsedynamics are characterized mainly by differentiating first-order kernels, includes interneurons 101, 107, 111, and 203. The second, in which the wind evoked responseis best approximated by the summation of the first- (linear) and second-order models, includes interneurons 102 and 103, while the third, in which the responseis best approximated by the second-order model, includesinterneurons 104, 201, and 108. Thus, responseto wind in the first group is linear, whereasthosein the latter two groups are nonlinear. Some of them have dendritic arborizations on both sidesof the ganglion, and others only on one side. No morphological correlation to the physiological classificationof interneurons hasbeenrevealed. For example, 203 is physiologically of linear type whereas 201 is of nonlinear type, although these two interneurons occupy similar dendritic fields within the ganglion. In insect segmentalganglia, spiking local interneurons are largely responsiblefor the local processingof primary sensory
The Journal
of Neuroscience,
June
1993,
f3(6)
2297
1
s
Anterior connec
2
Cereal nerve
Figure 9. Morphologyof the othertype of nonlinearinterneurons, vieweddorsally.Broken line indicatesthe midlineof the ganglion.
inputs whereasnonspiking onesplay a major role in the control and coordination of motor output (Siegler, 1984).For example, spiking local interneurons in the metathoracic ganglion of the locust receive inputs directly from afferents of hairs and campaniform sensillain a way such that a particular region on the surfaceof a hind legis mappedonto theseintemeurons(Burrows and Siegler, 1985). They make direct inhibitory connections onto premotor, nonspiking local intemeurons on which intraand intersegmentalinput converges(Sieglerand Burrows, 1983; Burrows, 1987).Nonspiking local intemeuronscontrol the pools of motor neurons required for the different patterns of limb movement (Burrows, 1980). However, in the cockroach, we showed that sensory input from cerci is processedby many nonspiking local intemeurons, as it is in the cricket (Kobashi and Yamaguchi, 1984; Bodnar et al., 1991)and the locust (Boyan et al., 1989).
Code for the stimulus direction Figure 15 summarizesthe results showing the organization of wind receptive fields of the nine nonspiking local intemeurons. Polar plots of MSE for the models revealed bilobed directional responsecurves for 101, 107, 111, and 203. The first-order kernel in a given direction was the mirror image of that in the opposite polar direction. The polarity reversal occurred along the midline of the animal for 101 and 107, and roughly orthogonal to the midline for 111 and 203. Thus, 101 and 107 must be excited on the ipsilateral side and inhibited on the contralateral side,while 111and 203 must be excited by a wind roughly from the rear and inhibited from the front. Cells 102
and 103 are also directionally sensitive, being excited in one direction but receiving no or weak inhibition in the other direction (as suggestedin Fig. 8): 102 is excited by a wind from the rear, and 103, by wind from the front. On the other hand, intemeurons 104, 108, and 201 are omnidirectional, being excited or inhibited in all directions. The pattern of directional sensitivity in some of these intemeurons are closely similar to thoseof someGIs (Westin et al., 1977). For example, GIs 1 and 2 are omnidirectional, as are 108 and 201, being excited in all directions, while GI 3 respondsto wind from in front of the animal, just asdoes 103. The selective projections of those hairs onto theseintemeurons would account for their directional sensitivity. Almost 220 wind receptive hairs (filiform sensilla)on an adult cercus are organized spatially into columnsand rows. Each of the 19 cereal segmentsof the adult has a row of nine hairs, except for the segmentsnear the tip and base,which rangefrom 0.5 to 1 mm in length (Nicklaus, 1965). All hairs of a given column have the sameoptimal wind directions that differ from column to column (Dagan and Camhi, 1979). Daley and Camhi (1988) showed that GIs 1 and 2 receive excitatory inputs from the sameset of ipsilateral sensory neurons, that is, those of all nine sensory columns, while GI 3 receives excitatory input only from ipsilateral columns d, f, g, i, and k, all of which have their optimal excitatory directions within the boundariesofthe responsecurve ofGI3. The cockroach respondsto wind stimulus with an escapethat begins with a rapid directional turn, and runs away from its predator (Camhi and Tom, 1978; Camhi, 1980). Sevenpairs of
2299
Kondoh
et
al.
l
Response
Dynamics
of Nonspiking
Local
lntemeurons
1St-order kernel
c
180"
/+-,a b//I
kernel
A-
108 --
Figure 10. Polar representations of first- and second-order kernels in 104. 108, and 201. All kernels were nor: malized. In left column, four kernels from four different animals were superimposed at each stimulus angle in 104 and 201, and three kernels in 108.
end-order
-‘-xl--
\ ‘I\
-
-=&L--
GIs have been suggestedto elicit this directional escaperesponse:electrical stimulation of individual GIs elicits excitation of leg motor neurons associatedwith escape(Ritzmann and Camhi, 1978; Ritzmann, 1981; Ritzmann and Pollack, 1981), and killing of the GIs can alter wind-evoked motor responses (Westin and Ritzmann, 1982). Of these, the ventral four GIs (GIs 14) are especially important in evoking the escapebehavior under most natural conditions (Camhi and Levy, 1989). However, none of the GIs respond selectively to wind from the left versus right. For example, GIs 1, 2, and 4 are all omnidi-
rectional, whereasGI 3 respondsto wind from the front (Westin et al., 1977). Therefore, Camhi and Levy (1989) proposed a model of the assemblycode for direction that accounts for this discrepancy, in which the number of action potentials is compared between the left versusthe right group of ventral GIs (GIs l-4). Our findings of the directionally selective interneurons provide new insightsinto the neural mechanismresponsiblefor the specification of stimulusdirection. We observethat 101 and
107 respond most preferentially to wind from the left versus right, whereas 102, 103, 111, and 203 respondto that from the
The Journal of Neuroscience,
Interneuron
June 1993, U(6)
2299
104
w Linear model 2nd-order
model
50 ms
C2'
Response
r
--
2nd-order
models
(00)
Linear model
I
I
!?ii
Ii
-I 103
Frequency
(Hz)
D lpsi
Stimulus
10mv
Cont
Figure II. A, Response to white noise modulation of wind in 104, and its linear and second-order nonlinear models. MSEs for the linear and second-order nonlinear models were 98.9% and 42.7%, respectively. The improvement of MSE by the second-order model was 56.2% in this record. The second-order nonlinear model matches the actual response well. B, Hyperpolarized response from the 104 evoked by the sinusoidal modulation of wind at 0”. C, Power spectra of the responses (C,) and linear (first-order) and second-order models (C,) at two different stimulus angles (0“ and ipsi 900). We note that the response exhibited power in a frequency range beyond that of the stimulus itself. D, Responses from a 104 intemeuron evoked by electrical stimulation (arrowheads) of the ipsilateral and contralateral cereal nerves. Three sweeps were individually superimposed.
front versusrear (Fig. 15).There are thus at leasttwo subsystems responding maximally to wind displacement along two coordinate directions, one for the longitudinal direction and the other for the transversedirection, into which the direction (and intensity) of wind is encoded. For each direction, each system is tuned to respondto one of the two vector componentsof this direction. A similar neural coding is seenin the fly visual system, where the direction and velocity of a motion pattern on the retinal imageisencodedinto two independentmotion-detecting circuits,
a vertical
system (VS) and a horizontal
system (HS).
The VS and HS neuronsin the lobula plate respondmaximally to vertical and horizontal motion, respectively (Hausen, 198l), and are thought to play a major role in the control of optomotor behavior
(Hausen
and Wehrhahn,
1983; Egelhaaf et al., 1988).
Another important aspectof the function of directionally sensitive interneurons is “lateral inhibition.” A population of GIs in the terminal ganglion of the cricket respondsto wind with sharply directional sensitivity owing to converging excitatory and inhibitory input in their receptive field (Matsumoto and Murphey, 1977; Jacobs et al., 1986). The inhibitory input serves to enhance the contrast between two cerci (lateral inhibition),
and thereby to sharpen the directional sensitivity of the GIs,
although no such intemeurons have yet been described. In other integrative systems, some intemeurons mediate lateral inhibi-
tion that enhancesthe contrast of stimulus from left versusright. For example, omegacellsin cricket thoracic gangliainhibit their contralateral counterpart (Wohlers and Huber, 1978) and local, directionally selectiveintemeurons in crayfish terminal ganglion inhibit the intersegmentalinterneuron on the contralateral side (Reichert et al., 1983; Kondoh and Hisada, 1986). Cells 101 and 107 are similar to those intemeurons in somerespects,and thus are the most plausible candidate for lateral inhibition between two cerci. First, they all are local intemeurons, and responsiblefor local circuit interactions within the segmentalganglion. Second, they are selectively excited by a stimulus with a particular directionality, and inhibited in the other direction (for the LDS intemeuron, Krenz and Reichert, 1985). Third, they have extensive bilateral dendritic arborizations that are interconnected by a thick neurite running acrossthe midline.
Origin of the d@erentiatingjirst-order
kernel
When applied to a linear system, the first-order kernel correspondsto the system’s impulse response.When applied to a nonlinear system,the kernel is the best (in an MSE sense)linear
2300
Kocdch
et al. - Response
Dynamics
of Nonspiking
Interneuron
Local
lntenwurons
201
lo mv
10mv
5
mv
80 pm
50
BI
Response
(0’)
50 ms
ms B2
Stimulus
0”. ipsi 60”.
ipsi 120’,
B3
r
2nd-order (O”, ipsi W”,
models ipsi 120”.
180”)
18
J 03 Frequency (Hz)
Frequency (Hz)
Frequency (Hz)
12. A, Intracellularrecordings from 201to white noisestimulus,and its linearand second-order nonlinearmodels.MSEsfor the linear andsecond-order nonlinearmodelswere99.0%and 42.4%in thisrecording.Therefore,thereis a 56.6%improvementof the MSEwith inclusion of the second-order model.B,, Frequencyresponse in 201 showingpowerspectraof the input white noise,response, andlinearandsecond-order modelswhenthe intemeuronwasstimulatedat 0”. Wenotethat the synapticinput onto 201andthe second-order modelispassed througha lowpassfilter. B, and B,, Powerspectraof responses, linearmodels,andsecond-order nonlinearmodelsin four differentdirections(09 ipsi 60”, ipsi 120”.and 180”).C, Intracellularrecordingsfrom 101, 103,104, and 201 to a sinusoidalstimulus,in the bestdirectionsfor cells101 and 103, showinga frequency-doubling response in 104and 201. In contrastlo the linear(IOI) and half-waverectifier(103)interneurons,responses to a sinusoidalwaveat a high-frequencyrangein 104 and201 hada secondharmoniccomponent. Figure
approximation of the system’simpulse response.For example, in horizontal cells in a turtle retina, the first-order kernel is equivalent to the responseto a brief Rashof light (Chappell et al., 1985; Sakai and Naka, 1987). In the cockroach, the firstorder kernel is the best linear approximation of the cell’s responseto a brief push-pull of the speaker’smoving plate and hencea brief air displacement.The waveform of the first-order kernelsfrom 101, 107, and 203 wasbiphasic, whereasthat from 111wasmore differentiating, indicating that theseinterneurons are sensitive to the rate of change of the input (i.e., wind velocity). The wind receptors are also velocity sensitive (BuAo, 1981; Kondoh et al., 1991b). The initial excitation and the following inhibition of the biphasic first-order kernel correspondsto a responseto wind from a given direction and the opposite polar direction, respectively. If the receptors respond linearly to the bending of sensoryhair and the air displacement, the resultsdescribedhere can be explained. However, the cereal afferents respondin a nonlinear way suchthat bendingof a hair to the direction opposite to the optimal excitatory field produces no responsein its receptor neuron or inhibits its spontaneous activity (Dagan and Camhi, 1979).
A likely possibility is that the first-order kernel produced by the contralateral stimulation is transmitted to the intemeurons via a sign-inverting synapse,and two subsetsof column hairs whose optimal directions are opposite to each other act in a push-pull fashion. For example, 101 would receive excitatory input directly from the filiform hairs of columns I and/or m, and inhibitory input from columns a and/or d via an unknown inhibitory interneuron intervening between them. Electrical stimulation of the cereal nerve revealed that 101 receivespostsynaptic, inhibitory input from cercus in addition to short-latency, probably monosynaptic excitatory inputs (Kondoh et al., I99 la). Postsynaptic inhibition has been previously demonstrated in the cereal system of cockroaches(Callec, 1974) and crickets (Levine and Murphey, 1980). Our unpublished observation on changesinduced in the cockroach after application of picrotoxin showsthat inhibitory interaction plays an important role in linear processingof the signal by linear intemeurons. Picrotoxin is well known to act as a noncompetitive antagonist of GABA. As we expected, MSE for the first-order model significantly increased4 min after being bathed in 1O-4M picrotoxin, indicating that the polarity-inverted kernelsare produced
The Journal of Neuroscience,
A
L-N-L Receptor +
Input
cascade Rectification Static
1st linear filter
*
nonlinear filter (Square)
(Band-pass)
June 1993, 73(6) 2301
model Synaptic )
transmission
2nd linear filter
*
output
(Low-pass)
Interneuron 201
Cross-correlation *---m-w--\
\
\
\
\
\ \ Convolution \ \.
1 st-orcler 2nd-order
C,O
10 20 Tau (ms)
30
r 5mv 0.1 s Tau 1 (ms)
Figure 13. Productionof the second-order kernelwith a three-barconfiguration.A, Aa LNL cascademodel.B, A second-order kernelwith a characteristic three-barstructurein a 201and its parallelcut, that is,a sideview of the kernel,whichwasusedasa band-pass filter. Solid lines on
the kernelindicatethe positionof the cut. C, A second-order kernelvery similarto that of the actualresponse wasproducedby cross-correlation betweenwhite noiseinput andthe output of the secondlinearfilter. D, Response in 201to white noise,the first- and second-order models,the summationof the models,and the cascade modelproducedby processing the stimulusthroughthe LNL filter cascade. The samewhite noisewas processed througha band-pass filter whoseimpulseresponse (Parallel cut) is shownin B. The output of the filter wassquared. The squaredoutput wasthen passed througha secondlinearfilter. via a probable inhibitory interaction between two subsetsof columns. The intersegmentalinterneurons in the locust metathoracic ganglion alsoreceive both monosynaptic excitatory and disynaptic inhibitory inputs from a leg. Laurent (1988) demonstrated that the inhibition is mediated by one or several interposed spiking interneuronsthat receive direct input from exteroceptors and proprioceptors, and servesto sharpenthe edgesof the excitatory regions of the receptive fields and thereby to increase the contrast. The inhibitory input servesto enhancethe directional sensitivity and also to improve the time resolution of the response.The wind-evoked responsesin 101, 111,and 203 were found to be much faster than those in nonlinear interneurons 102 and 103, which would receive no or very weak inhibitory input on the side opposite to the preferred direction. For example, the power spectrum of responsein 111 had a peak at 70-90 Hz (Fig. 4), whereasthat in 102beganto fall off at about 20 Hz (Fig. 7). The best frequency of the cereal afferents in the
cockroach was estimated to be about 100 Hz from the firstorder kernels (Kondoh et al., 1991b), and is comparable to the best or natural frequency of hairs on the cricket cerci (Gnatzy and Tautz, 1980; Shimozawa and Kanou, 1984; K$imper and Kleindienst, 1990). The second-ordernonlinear component A largeMSE for the first-order model indicateseither very noisy responseor the responseof a higher-order component. If the componentis second-order,the second-ordermodelmakesMSEs much smaller. In 104, 108, and 20 1, MSE for the first-order model was more than 90%, whereasthat for the second-order modelsrangedfrom 30%to 50%. Thus, the second-orderkernels predicted 50-70% of the total responseevoked by white noise in this subset of interneurons. The rest not predicted by the kernels are due to spontaneoussynaptic input that is not accounted for by the first- or second-orderkernel, or the higherorder nonlinear components. We think that the former is likely
Linear
I
2nd-order
t3
Linear
2nd-order
Linear
2nd-order I
180"
*
::: 108
The Journal
Linear 180”
Half-wave
..._....... :.:.:.:.>>:.:.:.: -:::j:::.:.:_,.,.,.(. “::lillllll:~.i:i:i:I::.’
lpsi 90”
~
180”
(--::c3 103
102
.............~.~.~. ..::iiiil:iiiiiiiti:ililiil: .. ......-:::. .:. ~~:.:.:.~:::::::i:::::::::::-
c
Excitatory
field
1Inhibitory 0” 180”
field
June 1993, 13(6) 2393
rectification
180”
101,107
of Neuroscience,
lpsi
90”
Cont
90”
lpsi 90”
Cont
90”
104
Schematicdiagramsof directional propertiesof the nine nonspiking local interneurons. Shaded regiokrepresentinhibitory directions; openregions represent excitatorydirections.
becausespontaneoussynaptic input was observed even in the absenceof any wind stimulus. The corresponding activity of cerealafferents has also been observed by Westin (1979). Such noise at the input is a source of error in kernel estimation. If we take account of the noise,the MSE of 3wO% for the secondorder kernel is very reasonable.In the almostnoise-freeneurons, for example, horizontal cells in the vertebrate retina, MSE was closeto 5-10% (Sakai and Naka, 1987). The second-order kernels predict the nonlinear part of the responsearising from a static (nonmemory) nonlinearity such assquaring,rectification, saturation, and so on (Marmarelis and Marmarelis, 1978; Sakuranagaet al., 1986).The kernelscan be usedto construct a cascademodel for the system,consistingof a static nonlinear element with one or two dynamic (memory) linear filters. The former is a cascadestructure of Wiener type, a linear filter-static nonlinear filter cascade,and the latter is a cascadestructure of Korenberg type in which a static nonlinearity is sandwichedbetween two linear filters (Korenberg and Hunter, 1986). For example, the type-C amacrine cells in the catfish retina produce a nonlinear response,an on-off transient depolarization to a step of light, whose second-order kernels have two depolarizing peaks on the diagonal and two off-diagonal,hyperpolarizing valleys (Sakuranagaand Naka, 1985a,b). Sakai and Naka (1987) showed that this second-order kernel can be reproduced by a band-passlinear filter followed by a squaringdevice. On the other hand, the second-orderkernel of type-N amacrine cell is more complex, and is produced by further band-passfiltering of type-C amacrine cell responses.
In the cockroach, the second-order kernels showed a characteristic three-bar structure in which an elongateddepolarizing peak on the diagonal is accompaniedwith off-diagonal hyperpolarizing valleys for 102, 103, 108, and 201. This kernel configuration was constructed by a band-passlinear filter-static nonlinear device-low-pass linear filter cascade,where the static nonlinearity is a squarer. The band-passfilter would simply reflect the mechanical property of cereal hair sensilla,whereas the low-passfilter representsthe transfer at synapsesbetween the cereal afferents and the interneurons. The squaredoutput is therefore a reproduction of the cell’s response.Either a multiplication of two sinewaves or a full-wave rectification produces the secondharmonic component that was seenin 104 and 201 when stimulated sinusoidally (Fig. 12c). As a full-wave rectifier is best approximated by a squarer, we reasonably concluded that this static nonlinear filter would represent a full-wave rectification of the signal.This LNL filter cascade,band-passfilterhalf-wave or full-wave rectification-low-pass filter, is equivalent to the theory of AM radio. The function of interneurons 104, 108, and 201 as seenby their second-order kernels is thus to compute the power of wind stimuli at a particular frequency range. The second-order nonlinear component also comprises a major part in GIs 1 and 2 (Y. Kondoh and J. Okuma, unpublished observations). The full-wave rectification obviously representsthe omnidirectional sensitivity of theseinterneurons (Westin, 1977; Dagan and Camhi, 1988). On the other hand, the second-ordernonlinearity in 102 and 103 was suggestedto be a signalcompression(a half-wave rec-
Figure 15. 108,201
1 0”
t Figure 14. Polar plotsof MSEsfor first- and second-order modelscomputedat angularintervalsof 30” for ninenonspikinglocalintemeurons
examined.Eachplot is obtainedfrom 2 animalsfor 107and 111;3 for 203; 4 for 102and 108;7 for 103, 104,and 201;and 10for 101.Each datumpoint is the improvementof MSE, andrepresents the ratio of a linearor second-order nonlinearcomponentin a total response. Outer circle represents 50%improvementof MSE, the inner circle, 25%. The linear componentformstwo response rangesthat are symmetricallyarranged acrossnull directions:0” and 180”for 101and 107,and ipsi 60” and cant 120”for 111and 203.The second-order componentis very minor in theseintemeurons.
2304
Kondoh
et al. - Response
Dynamics
of Nonspiking
Local
Interneurons
tification), and was modeled by a cascade of two filters: a bandpass linear filter and a static nonlinear filter. This filter configuration also accounts for the dynamics of the cereal receptors (Bufio et al., 198 1; Kondoh et al., 199 1b). The first-order kernels from cereal filiform sensilla were biphasic, and closely matched the time differential of a pulse, whereas the second-order kernels were also differential with two diagonal peaks and two off-diagonal valleys (Kondoh et al., 1991 b). The second-order nonlinearity is suggested to represent a half-wave rectification property of the wind receptors. All of the filiform hairs in the cockroach and cricket are deflected by wind preferentially in one plane (Nicklaus, 1965; Gnatzy, 1976). The sensory neurons are excited by only one of two directions of deflection of their filiform hairs, and the opposite direction elicits no response (Westin, 1979). Moreover, all the hairs within a given column have the same optimal excitatory direction (Dagan and Camhi, 1979). We therefore reasonably concluded that the interneurons with a half-wave-rectifier property receive excitatory input from a particular column of cereal hairs whereas those with a full-waverectifier property receive excitatory or inhibitory input from all columns.
References Bacon JP, Murphey RK (1984) Receptive fields of cricket giant intemeurons are related to their dendritic structure. J Physiol (Lond) 352:601-623. Bodnar DA, Miller JP, Jacobs GA (1991) Anatomy and physiology of identified wind-sensitive local intemeurons in the cricket cereal system. J Comp Physiol 168:553-564. Boyan GS, Williams JLD, Ball EE (1989) The wind-sensitive cereal receptor/giant intemeurone system of the locust, Locusta migrutoriu. IV. The non-giantintemeurones J CompPhysiol165:539-552. BufioW, Monti-BlochL, MateosA, HandlerP (1981) Dynamicpropertiesof cockroachcereal“threadlike” hair sensilla.J Neurobiol12: 123-141.
Burrows M (1980) The control of sets of motor neurones by local intemeurones in the locust. J Physiol (Land) 298:213-233. Burrows M (1987) Parallel processing of proprioceptive signals by spiking local intemeurons and motor neurons in the locust. J Neurosci 7: 1064-l 080. Burrows M, Siegler MVS (1976) Transmission without spikes between locust intemeurones and motoneurones. Nature 262:222-224. Burrows M, Siegler MVS (1985) The organization of receptive fields of spiking local intemeurons in the locust with inputs from hair afferents. J Neurophysiol 53: 1147-l 157. Callec JJ (1974) Synaptic transmission in the central nervous system of insects. In: Insect-neurobiology (Treheme JE, ed), pp 119-l 85. New York: North-Holland-American-Elsevier. Camhi JM (1980) The escape system of the cockroach. Sci Am 243: 144-157. Camhi JM, Levy A (1989) The code for stimulus directions in a cell assembly in the cockroach. J Comp Physiol 165:83-97. Camhi JG, Nolen TG (198 1) Properties-of the escape system of cockroaches during walking. J Comn Phvsiol 142:339-346. Camhi JM, Tom W (1578) Tie escape behavior of the cockroach Periplaneta americana. I. Turning response to wind puffs. J Comp Physiol 128:193-201. Chappell RL, Naka K-I, Sakuranaga M (1985) Dynamics of turtle horizontal cell response. J Gen Physiol 86:423453. Dagan D, Camhi JM (1979) Response to wind recorded from the cereal nerve of the cockroach Periplunetu americana. II. Directional selectivity of the sensory neurons innervating single columns of filiform hairs. J Comp Physiol 133:103-l 10. Daley DL, Camhi JM (1988) Connectivity pattern of the cercal-togiant intemeuron system of the american cockroach. J Neurophysiol 60:1350-1368. Egelhaaf M, Hausen K, Reichardt W, Wehrhahn C (1988) Visual course control in flies relies on neuronal computation of object and background motion. Trends Neurosci 11:351-358.
Gnatzy W (1976) The ultrastructure of the thread-hairs on the cerci of the cockroach Periplaneta americana L.: the intermolt phase. J Ultrastruct Res 54: 124-l 34. Gnatzy W, Tautz J (1980) Ultrastructure and mechanical properties of an insectmechanoreceptor: stimulus-transmitting structuresand sensory apparatus of the cereal filiform hairs of Gryllus. Cell Tissue Res 213:441-463. Hausen K (1981) Monocular and binocular computation of motion in the lobula plate of the fly. Verh Dtsch Zoo1 Ges 198 1:47-70. Hausen K, Wehrhahn C (1983) Microsurgical lesion of horizontal cells changes optomotor yaw responses in the blowfly CaIliphora erythrocephalu. J Exp Biol 219:211-216. Jacobs GA, Miller JP, Murphey RK (1986) Integrative mechanisms controlling directional sensitivity of an identified sensory intemeuron. J Neurosci 6:2298-23 11. %mper G, Kleindienst H (1990) Oscillation of cricket sensory hairs in a low-frequency sound field. J Comp Physiol 167: 193-200. Kanou M, Shimozawa T (1984) A threshold analysis of cricket cereal intemeurons by an alternating air-current stimulus. J Comp Physiol 154:357-365. Kobashi M, Yamaguchi T (1984) Local non-spiking intemeurons in the cercus-to-giant intemeuron system of crickets. Naturwissenschaften 71:154-155. Kondoh Y, Hisada M (1986) Regional specialization in synaptic input and output in an identified local nonspiking intemeuron ofthe crayfish revealed by light and electron microscopy. J Comp Neuro125 1:334348.
KondohY, Morishita H, Arima T, OkumaJ (1989) Dynamicsof a graded response in wind sensitive, nonspiking local intemeurons of the cockroach. In: Neural mechanisms of behavior (Erber J, Menzel R, Pflilger HJ, Todt D, eds), abstract 21. Stuttgart: Thieme. Kondoh Y, Morishita H, Arima T, Okuma J, Hasegawa Y (199 la) White noise analysis in a wind-sensitive, nonspiking intemeuron of the cockroach. J Comp Physiol 168:429443. Kondoh Y, Arima T, Okuma J, Hasegawa Y (1991 b) Filter characteristics of cereal afferents in the cockroach. J Comp Physiol 169: 653-662. Korenberg MJ, Hunter JW (1986) The identification of nonlinear biological systems: LNL cascade models. Biol Cybem 55: 125-134. Krenz WD, Reichert H (1985) Lateralized inhibitory input to an identified non-spiking local intemeuron in the crayfish mechanosensory system. J &mp Physiol 157:499-507. Laurent G (1988) Local circuits underlvine excitation and inhibition of intersegmental intemeurones in the-lo&St. J Comp Physiol 162: 145-157. Levine RB, Murphey RK (1980) Pre- and postsynaptic inhibition of identified giant intemeurons in the cricket (Acheta domesticus). J Comp Physiol 135:269-282. Marmarelis PZ, Marmarelis VZ (1978) Analysis of physiological system. New York: Plenum. Marmarelis PZ, Naka K-I (1972) White-noise analysis of a neuron chain: an application of the white-noise theory. Science 175:12761278. Matsumoto SG, Murphey RK (1977) The cercus-to-giant intemeuron system of crickets. IV. Patterns of connectivity between receptors and the medial giant intemeuron. J Comp Physiol 119:3 19-330. Miller JP, Jacobs GA, Theunissen FE (199 1) Representation of sensory information in the cricket cereal sensory system. I. Response properties of the primary intemeurons. J Neurophysio166: 1680-1689. Naka K-I, Sakuranaga M, Ando Y-I (1985) White-noise analysis as a tool in vision physiology. In: Progress in clinical and biological research, Vol 176, Contemporary sensory neurobiology (Correia MJ, Perachio AA, eds), pp 307-322. New York: Liss. Nicklaus R (1965) Die Erregung einzelner Fadenhaare von Peripfuneta americana in Abhsngigkeit von der G&se und Richtung der Auslenkung. Z Vgl Physiol 50:33 l-362. Reichert H, Plummer MR, Wine JJ (1983) Identified nonspiking local intemeurons mediate nonrecurrent lateral inhibition of crayfish mechanosensory intemeurons. J Comp Physiol 15 1:26 l-276. Ritzmann RE (198 1) Motor responses to paired stimulation of giant intemeurons in the cockroach Periplaneta americana. II. The ventral giant intemeurons. J Comp Physiol 143:71-80. Ritzmann RE, Camhi MR (1978) Excitation of leg motor neurons by giant intemeurons in the cockroach Periplaneta americana. J Comp Physiol 125:305-3 16.
The Journal of Neuroscience.
Ritzmann RE, Pollack ( 198 1) Motor responses to paired stimulation of giant interneurons in the cockroach Peripheta americana. I. The dorsal giant interneurons. J Comp Physiol 143:6 l-70. Robertson RM, Pearson KG (1983) Intemeurons in the flight system of the locust: distribution, connections, and resetting properties. J Comp Neurol 215x33-50. Sakai HN, Naka K-I (1987) Signal transmission in the catfish. V. Sensitivity and circuit. J Neurophysiol 581329-1350. Sakuranaga M, Naka K-I (1985a) Signal transmission in the catfish retina. I. Transmission in the outer retina. J Neurophysiol 53:373389. Sakuranaga M, Naka K-I (1985b) Signal transmission in the cattish retina. II. Transmission to type N cell. J Neurophysiol 53:390-410. Sakuranaga M, Ando Y-I, N&a K-I (1986) Dynamics of ganglioncell resnonse in the catfish and frog retinas. J Gen Physiol 90:229259. Shimozawa T, Kanou M ( 1984) The aerodynamics and sensory physiology ofrange fractionation in the cereal filiform sensilla ofthe cricket Gryllus bimaculatus. J Comp Physiol 155:495-505. Siegler MVS (1984) Local intemeurons and local interactions in arthropods. J Exp Biol 112:253-28 1.
June 1993, 73(6) 2205
Siegler MVS, Burrows M (1983) Spiking local intemeurons as primary integrators of mechanosensory information in the locust. J Neurophysiol 50:1281-1295. Westin J (1979) Responses to wind recorded from the cereal nerve of the cockroach Peripfunetu umericuna. I. Response properties of single sensory neurons. J Comp Physiol 133:97-102. Westin J, Ritzmann RE (1982) The effect of single giant interneuron lesions on wind-evoked motor responses in the cockroach Periplanetu americana. J Neurobiol 13: 127-139. Westin J, Langberg JJ, Camhi JM (1977) Response of giant intemeurons of the cockroach Periplaneta americana to wind puffs of different directions and velocities. J Comp Physiol 121:307-324. Westin J, Ritzmann RE, Goddard DJ ( 1988) Wind-activated thoracic intemeurons of the cockroach. I. Responses to controlled wind stimulation. J Neurobiol 19:573-588. Wohlers DW, Huber F (1978) Intracellular recording and staining of cricket auditory intemeurons (Gtylh.s cumpestris L., Gryllus bimuculatus DeGeer). J Comp Physiol 127:l l-28.