IEICE TRANS. ELECTRON., VOL.E98–C, NO.3 MARCH 2015
178
INVITED PAPER
Special Section on Leading-Edge Applications and Fundamentals of Superconducting Sensors and Detectors
Response of a Superconducting Transition-Edge Sensor Microcalorimeter with a Mushroom-shaped Absorber to L X-rays Emitted by Transuranium Elements Keisuke MAEHATA†,††a) , Makoto MAEDA†∗ , Naoko IYOMOTO† , Kenji ISHIBASHI† , Keisuke NAKAMURA††† , Katsunori AOKI††† , Koji TAKASAKI†††† , Kazuhisa MITSUDA††††† , and Keiichi TANAKA†††††† , Nonmembers
SUMMARY A four-pixel-array superconducting transition-edge sensor (TES) microcalorimeter with a mushroom-shaped absorber was fabricated for the energy dispersive spectroscopy performed on a transmission electron microscope. The TES consists of a bilayer of Au/Ti with either a 50nm or 120-nm thickness. The absorber of 5.0 µm thick is made from a Au layer and its stem is deposited in the center of the TES surface. A Ta2 O5 insulating layer of 100-nm thickness is inserted between the overhang region of the absorber and the TES surface. A selected pixel of the TES microcalorimeter was operated for the detection of Np L X-rays emitted from an 241 Am source. A response of the TES microcalorimeter to L X-rays was obtained by analyzing detection signal pulses with using the optimal filter method. An energy resolution was obtained to be 33 eV of the full width at half maximum value at 17.751 keV of Np Lβ1 considering its natural width of 13.4 eV. Response to L X-rays emitted from a mixture source of 238 Pu, 239 Pu and 241 Am was obtained by operating the selected pixel of the TES microcalorimeter. Major L X-ray peaks of progeny elements of α decay of Pu and Am isotopes were clearly identified in the obtained energy spectrum. The experimental results demonstrated the separation of 241 Am and plutonium isotopes by L X-ray spectroscopy. key words: TES microcalorimeter, Mushroom shaped absorber, X-ray response, Energy Resolution, L X-ray spectroscopy
1. Introduction Plutonium isotopes are handled with special care in nuclear fuel cycle facilities such as reprocessing plants and mixed Manuscript received June 24, 2014. Manuscript revised September 10, 2014. † The authors are with Department of Applied Quantum Physics and Nuclear Engineering, Kyushu University, 744 Motooka, Nishi-ku, Fukuoka, 819-0395 Japan. †† The author is with Research Institute of Superconductor Science and Systems, Kyushu University, 744 Motooka, Nishi-ku, Fukuoka, 819-0395 Japan. ††† The authors are with Sector of Decommissioning and Radioactive Wastes Management, Japan Atomic Energy Agency, 433 Muramatsu, Tokai-mura, Naka-gun, Ibaraki, 319-1194 Japan. †††† The author is with Oarai Research and Development Center, Japan Atomic Energy Agency, 4002 Narita-machi, Oarai-machi, Higashi Ibaraki-gun, Ibaraki, 311-1393 Japan. ††††† The author is with Institute of Space and Astronautical Science, Japan Aerospace Exploration Agency, 3-1-1 Yoshinodai, Chuo-ku, Sagamihara, Kanagawa 252-5210, Japan. †††††† The author is with Hitachi High-Tech Science Corp., 36-1 Takenoshita, Oyama-cho, Suntou-gun, Shizuoka 410-1393, Japan. ∗ Presently, the author is with Nuclear Science and Engineering Center, Japan Atomic Energy Agency, 2-4 Shirakata Shirane, Tokai-mura, Naka-gun, Ibaraki, 319-1195 Japan. a) E-mail:
[email protected] DOI: 10.1587/transele.E98.C.178
Table 1 Energy E and emission probability PE of γ-ray and/or X-ray photons emitted following the α decay of 239 Pu and 241 Am isotopes. 239 Pu
L X-ray Kα X-ray Kβ X-ray γ-ray
E [keV] 11.6−20.7 94.7−98.4 110−115 13.0−129
241 Am
PE [%] 4.66 0.0108 0.0182 0.0649
E [keV] 11.9−22.2 97.0−101 113−118 26.4−59.5
PE [%] 37.66 0.0029 0.0009 38.46
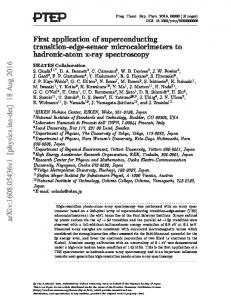
oxide fuel fabrication facilities. Most plutonium isotopes decay into uranium progenies by emitting mono-energy α rays. The isotope of 241 Pu decays to 241 Am isotope by emitting a β particle. Plutonium isotopes are usually analyzed by α ray spectrometry after a complicated chemical process for separation from the matrix material and removing 241 Am isotope which is progeny nuclide of 241 Pu. Following the α decay of most plutonium isotopes, the uranium progenies emit γ-rays and X-rays. The emission of X-rays results from internal conversion in the uranium progenies. Following the α decay of the 241 Am isotope, γ-rays and X-rays are emitted by 237 Np progeny in the same manner as γ-rays and X-rays are emitted by uranium progenies created by the α decay of most plutonium isotopes. Typical values of energy and emission probability of γ-ray and/or X-ray photons are presented in Table 1 [1] for the α decay of 239 Pu and 241 Am isotopes. As presented in Table 1, the values of the emission probability of L X-rays are much larger than those of γ-rays and L X-rays in the α decay of plutonium isotopes. Since most transuranium (TRU) elements emit L X-rays with the energy range from 10 to 22 keV following α decay, spectroscopic measurements of L X-rays are expected to be useful for nondestructive TRU monitors. We carried out preliminary spectroscopic measurements of L X-rays emitted from 241 Am and 239 Pu sources with using a CdTe semiconductor detector. Figure 1(a) and (b) show an experimental energy spectrum of L X-rays emitted by 237 Np progeny resulting from the α decay of 241 Am and that by 235 U progeny resulting from the α decay of 239 Pu, respectively by dashed lines. Solid lines indicate theoretical emission probability of corresponding L X-ray lines [2], [3]. As shown in Fig. 1, the energy resolution of the semiconductor detector is insufficient to identify all L X-ray peaks in a mixture of 241 Am and 239 Pu. Various microcalorimeters with a superconducting
c 2015 The Institute of Electronics, Information and Communication Engineers Copyright ⃝
MAEHATA et al.: RESPONSE OF A SUPERCONDUCTING TRANSITION-EDGE SENSOR MICROCALORIMETER
179
X-ray spectroscopy was demonstrated by using the TES microcalorimeter, the sensitive area of the TES microcalorimeter was insufficient for practical use. Therefore a pixel array TES microcalorimeter has been desired to be developed for increasing the the sensitive area with keeping the high energy resolution. A four-pixel-array TES microcalorimeter with a mushroom-shaped absorber was developed for energy dispersive spectroscopy (EDS) performed on a transmission electron microscope (TEM)[8]. The mushroom-shaped absorber is made from a Au layer and the square-shaped absorber stem is deposited in the center of the TES surface. Two types of microcalorimeter were fabricated with differing absorber thicknesses of 0.5 and 5.0 µm to detect X-ray photons in the energy range from 300 eV to 15 keV. The Au mushroom-shaped absorber of 5.0 µm thick has an absorption efficiency of 50% for photons with an energy of 20 keV to detect L X-ray photons emitted by TRU elements. We operated the four-pixel-array TES microcalorimeter with the Au mushroom-shaped absorber of 5.0 µm thick for detecting L X-rays emitted from 238 Pu, 239 Pu and 241 Am sources. A dry-3 He–4 He dilution refrigerator was used to maintain the operating temperature of the TES microcalorimeter without disturbing L X-ray detection over a period of data accumulation for sufficient statistics. A response of the TES microcalorimeter to L X-rays was obtained by analyzing detection signal pulses. 2.
Fig. 1 Energy spectra of Np L X-rays emitted from 241 Am source (a) and U L X-rays emitted from 239 Pu source (b) obtained by our preliminary measurements with a CdTe semiconductor detector. Solid lines indicate theoretical emission probability of corresponding L X-rays.
transition-edge sensor (TES) have been developed and demonstrated to be operated with the energy resolution superior to that of the semiconductor detector [4], [5]. We have previously developed a TES microcalorimeter with a Au absorber of 5.0 µm thick to detect L X-ray photons emitted from 241 Am, 238 Pu and 239 Pu sources [6]. However, we could not evaluate the energy resolution for peaks in the energy spectra of L X-rays emitted by 238 Pu and 239 Pu sources because of insufficient statistics. Then spectroscopic measurements of L X-rays emitted from 241 Am, 238 Pu and 239 Pu sources has been conducted over sufficient time period by operating an improved TES microcalorimeter with the sensitive area of 150 × 150 µm2 , and values of the full width at half maximum of L X-ray peaks in the experimental energy spectra have been obtained to be 60.9 eV at 17.751 keV for 241 Am source, 62.5 eV at 17.222 keV for 238 Pu source and 62.6 eV at 17.222 keV for 239 Pu source [7]. Although separation of 241 Am and plutonium isotopes by L
4-pixel-array TES Microcalorimeter with a Mushroom Shaped Absorber
A TES microcalorimeter is a detector that measures the energy of an incident X-ray photon by the temperature rise, and consists of an energy absorber and a TES [9]. The energy of the incident X-ray photon is converted into a temperature rise in the absorber. The TES is a thermosensor utilizing the strong temperature dependence of the electric resistance of a superconducting thin film in the phase transition region for a precise measurement of the temperature rise. The sensitivity of the TES is given by α = d(ln RT ES )/d(ln T ), where RT ES and T are the electric resistance of the TES and the temperature, respectively. As shown in Fig. 2, TES is electrically connected to an input coil of a superconducting quantum interference device (SQUID) array amplifier, and thermally connected to a heat bath of temperature T b through a heat link of conductance G. The input coil L is connected in series with the TES, while a shunt resistor RS is connected in parallel with the TES–L line and a constant direct-current bias current I0 supplied to the TES electric circuit is divided into the TES current IT ES and the shunt current IS . The TES current IT ES converted into the magnetic flux ϕ by the input coil L and the SQUID array amplifier outputs the voltage Vout proportional to the TES current IT ES . With electrothermal feedback, the theoretical energy resolution is given by √ √ ∆E = 2.35 kBCT 2 8n/α (1)
IEICE TRANS. ELECTRON., VOL.E98–C, NO.3 MARCH 2015
180
Fig. 2 Electric circuit of the TES microcalorimetor and the SQUID array amplifier.
Fig. 4 Photograph of a fabricated 4-pixel-array TES microcalorimeter with a mushroom-shaped absorber.
Fig. 3 Structure of a TES microcalorimeter pixel with a mushroomshaped absorber. (A) Top view, (B) Cross-sectional view.
where n is typically between three and five, where kB and C are the Boltzmann constant, the effective heat capacity of the TES microcalorimeter, respectively [10]. Several types of mushroom-shaped absorber have been developed in an attempt to increase the sensitive area of the TES microcalorimeter [11]–[13]. The operational performance of the microcalorimeter is affected by the deformation of the overhanging structure. In the four-pixel-array TES microcalorimeter developed for the EDS on the TEM, the overhanging structure of the mushroom-shaped absorber was supported by inserting a thin insulating layer between the overhang layer of the absorber and the TES surface [8]. In this work, we fabricated the four-pixel-array TES microcalorimeter with a same pixel structure described in reference [8]. The Au absorber thickness was selected to be 5.0 µm for detecting X-rays with absorption efficiency of 50% at the energy of 20 keV. Figure 3 shows a schematic structure of the TES microcalorimeter pixel with a mushroom-shaped absorber with supported overhanging structure. The thin-film thermometer of the TES consists of a Ti/Au bilayer formed on a SiN x membrane. The mushroom-shaped absorber is made from a Au layer and the square-shaped absorber stem is deposited in the center of the TES surface. A 0.1-µm-thick Ta2 O5 insulating layer is inserted between the overhang layer of the absorber and the TES surface to support the overhanging structure. The geometrical dimensions of the elements of the TES microcalorimeter pixel are listed in Table 2. The TES microcalometer and the SQUID array amplifier chips were glued on a sample holder with a GE7031 varnish. Figure 4 shows a photograph of a fabricated fourpixel-array TES microcalorimeter chip glued on the sample holder. Each pixel of the TES microcalorimeter is labeled as px1–px4. The sample holder with the TES microcalometer and the SQUID array amplifier chips was cooled by a
Fig. 5 Relationship between the electric resistance of the TES and the temperature of px1–px3. Table 2
Geometrical dimensions of TES microcalorimeter pixel.
Elements
Dimensions
Au absorber thickness Au absorber surface area Au absorber stem area Ta2 O5 layer thickness Ta2 O5 layer perimeter TES bilayer thickness TES surface area SiN x membrane thickness SiN x membrane surface area
5 µm 160 µm × 160 µm 100 µm × 100 µm 100 nm 180 µm × 180 µm 120 nm (Ti)/50 nm (Au) 200 µm × 200 µm 1 µm 400 µm × 400 µm
compact dry-3 He–4 He dilution refrigerator pre-cooled by the Gifford–McMahon (GM) cooler. Precise operation of the TES microcalorimeter had been disturbed by severe mechanical vibrations accompanied with reciprocating motion of the GM cooler [14]. For suppressing mechanical vibrations the GM cooler was installed in the vacuum chamber of the 3 He–4 He dilution refrigerator with employing a vibration-proofing structure. After cooled below 200 mK, the electric resistance of the TES of each pixel in the TES microcalorimeter chip was measured by applying a constant bias current I0 = 10 µA with changing temperatures. In the circuit diagram Fig. 2, the electric resistance of the TES RT ES is given by
MAEHATA et al.: RESPONSE OF A SUPERCONDUCTING TRANSITION-EDGE SENSOR MICROCALORIMETER
181
( RT ES =
) I0 − 1 RS ηVout
(2)
where RS = 7 mΩ and the value of η is evaluated for a superconducting state of the TES, RT ES = 0. Figure 5 shows measured temperature dependence of the electric resistance of the TES RT ES of px1–px3. The px4 could not be measured due to accidental damage in a setup preparation. Table 3 lists measured values of the transition temperature T c , the phase transition temperature width ∆T trn , the normal conducting resistance RN and the sensitivity α of the TES of px1–px3. For operating the TES microcalorimeter with the high energy resolution, the bath temperature T b and the bias current I0 are determined with taking account of the relationTable 3 The transition temperature T c , the temperature phase transition width ∆T trn , the normal conducting resistance RN and the sensitivity α of the TES. px
T c (mK)
∆T trn (mK)
RN (mΩ)
α at 128 mK
1 2 3
128.4 128.0 127.6
2.8 2.8 2.4
115 130 125
102 160 260
ship between the applied bias current I0 and the electric resistance of the TES RT ES at temperatures below T c . Figure 6 shows an example of obtained relationship between the applied bias current I0 and output voltage of the SQUID array amplifier Vout of px3 at a bath temperature of 80 mK. The superconducting state of the TES is indicated by the straight line in Fig. 6 for I0 below 120 µA. The temperature of the TES microcalorimeter pixel increases with Joule heat generation caused by RT ES with applying bias current I0 above 120 µA. In the range of I0 between 120 and 300 µA, the TES is in the phase transition region owing the electrothermal feedback mechanism [10]. The normal conducting state of the TES is indicated by the straight line in Fig. 6 for I0 above 300 µA. By using Eq. (2) relationship between I0 and Vout is converted in to that between I0 and RT ES . Figure 7 shows relationship between I0 and RT ES /RN for px1–px3 at a bath temperature of 80 mK. As shown in Table 3 and Fig. 7, px1, px2 and px3 in the TES microcalorimeter chip have almost the same characteristics within a tolerance for X-ray detection operation. 3.
Fig. 6 Relationship between the applied bias current I0 and output voltage of the SQUID array amplifier Vout of px3 at a bath temperature of 80 mK.
Fig. 7 Relationship between the applied bias current I0 and the electric resistance of TES RT ES /RN for px1–px3 at a bath temperature of 80 mK.
Response to L X-rays Emitted from 241 Am Source
The four-pixel-array TES microcalorimeter was cooled down to 80 mK and irradiated with L X-rays emitted from a sealed 241 Am source of 3.7 MBq. The 241 Am source was wrapped with a polyimide tape for stopping α-rays and attenuating intensity of L X-rays and placed inside the refrigerator. Each pixel of the TES microcalorimeter was operated individually with using a single channel electronics consisting of the TES bias current source and the readout of the SQUID array amplifier. Counting rate of detection signal pulses was found to be 1 count per second. First the px3 was selected to operate for L X-ray detection because of the highest value of the sensitivity α listed in Table 3. L X-ray detection signal pulses were accumulated in operating with setting the TES resistance RT ES to 20, 30, 40, 50 and 60% of RN . The TES resistance RT ES was set by applying the bias current I0 with using relationship between the applied bias current I0 and the electric resistance of TES RT ES /RN shown in Fig. 7. Detection signal pulses were digitized with 2.5 × 10⁵ samples per second and accumulated in a personal computer for response analysis. As shown in Fig. 8 two types of signal pulses were observed with different shape in X-ray detection. Slow signals consist of single rise and decay components with time constants of 16 and 395 µs, respectively, while fast signals consist of a rise component with a time constant of 6.4 µs and two decay components with time constants of 16 and 395 µs. Slow signal pulses corresponded to X-rays detection events in the absorber, whereas X-rays absorbed in the TES generated fast signal pulses. The number of slow signal pulses were found to be 92% of all detection events. The full width at half maximum (FWHM) value of the energy resolution is expected by using the noise equivalent power NEP( f ) [15]. By using the noise power spectrum |N( f )|2 , NEP( f ) is expressed as
IEICE TRANS. ELECTRON., VOL.E98–C, NO.3 MARCH 2015
182
Fig. 8 Two different types of X-ray detection signal pulse observed in operating px2 at a bath temperature of 80 mK.
|NEP( f )|2 = 2E02
|N( f )|2 , |M( f )|2
(3)
where E0 is the L X-ray energy, |M( f )| is obtained by applying the Fourier transform the averaged voltage signal pulse. Figure 9 (a) and (b) show the Fourier transform of the averaged voltage signal pulse of 17.751 keV X-ray detection |M( f )| and the noise power spectrum |N( f )|2 with a cut-off frequency of 125 kHz. Expected FWHM values of the energy resolution were calculated for 17.751 keV X-ray detection with different operation setting of RT ES /RN by using the equation 2.35E0
∆Eev = √ ∫ 2
fmax 0
|M ( f )|2 df |N ( f )|2
,
Fig. 9 The Fourier transform of the averaged voltage signal pulse of 17.751 keV X-ray detection |M( f )| (a), the noise power spectrum |N( f )|2 (b).
(4)
where fmax was taken to be 125 kHz. Figure 10 shows relationship between operation setting RT ES /RN and the expected value of the energy resolution ∆Eev for 17.751 keV X-ray detection. The minimum value of ∆Eev was obtained to be 34.9 eV by operation setting RT ES /RN of 0.3. Then the px1 and px2 were operated for L X-ray detection with applying the bias current I0 for setting RT ES /RN to 0.3 and 0.4. Values of ∆Eev for the px1 and px2 were calculated with using Eq. (4) for 17.751 keV X-ray detection with operation setting RT ES /RN of 0.3 and 0.4. Calculated results are plotted in Fig. 10. The smallest value of ∆Eev was obtained to be 33.3 eV in operating the px2 with setting RT ES /RN of 0.3. The pulse height distribution for operation of the px2 with setting RT ES /RN of 0.3 was obtained by analyzing accumulated detection signals with using the optimal filter method [16]. In operating the TES microcalorimeter, a fluctuation of a bath temperature was observed to be ± 10 µK at 80 mK. The effect of the bath-temperature fluctuation was taken into account in the pulse height analysis. Since the signal pulses corresponding to 59.5 keV γ-ray detection were found in the pulse height analysis, the saturation energy of px2 would be higher than 59.5 keV. The obtained pulse height distribution was converted to response of the px2 by assigning peaks to energy of L X-rays emitted by 237 Np progeny resulting from the α decay of 241 Am.
Fig. 10 Relationship between operation setting RT ES /RN and the expected value of the energy resolution ∆Eev for 17.751 keV X-ray detection at a bath temperature of 80 mK.
Figure 11 shows obtained response of the px2 to L X-rays emitted from 241 Am source. Major peaks in the response in Fig. 11 are labeled with corresponding L-lines of Np X-ray. Since the expected FWHM value of the energy resolution of the px2 was evaluated to be 33.3 eV for 17.751 keV Xray detection, the natural line width of L X-ray was taken into account in fitting peaks in the response. In this work, response of the microcalorimeter to monoenergetic X-rays and the intensity distribution of individual L X-ray with the natural line width were assumed to have a Gaussian and Lorentzian shape, respectively, and individual peak in the response was fitted by using the Voigt function, which is the convolution of the Gaussian and the Lorentzian. Values of energy and natural width of L line X-ray were cited from the literature [17]. Fitted response to Lβ lines of Np X-ray is shown by solid line in Fig. 12. Dotted line in Fig. 12 indicates the intensity distribution of Lβ lines of Np X-ray.
MAEHATA et al.: RESPONSE OF A SUPERCONDUCTING TRANSITION-EDGE SENSOR MICROCALORIMETER
183
Fig. 11 Response of the px2 to L X-rays emitted from 241 Am source with setting RT ES /RN of 0.3 at a bath temperature of 80 mK.
Fig. 12
Fitted response to Lβ lines of Np X-ray.
Table 4 Line energy, the natural width and fitting results of the FWHM value of the energy resolution for response of the px2 to L X-rays emitted from 241 Am source. Line
E (keV)
Natural width (eV)
∆E (eV)
Np Lα1 Np Lβ1 Np Lγ1
13.946 17.751 20.784
11.8 13.4 15.9
33.9 ± 1.4 33.4 ± 1.2 30.4 ± 2.9
The FWHM value was obtained to be 33.4 eV at the Np Lβ1 peak of 17.751 keV, which agrees with the expected value. Table 4 summarizes fitting results of the FWHM value of the energy resolution with corresponding values of line-energy and the natural width. 4. Response to L X-rays Emitted from Mixture Source of 238 Pu, 239 Pu and 241 Am Since the handling of plutonium isotopes is strictly controlled under various safety regulations, the spectroscopic measurement of L X-rays emitted from plutonium isotopes was carried out by using checking sources of plutonium iso-
Fig. 13 Response of the px2 to L X-rays emitted from mixture source of 238 Pu, 239 Pu and 241 Am with setting R T ES /RN of 0.3 at a bath temperature of 80 mK.
Fig. 14
Fitted response to Lβ lines of U and Np X-ray.
Table 5 Line energy, the natural width and fitting results of the FWHM value of the energy resolution for response of the px2 to L X-rays emitted from mixture source of 238 Pu, 239 Pu and 241 Am. Line
E (keV)
Natural width (eV)
∆E (eV)
U Lα1 U Lβ1 U Lγ1 Np Lα1 Np Lβ1 Np Lγ1
13.618 17.222 20.169 13.946 17.751 20.784
11.7 13.5 14.5 11.8 13.4 15.9
31.5 ± 2.3 39.2 ± 1.3 33.5 ± 2.6 31.5 ± 2.3 39.2 ± 1.3 33.5 ± 2.6
topes for calibration of the lung counter at the Nuclear Fuel Cycle Engineering Laboratories of the Japan Atomic Energy Agency. Checking sources of plutonium isotopes consist of three lymph node blocks containing 238 Pu with a total intensity of 111.33 kBq and three lymph node blocks containing 239 Pu with total intensity of 184.63 kBq. The 4-pixel array TES microcalorimeter and the SQUID array amplifiers were cooled by a compact dry 3 He–4 He dilution refrigerator with pre-cooled by a remote helium cooling loop [18]. For confirming the performance of X-ray detection, the 4-pixel ar-
IEICE TRANS. ELECTRON., VOL.E98–C, NO.3 MARCH 2015
184
ray TES microcalorimeter was irradiated with L X-ray emitted from a sealed 241 Am source at a bath temperature of 80 mK. The sealed 241 Am source was placed in front of the X-ray window of the refrigerator. The X-ray window was made of a disk shaped beryllium plate of 25 mm in diameter and 1 mm thick. The px2 was operated for L X-ray detection with setting RT ES /RN of 0.3. Experimental FWHM value of the energy resolution was obtained to be 34.8 eV at the Np Lβ1 peak of 17.751 keV. Although an electrical noise in the laboratory caused a degradation of the energy resolution, the energy resolution was found to be superior to that obtained in last experiments [7]. Mixture source of 238 Pu, 239 Pu and 241 Am was placed in front of the X-ray window of the refrigerator, and the px2 was operated with setting RT ES /RN of 0.3. Figure 13 shows obtained response of the px3 to L X-rays emitted from mixture source of 238 Pu, 239 Pu and 241 Am. In obtained response, major peaks with high intensities can be clearly distinguished. Major peaks in the response in Fig. 13 are labeled with corresponding L-lines of U and Np X-ray. The Voigt function was used for fitting individual peak in the response as mentioned above. Fitted response to Lβ lines of U and Np X-ray is shown by solid line in Fig. 14. Dotted line in Fig. 14 indicates the intensity distribution of Lβ lines of U and Np X-ray. Table 5 summarizes fitting results of the FWHM value of the energy resolution with corresponding values of line-energy and the natural width.
[2]
[3]
[4]
[5]
[6]
[7]
[8]
5. Conclusions The four-pixel-array TES microcalorimeter was irradiated with L X-rays emitted from a sealed 241 Am source at a bath temperature of 80 mK. The selected pixel of the TES microcalorimeter was operated for the detection of L X-rays. Detection signal pulses were converted to a response of the TES microcalorimeter to L X-rays with using the optimal filter method. An energy resolution was obtained to be 33 eV of FWHM value at 17.751 keV. Response of L X-rays emitted from a mixture of 238 Pu, 239 Pu and 241 Am sources was obtained by operating the selected pixel of the TES microcalorimeter. Major L X-ray peaks of progeny elements of α decay of Pu and Am isotopes were clearly identified in the obtained energy spectrum. The experimental results demonstrated the separation of 241 Am and plutonium isotopes by L X-ray spectroscopy.
[9] [10]
[11]
[12]
[13]
Acknowledgments The authors thank T. Hasuo for technical support. This work was financially supported by SENTAN, Japan Science and Technology Agency (JST) and a Grant-in Aid for Scientific Research (B) (24360397) from the Japan Society for Promotion of Science.
[14]
[15]
References [16] [1] BNM-LNHB/CEA Table de Radioneucléides, Nuclear data of individual nuclide can be downloaded as follows : http://www.nucleide.
org/DDEP_WG/Nuclides/Pu-239_tables.pdf, Feb.2009,http://www. nucleide.org/DDEP_WG/Nuclides/Am-241_tables.pdf,Aug.2010. M. C. Lépy, J. Plagnard, and L. Ferreux, “Measurement of 241 Am L X-ray emission probabilities,” Appl. Radiat. Isot., vol.66, no.6–7, pp.715–721, June–July 2008. M. C. Lépy, B. Duchemin, and J. Morel, “Comparison of experimental and theoretical L X-ray emission probabilities of 241 Am, 239 Pu and 240 Pu,” Nucl. Instrum. Methods Phys. Res. A, vol.353, no.1–3, pp.10–15, Dec. 1994. A. S. Hoover, N. Hoteling, M. W. Rabin, J. N. Ullom, D. A. Bennett, P. J. Karpius, D. T. Vo, W. B. Doriese, G. C. Hilton, R. D. Horansky, K. D. Irwin, V. Kotsubo, D. W. Lee, and L. R. Vale, “Large microcalorimeter arrays for high-resolution X- and gammarayspectroscopy,” Nucl. Instrum. Methods Phys. Res. A, vol.652, no.1, pp.302–305, Oct. 2011. S. R. Bandler, J. S. Adams, C. N. Bailey, S. E. Busch, J. A. Chervenak, M. E. Eckart, A. E. Ewin, F. M. Finkbeiner, R. L. Kelley, D. P. Kelly, C. A. Kilbourne, J.-P. Porst, F. S. Porter, J. E. Sadleir, S. J. Smith, and E. J. Wassell, “Advances in small pixel TES-based X-ray microcalorimeter arrays for solar physics and astrophysics,” IEEE Trans. Appl. Supercond., vol.23, no.3, pp.2100705, June 2013. K. Maehata, K. Nakamura, T. Yasumune, K. Ishibashi, K. Takasaki, K. Tanaka, A. Odawara, and A. Nagata, “Development of a TES microcalorimeter for spectroscopic measurement of Lx-rays emitted by transuranium elements,” J. Nucl. Sci. Technol., vol.47, no.3, pp.308–313, Jan. 2010. M. Maeda, K. Maehata, N. Iyomoto, K. Ishibashi, K. Takasaki, K. Nakamura, K. Aoki, K. Mitsuda, K. Tanaka, and Y. Yamanaka, “Peak identification of L X-ray spectra of elemental Np and U,” J. Nucl. Sci. Technol., Sept. 2014. K. Maehata, N. Iyomoto, M. Maeda, S. Ezaki, A. Takano, S. Matsumura, T. Hara, K. Mitsuda, N. Y. Yamasaki, and K. Tanaka, “Development of 4-pixel-array TES microcalorimeters with mushroomshaped absorbers with insulating layers supporting overhang regions,” J. Low Temp. Phys., vol.176, no.3–4, pp.578–583, Aug. 2014. S. Friedrich, “Cryogenic X-ray detectors for synchrotron science,” J. Synchrotron Rad., vol.13, no.2, pp.159–171, Mar. 2006. K. D. Irwin, “An application of electrothermal feedback for high resolution cryogenic particle detection,” Appl. Phys. Lett., vol.66, no.15, pp.1998–2000, Apr. 1995. N. Tralshawala, S. Aslam, R. P. Brekosky, T. C. Chen, E. Figueroa Feliciano, F. M. Finkbeiner, M. J. Li, D. B. Mott, C. K. Stahle, and C. M. Stahle, “Design and fabrication of superconducting transition edge X-ray calorimeters,” Nucl. Instrum. Methods Phys. Res. A, vol.444, no.1–2, pp.188–191, Apr. 2000. J. A. Chervenak, F. M. Finkbeiner, T. R. Stevenson, D. J. Talley, R. P. Brekosky, S. R. Bandler, E. Figueroa-Feliciano, M. A. Lindeman, R. L. Kelley, T. Saab, and C. K. Stahle, “Fabrication of transition edge sensor X-ray microcalorimeters for Constellation-X,” Nucl. Instrum. Methods Phys. Res. A, vol.520, no.1–3, pp.460–462, Mar. 2004. Y. H. Lee, J. B. Bae, I. H. Kim, Y.-H. Kim, H. Y. Lee, K. B. Lee, M. K. Lee, and S. J. Lee, “Fabrication of thick metal absorber with overhanging structure for TESs,” IEEE Trans. Appl. Supercond., vol.19, no.3, pp.469–472, June 2009. T. Umeno, K. Maehata, K. Ishibashi, Y. Kamioka, S. Yoshida, K. Takasaki, and K. Tanaka, “Operation of a TES microcalorimeter cooled by a compact liquid-helium-free 3 He–4 He dilution refrigerator directly coupled to a Gifford–McMahon cooler,” Cryogenics, vol.50, no.5, pp.314–319, May 2010. D. McCammon, “Thermal equilibrium calorimeters,” in Cryogenic Particle Detection, Topics Appl. Phys. 99, ed. By C. Enss, pp.1–34, Springer-Verlag, Berlin, Heidelberg, 2005. A. E. Szymkowiak, R. L. Kelley, S. H. Moseley, and C. K. Stahle, “Signal processing for microcalorimeters,” J. Low Temp. Phys., vol.93, no.3–4, pp.281–285, Nov. 1993.
MAEHATA et al.: RESPONSE OF A SUPERCONDUCTING TRANSITION-EDGE SENSOR MICROCALORIMETER
185
[17] G. Zschornack, Handbook of X-ray Data, Springer-Verlag, Berlin Heidelberg, 2007. [18] K. Maehata, T. Hara, T. Ito, Y. Yamanaka, K. Tanaka, K. Mitsuda, and N. Y. Yamasaki, “A dry 3 He–4 He dilution refrigerator for a transition edge sensor microcalorimeter spectrometer system mounted on a transmission electron microscope,” Cryogenics, vol.61, pp.86– 91, May–June 2014.
Keisuke Maehata received the B.E. and Ph.D. degrees in nuclear engineering from Kyushu University, Japan in 1985 and 1992, respectively. He joined Low Temperature Division/Cryogenics Center of National Laboratory for High Energy Physics (KEK) as a research associate in 1986. He moved to School of Engineering, Kyushu University in 1990. He is associate professor of Graduate School of Engineering, Kyushu University. His research interests are radiation physics and measurements, applied superconductivity and cryogenics.
Makoto Maeda received the B.E., M.E. and Ph.D. degrees in nuclear engineering from Kyushu University, Japan in 2009, 2011 and 2014, respectively. He joined Japan atomic energy agency as a researcher in 2014. His research interests are radiation measurements.
Naoko Iyomoto received the B.S., M.S., and Ph.D. degrees in Physics from the University of Tokyo in 1994, 1996 and 1999, respectively. She has joined Kyushu University as an associate professor in 2010. Her research interests are in the radiation detection and measurement.
Kenji Ishibashi received B.E. degree in 1974, M.E. in 1976 and Ph.D. in 1980 from Kyushu University. He is professor of Graduate School of Engineering, Kyushu University. His research area is nuclear radiation measurement.
Keisuke Nakamura received the B.E. and M.E. degrees in Nuclear Engineering from Kyushu University, Japan, in 2007 and 2009, respectively. Since 2009, he has been working for Japan Atomic Energy Agency. He has been an engineer of radiological control section. He has been engaged in radiological control for a nuclear fuel reprocessing plant and maintenance of radiation monitoring systems.
Katsunori Aoki received the B.H.S. and M.H.S. degrees from Fujita Health University, Japan, in 2010 and 2012. Since 2012, he has been an engineer of radiological control section in Japan Atomic Energy Agency. He has been engaged in radiological control of nuclear fuel reprocessing plant and monitoring of gaseous radioactive wastes.
Koji Takasaki received his B.E., M.E. and Ph.D. degrees in Nuclear Engineering from Kyushu University, Japan, in 1984, 1986 and 2011, respectively. He is a deputy director of Health and Safety Department in Oarai Research and Development Center of Japan Atomic Energy Agency. His research area is the radiation protection and radiation measurements related to the nuclear fuel cycle facilities.
Kazuhisa Mitsuda received the B.S. and Ph. D. degrees in physics from University of Tokyo, Japan in 1979 and 1984, respectively. After three years of JSPS Post Doc, he got a position at Institute of Space and Astronautical Science (ISAS) as a research associate in 1987. He is now a professor at department of space astronomy and astrophysics of ISAS, which is now a part of Japan Aerospace Exploration Agency (JAXA). His major is high-energy astrophysics, and has worked on research and development of X-ray microcalorimeters since 1993.
Keiichi Tanaka received the M.S. degree in Physics from Tokyo Institute of Technology in 1997 and the D.S. degree in Physics from Tokyo University of Science in 2004, respectively. He stayed in Seiko Instruments Inc. from 1997 to 2005 and SII NanoTechnology Inc. from 2005– 2012. From 2013, he has stayed in Hitachi High-Tech Science Corp. His major research interests are to develop the TES system and devices. He is a member of the Japanese Society of Applied Physics.