Feb 29, 2012 - http://www.geo.cornell.edu/eas/PeoplePlaces/Faculty/cathles/Natural%20Gas/ .... kg by dividing the number
Press Release: Response to Howarth et al’s Reply (February 29, 2012) Lawrence M. Cathles (Department of Earth and Atmospheric Sciences, Cornell) Larry Brown (Department of Earth and Atmospheric Sciences, Cornell) Andrew Hunter (Department of Chemical and Biological Engineering, Cornell) Milton Taam (Electronic Software Inc., Caroline) In April of 2011 Howarth, Ingraffea and Santoro published online a letter in the journal Climatic Change to essentially argue that coal is a “cleaner” fuel than natural gas in terms of greenhouse gas emissions. We subsequentlyi submitted a commentary on that paper which was published online by the same journal on January 3 of 2012. Howarth et al’s response was published online on February 2, 2012. In our commentary we pointed out a number of serious flaws in both their analysis and presentation, which can be summarized as: 1) Unrealistically high estimates of fugitive emissions associated with unconventional gas production based on a cryptic presentation of relatively few and poor primary sources 2) A dismissive discussion of new technologies now in use to reduce such emissions 3) An unsupported, and we feel inappropriate, choice of the time interval for estimating greenhouse impacts of fugitive methane 4) Comparison of gas to coal on a basis (heat rather than electricity) which is basically irrelevant to evaluation of the relative greenhouse effects of these two options. In their reply Howarth, Santoro and Ingraffea (2012) reiterate their previous claims that (1) the total methane emissions generated during the life of a shale gas well could be as high as 7.85% of the well's lifetime production, (2) emissions during well completions are far greater for shale gas wells than other types of gas wells, (3) 20 years is the appropriate timeframe for comparing the greenhouse warming impacts of natural gas and coal, and (4) this comparison should continue to consider their relative heat contents. Basically speaking, they stand by their previous conclusion, citing new sources, that “shale gas has a much larger GHG (greenhouse gas) footprint than conventional natural gas, oil, or coal when used to generate heat and viewed over the time scale of 20 years (Howarth et al. 2011)”. Here we reiterate and substantiate our charges that none of these conclusions are warranted, especially in the light of new data and models.
Methane Emissions Methane emissions from a gas well, whether producing from a conventional reservoir or from shale, fall into the following six categories: emissions during well drilling and completion, during production at the well site, and while gas is being processed, transported, stored (including storage as LNG) and distributed. Howarth et al. (2012) present a blizzard of life cycle total emission numbers from the literature that suggest the leakage of methane is unconstrained throughout this journey from underground gas field to consumer, and therefore that their high end total emissions estimate of 7.85% is possible despite the numerous economic and safety arguments to the contrary. By the time one reads through all the numbers they cite as greater or less than this or that, and gets past the fact that the leakage percentages have been converted to the less intuitive and operationally relevant but more precise units of g C MJ‐1, the reader despairs that scientists will ever sort out what’s what in a way that makes clear what can or should be done about it. However, a simpler approach is available. Once a well has been completed, the on‐site operations and the delivery of the gas to the customer is the same for both conventional and unconventional gas wells. Five detailed analyses have been made of this common leakage on which we have many years of data and experience, and there is good agreement between the five studies. The issues are clearer if this common leakage is examined before the differences in venting between conventional and unconventional wells during well completion are addressed.
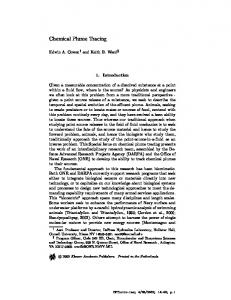
Leakages common to both conventional and conventional wells Figure 1 shows the common leakage indicated by three EPA studies, an extensive DOE‐ NETL study (Skone et al., 2011), a study by Venkatesh et al. (2011), and the leakages suggested by Howarth et al. (2011). Many papers (e.g., Hayhoe et al., 2002; Hultman et al, 2011; Hughes, 2011; Burnham et al., 2011; Fulton, 2011) use and comment on these data compilations, but as far as we know these are the main high quality summaries of the primary data. The second, third and fourth bars depict three EPA studies that analyzed 1992, 2006 and 2009 venting data. The results are very consistent. The 4th bar shows the methane venting documented by Venkatesh et al. (2011). They suggest more leakage during processing and less during transport, storage, and distribution. The first column shows the leakage from unconventional gas production in the Barnett Shale as analyzed by Skone (2011). It is similar to the leakage documented by the EPA. Skone’s study also analyzed leakage for other classes of wells (onshore conventional, offshore conventional, onshore associated, tight sand vertical, and coal bed methane) which all had similar leakages during transmission and storage to the Barnett except the onshore conventional wells, whose leakage was 40% higher than the average (0.625%) of the others. The last two columns show the range of leakages Howarth et al.(2011) suggest. The low end of their range is similar to the other studies, but their high end leakage is ~4 times greater than any of the other summaries suggest. This spectacular increase in the possible leakage is achieved by inflating leakages in (1) distribution, transportation and storage, and (2) routine on site leakage categories. In the first case the basis given for the inflation is (a) a leakage in Russian pipelines that occurred during the breakup of the Soviet Union which is irrelevant to gas pipelines in the U.S., and (b) a debate on the accounting of gas in Texas
pipelines that is mainly a concern over royalties and tax returns (Percival, 2010). Howarth et al. claim the industry is seeking to hide methane losses of more than 5% of the gas transmitted, but the proponents in the article state “We don’t think they’re really losing the gas, we just think they’re not paying for it”. In the second case (routine leakage) the basis of Howarth’s et al.’s inflation is a GAO study of venting from wells on onshore and offshore government leases. It is important to note that the GAO study does not distinguish venting from flaring (e.g. burning of fugitive gasses rather than releasing them directly to the atmosphere), thus it is perhaps not suprising that it conflicts dramatically with the three EPA and the DOE (Skone, 2010,2011, 2011b) studies, as can be seen in Figure 1. The GAO data may deserve careful examination, but to adopt it’s estimates as representative of vented gas without making clear the assumptions involved and its outlier status is to distort its significance at the very least. The dramatic high end leakage (last bar in Figure 1) is critical to Howarth et al.’s contention that natural gas could be as bad as coal when used to generate electricity, and twice as bad as coal when used for heating. It is this large increase in venting that allows them to make their controversial charge. In comparison to this increase, the extra leakage from shale gas wells they propose is minor. For example, Howarth et al assert an ~4% increase in leakage from the well site to customer (Figure 1) versus only a 1.9% increase due to unconventional well completions.
Emissions as % of lifetime production
8.00% 7.00%
Emissions that are common to both conventional and unconventional gas wells
6.00% 5.00% Routine site leaks
4.00%
Transp & Storage
3.00%
Processing
1.00%
Barnett 1992 Shale data a
0.00%
a
2.00%
2006 data
2009 data a
Distribution
a
Figure 1. Independent estimates of methane emissions that are common to conventional and unconventional gas wells. The first 5 columns are from Skone (2011), EPAGRI (1997), EPA (2010), EPA (2011), and Venkatesh et al. (2011). The last two columns are from Howarth et al. (2011, their Table 2, lines 25). The letter “a” indicates where data is assumed. Skone gives data for processing and transportation and storage for gas delivered to
electrical generating facilities. We assume the routing site leakage and the distribution leakage will be similar to that indicated in the average of the EPA analysis of the 1992 and 2006 data. Similarly we add the routine leakage at the well site identified in the EPA 2006 data analysis to Venkatesh and EPA(2011) estimates of the other leakages. There is no reason that the onsite routine leakages should have changed. For all the first 5 columns the transportation and storage leakage is about 60% of the sum of the transportation and storage and distribution leakages and we use this percentage to apportion the summed transportation and storage and distribution numbers given by Howarth et al. (2011). A short summary of how these data was compiled is given here in Appendix A.
Emissions during Shale Gas Well Completions In 2010 the EPA (2010) inferred the leakage that occurred from unconventional shale gas wells from data on the amount of gas captured by “green completions” reported to them by industry through their GasStar program. They estimated that 9175 Mcf of gas was emitted during the completion (or workover) of unconventional gas wells, and they assumed that half of these emissions were vented and half flared. (By contrast they estimated that conventional gas wells emit 36.65 Mcf during well completion (about half flared and half vented) and 2.45 Mcf during workover. On this basis almost all workers significantly increased the leakage from unconventional wells (e.g., Skone, 2011; Hultman et al, 2011; Hughes, 2011; Burnham et al., 2011; Howarth et al., 2011 ), and lately it has become common practice to assume that 85% of the workover and well completion emissions are released to the atmosphere. In their Table 1 Hultman et al. (2011) illustrate particularly clearly how the EPA’s purported extra venting for shale gas wells is simply added to the venting estimates for conventional wells as documented by studies such as the EPA(2010). It is important to note that the EPA(2010) reference, which is the basis for this increase, is considered by EPA to be a Technical Support Document not an official report. EPA has stated that they have not reviewed this analysis in detail and continue to believe that switching from another fossil fuel to natural gas reduces carbon pollution and other pollutants that harm health (see Fulton, 2011). Howarth et al.(2011) do not treat shale gas venting as suggested by the EPA(2010) technical support document; instead they tacitly assume without any justification, that all gas was vented (not 50% as suggested by the EPA, or 85% as has become common practice by many others). Howarth et al.(2012) admit that this venting is based on evidence of capture not venting. They continue to emphasize the greater venting from shale gas wells and this, together with the confusing way they presented the other leakage numbers, lets them attack shale gas without also suggesting that conventional gas production be abandoned. The key issues regarding venting during well completion concern the proportion of shale gas wells which vent methane to the atmosphere, and how much gas these wells vent. We disagree with Howarth et al. on both these crucial points. Based on Howarth et al’s own references, the average methane emissions during well completion for unconventional shale gas wells are not significantly greater than those cited by Howarth et al. for conventional gas wells. As we highlighted in the Electronic Supplementary Material to our initial Commentary, very few wells vent gas rather than capturing and selling/flaring the gas during completion, and those that do don't vent much gas. As we stated then, "Absent very specific documentation, which Howarth et al. [or the EPA] do not offer, we can find no reason to suspect that it is current industry practice to vent gas during these periods at the
extreme rates and quantities Howarth et al. suggest, and we find obvious economic and safety reasons that this would not be industry practice." The fundamental error of both Howarth and the EPA is to assume that evidence of capture is evidence of venting. Documenting that a small group of students are honest (capture gas) is not evidence that everyone else cheats (vents gas). This error is compounded by their adoption of venting magnitudes that are far too high. After the publication of Howarth et al.’s (2011) paper and our response to it (Cathles et al. 2012), we became aware of a data compilation by the Devon Energy Corporation documenting the completion of 1578 unconventional (shale gas or tight sand) gas wells by 8 different companies with a reasonable representation across the major unconventional gas development regions of the US (Harrison, 2012). To our knowledge, this is the only publically available syntheses of actual data on fugitive gases associated with unconventional gas, as opposed to estimates based on presumptions about what is done with that gasii. Of these 1578 wells, 1475 (93.5%) were green completed ‐ that is they were connected to a pipeline in the pre‐initial production stage so there was no need for them to be either vented or flared. This data from such a large number of wells certainly undermines the assertion of Howarth et al (2011) that green technologies are currently not employed to any significant degree, as well as the pejorative contention by Howarth et al (2012) that industry will use green practices only if required by regulations to do so (as if the latter were not a fact of life in the gas business). The issue of the penetration of green technology aside, there is simpler solution to reducing the greenhouse impact of fugitive emissions: flaring.Of the 6.5% of all wells that were not green completed, 54% were flared. Thus only 3% of the 1578 wells studied vented methane into the atmosphere, a figure very much less than Howarth et al.’s presumption that all unconventional wells are 100% vented during well completion and workover. Concerning the second gas venting question noted above, the Devon study goes further, and estimates the maximum gas that could be vented from the non‐green completed wells by calculating the sonic venting rate from the choke (orifice) size and source gas temperature of the well, using a formula recommended by the EPA. Since many wells might vent at sub‐sonic rates, which would be less, this is an upper bound on the venting rate. The total vented volume was then obtained by multiplying this venting rate by the known duration of venting during well completion. These vented volumes ranged from 340 to 1160 Mscf/completion, with an average of 765 Mscf/completion. This is only 8% of the 9175 Mscf/completion EPA(2010) estimated was typically vented from a shale gas well. All together the Devon study indicates that the venting from an average shale gas well is 23 Mscf (= 0.03 x 765 Mscf), which is more than 203 times smaller than the 4587 Mscf (=0.5 x 9175 Mscf) the EPA estimated is vented. This undermines Howarth et al.’s assertion in the first line of their Table 2 that shale gas wells vent 1.9% of total production whereas conventional gas wells vent only 0.01%. They show no error bars on either number! With the factor of 203 reduction, the emissions from a typical shale gas well are indeed comparable to that from a conventional gas well, and both are insignificant compared to even very low estimates of venting during delivery from the well to the customer.
This new Devon data strongly supports the contention in our Commentary that “...the losses during drill out and well completion for unconventional shale gas wells are not significantly greater than those cited by Howarth et al. for conventional gas wells”. In our opinion, there is little difference between the two, and the Methane emissions during completion from both types of gas wells are insignificant from a global warming perspective.
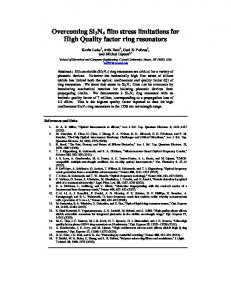
Global Warming Impact of Gas Substitution over time The lifetime of CO2 in the atmosphere is far longer than that of methane, therefore CO2 emissions impact global warming on a 100 year time frame in a way that methane doesn't. Both methane and CO2 released today will be an issue over the next 20 years. In 100 years the methane will be essentially gone but the CO2 will remain. Thus CO2 emissions are a much greater source of long‐term global warming than methane emissions, although both are important to manage in the short term as well. Howarth et al. (2012) use a 20 year Global Warming Potential (GWP) for comparing coal and shale gas because of the supposed urgency of cutting emissions immediately, although they did not clearly provide any such justification in their original paper We believe that the 100 year GWP is more appropriate due to the higher priority we place on long‐term climate change. One could argue the practicality of a 20 year transition, but another could counter with tipping point disaster if the transition was not fast enough. However, we believe this debate is moot: the benefit of substituting methane for CO2 does not diminish as the speed of transition becomes short. Regardless of the rapidity of the transition, substitution of gas for coal and new oil can reduce greenhouse forcing by 40% of that which could be achieved by replacing these fuels with low carbon energy sources such as wind, solar or nuclear. This is demostrated in a paper submitted to G3, whose editor has permitted the draft to be released (see link in Cathles, submitted) because of its importance to the current discussion. This paper computes the greenhouse impact of replacing coal and new oil by natural gas compared to the impact of replacing coal and new oil with low carbon fuels, assuming the replacement takes place over 20, 50 and 100 year periods. After this initial period it is assumed that low carbon energy sources will replace natural gas, and that natural gas replaces 50% of the oil then in use in transportation. The calculations shown here use the greater methane forcings advocated by Shindell and favored by Howarth et al. and assume an efficiency of conversion to electricity of 60% for gas and 32% for coal. In the calculations gas is swapped for coal on an equal electrical output basis but gas is swapped for oil on an equal heat content basis. Figure 2 shows how the greenhouse benefit of gas substitution varies across the full range of leakage rates that have been suggested (up to and including those of Howarth et al.) for various transition durations. It shows that natural gas is a beneficial fuel from the viewpoint of greenhouse substitution no matter how fast the transition so long as the leakage rates do not approach the unreasonably high levels of ~8% suggested by Howarth et al. (2011 and 2012). Howarth et al. raise a completely false conundrum with their claim that substituting natural gas for coal has no value because some yet unknown climatic
Percent warming reduction
tipping point may reached sometime over the next 20 years or so. Even for short transitions (20 years) substituting gas for coal would still be worth doing because at what all but perhaps Howarth et al believe are the current gas leakage rates of 1 to 2% of production, gas substitution would reduce greenhouse forcing by 30 to 40% of that possible by the substitution of low carbon fuels over the same period.
50%
Impact of substituting gas
40% 30% reasonable leakage range
20%
Howarth et al. (2011) 7.9% leakage
10% 0% 0% ‐10%
2%
4%
6%
8%
Percent leakage
Figure 2 The reduction of greenhouse warming attained by substituting natural gas for coal and oil expressed as a percentage of the greenhouse warming reduction possible by substituting of low carbon fuels for all fossil fuels is plotted as a function of the gas leakage rate for three gas substitution intervals. Substitution of natural gas for fossil fuels achieves ~40% or more of the greenhouse benefit of transitioning to low carbon energy sources over the same period provided the leakage is less than ~1%. This figure is similar to Figure 7 in Cathles (submitted) explains the methods used. This figure uses the high methane forcing recommend by Shindell et al (2009) as is also done in Howarth et al. (2011). Exchange of gas for coal is on an equivalent electrical energy production basis; exchange of gas for oil is on an equivalent heat basis. Notice that Howarth et al.’s statement that natural gas is as bad as coal if compared on an electrical generation capacity basis (twice as bad on a heat generation basis) requires both a short substitution time of 20 years and a high leakage rate of ~7.9%.
Comparing the power generating efficiency of coal and gas Gas and coal effectively compete only in the electricity generation market, and therefore the comparison of the two fuels must logically be in terms of the efficiency with which they each make electricity. We therefore find completely puzzling Howarth et al.’s continued insistence on citing other uses of natural gas, such as cooking and home heating, as a justification for comparing natural gas and coal on a heat content rather than electricity‐ generation basis. Society is unlikely to reverse course and install coal‐fired heating and cooking systems in residential, commercial, or industrial facilities. No other life cycle analysis of which we are aware makes this irrelevant and misleading comparison. The superior efficiency of gas in electricity generation doubles the heat content advantage of
gas over coal. We feel that it is simply misleading to continue to cite comparisons between gas and coal on the basis of heat .
Setting the record straight Three other errors in Howarth et al’s reply deserve special mention. First Howarth et al.’s statement in the press release version of their reply that “...Cathles et al. (2012) used the 100 year GWP value of 25 from the IPCC(2001), which underestimates methane’s warming at the century timescale by 33% compared to the more recent GWP value of 33 from Shindell et al (2009)” is incorrect. We state clearly three times in our text (on pages 4, 5, and in the caption of Figure 1) that we use the same 100 year GWP value of 33 that is used by Howarth et al. (2011) and recommended by Shindell et al. (2009). It is difficult to see how this could have been missed in any serious review of our arguments, and in fact this statement is removed in the published version of the reply released by Springer. We comment on this here because of the wide circulation of the “in press” version of their reply that was circulated 16 days before Springer released the official version. In the last two lines of the electronic supplemental materials there is an even more serious distortion. They state: “However, the 90% efficiency for combined heat and electricity production (CHP) using natural gas stated by Cathles et al.‐ without any support by referencing‐ is much higher than other studies. While such efficiencies may be possible, they could correctly be compared to efficiencies of 70% to 80% that are currently observed in some new coal‐fired CHP plants in Denmark (D. .Hughes, pers. Comm.).” This statement makes it appear that we assumed a 90% conversion of natural gas to electricity in our calculations, whereas we in fact assumed a 60% electrical conversion efficiency, and it make it appear we picked this conversion without proper discussion or referencing . What we state in our paper is: “Sixty percent conversion efficiency is not the limit for gas. Combined heat and power (CHP) generation can utilize 90% of the chemical energy in gas. Heat could be likewise used from coal facilities, but small gas units are more cost effective and gas facilities could be built closer to populated user markets that could utilize the heat. Thus gas has a greater CHP potential than coal.” Our intent was to simply indicate that 60% conversion efficiency is not the limit if gas is used for heating as well as electricity generation. Their distortion of this statement is, once again, simply misleading and disingenuous. Lastly, Howarth et al. state “While visiting Cornell, a Shell engineer stated Shell never flares gas during well completion in its Pennsylvania Marcellus operations (Bill Langin, Pers. Comm.).” This evidence is used to bolster their claim that large quantities of gas are vented during shale gas well completion. We checked with Shell and they provided the statement we attach here as footnote threeiii, which states that Howarth’s above statement is a missrepresentation of the conversation that actually took place. According to Langin and Shell, Langin was asked whether “Shell routinely flares during flowback”, to which he replied no, Shell usually puts flowback gases into the pipeline for sales.
Conclusions The data clearly shows that substituting natural gas for coal will have a substantial greenhouse benefit under almost any set of reasonable assumptions. Methane emissions must be five times larger than they currently appear to be before gas substitution for coal becomes detrimental from a global warming perspective on any time scale. The advantage of natural gas applies whether it comes from a shale gas well or a conventional gas well. Scientifically the prescription for reducing green house emissions is clear: substitute gas for coal while minimizing methane emissions using proven and available technology, and then move toward low carbon energy sources as quickly as technically and economically feasible.
References Cited Burnham A, Han J, Clark CE, Wang M, Dunn JB, and Rivera IP (2011) Life‐cycle greenhouse gas emissions of shale gas, natural gas, coal, and petroleum. Environ Sci Technol. http://pubs.acs.org/doi/abs/10.1021/es201942m Cathles LM, Brown L, Taam M, and Hunter A (2012) A commentary of “The greenhouse‐gas footprint of natural gas in shale formations” by RW Howarth, R. Santoro, and A Ingraffea, Climatic Change, DOI 10.1007/s10584‐011‐0333‐0. http://www.springerlink.com/content/x001g12t2332462p/ Cathles, LM (submitted) Assessing the greenhouse impact of natural gas, G3. http://www.geo.cornell.edu/eas/PeoplePlaces/Faculty/cathles/Natural%20Gas/Cathles‐ %20Assessing%20GH%20Impact%20Natural%20Gas.pdf DOE/EIA‐0384(2010) Annual Energy Review 2010, http://www.eia.gov/totalenergy/data/annual/ EPA‐GRI (1997) Methane Emissions from the natural gas industry, Project Summary, Harrison NR, Shires TM, Wessels JK, and Cowgill RM, EPA/600/SR‐96/080. http://www.docstoc.com/docs/19963708/Methane‐Emissions‐from‐the‐Natural‐Gas‐ Industry EPA (2010). Greenhouse Gas Emissions Reporting from the Petroleum and Natural Gas Industry. Background Technical Support Document. U.S. Environmental Protection Agency, Washington DC. http://www.epa.gov/climatechange/emissions/downloads10/Subpart‐W_TSD.pdf EPA (2011) Inventory of greenhouse gas emissions and sinks 1990‐2009, EPA 430‐R‐11‐ 005, 55 phttp://epa.gov/climatechange/emissions/usinventoryreport.html Fulton M, Mellquist N, Kitasei S, and Bluestein J (2011) Comparing greenhouse gas emissions from natural gas and coal. 25 Aug 2011. Worldwatch Institute/Deutsche
Bank. http://lockthegate.org.au/documents/doc‐305‐comparing‐life‐cycle‐ greenhouse‐gas‐db.pdf Harrison M (2012) Revised Attachment 3: Gas well completion emissions data, URS Corporation Report (aka the URS Devon Study), http://anga.us/media/241555/anga‐ axpc%20nsps%20memo%20revised.pdf Howarth RW, Santoro R, and Ingraffea A (in press) Venting and leaking of methane from shale gas development: Response to Cathles et al., Climatic Change. Released at press conference January 19, 2012: http://216.250.243.12/shalegasghgreport.html Howarth RW, Santoro R, and Ingraffea A (2011). Methane and the greenhouse gas footprint of natural gas from shale formations. Climatic Change Letters, doi: 10.1007/s10584‐ 011‐0061‐5. http://www.springerlink.com/content/e384226wr4160653/ Hultman N, Rebois D, Scholten M, and Ramig C (2011). The greenhouse impact of unconventional gas for electricity generation. Environ. Res. Lett. 6: 044008, doi:10.1088/1748-9326/6/4/044008. http://iopscience.iop.org/1748-9326/6/4/044008/ Jiang M., Griffin WM, Hendrickson C, Jaramillo P, vanBriesen, J and Benkatesh A (2011). Life cycle greenhouse gas emissions of Marcellus shale gas. Environ. Res. Lett. 6: 034014, doi:10.1088/1748-9326/6/3/034014. http://iopscience.iop.org/1748-9326/6/3/034014/ Petron G and 29 coauthors (in press) Hydrocarbon emissions characterization in the Colorado Front Range- a pilot study, Jour. Geophys. Res. http://www.agu.org/pubs/crossref/pip/2011JD016360.shtml Shindell DT, Faluvegi G, Koch DM, Schmidt GA, Unger N, and Bauer SE (2009). Improved attribution of climate forcing to emissions. Science 326: 716-718. Skone TJ (2010) Life cycle analysis: natural gas combined cycle (NGCC) power plant, DOE/NETL‐403‐110509, 127p. http://www.netl.doe.gov/energy‐ analyses/pubs/NGCC_LCA_Report_093010.pdf Skone TJ (2011) “Life Cycle Greenhouse Gas Analysis of Natural Gas Extraction & Delivery in the United States”, oral presentation at Cornell University, May 12, 2011, http://cce.cornell.edu/EnergyClimateChange/NaturalGasDev/Documents/PDFs/SKON E_NG_LC_GHG_Profile_Cornell_12MAY11_Final.PDF Tollefson J (2012) Air sampling reveals high emissions from gas field, Nature, 482, 139‐ 140. http://www.nature.com/news/air‐sampling‐reveals‐high‐emissions‐from‐gas‐ field‐1.9982 Venkatesh A, Jaramillo P, Griffin WM, and Matthews HS (2011) Uncertainty in life cycle greenhouse gas emissions from United States natural gas end users and its effects on policy, Environ. Sci. Technol., 45, 8182‐8189. http://pubs.acs.org/doi/abs/10.1021/es200930h
Appendix A: Notes on the construction of Figure 1 Here we offer some brief notes of explanation on the construction of the bars in Figure 1. These calculations convert the data in the source references to the methane vented as a percent of gross natural gas production. The percent leakage is our preferred unit because leakage is the topic of discussion, intuitive, and the obvious target of remedial action.
EPA‐GRI (1997) Second Bar in Figure 1 This is the first EPA inventory of methane emissions. The bars convert the sum of the entries in Table 1 of this reference (which are in Bscf of methane emissions) by dividing by the gross gas production in 1992 assumed by the authors of 22,428 Bscf. Note that the gross gas production equals the dry gas production divided by the fraction methane in natural gas (~0.783; Skone 2011b). From the annual energy review (DOE‐EIA‐ 3834(2010)) the dry gas production in 1992 was 17,840 Bscf methane and a reasonable estimate of the gross gas production would be 17,840/0.783 = 22,784 Bscf.
EPA (2010) Third bar in Figure 1 Appendix A of EPA(2010) gives a detailed accounting of methane emissions during offshore and onshore production, from gas processing plants, during transmission of the gas through pipelines, during temporary storage, during LNG transport and storage, and during distribution. The methane venting (emissions) in each of these categories was summed and divided by the gross gas production in 2006 of 23,632 Bscf. The gross gas production was obtained by dividing the dry gas production in 2006 of 18,504 Bscf from the annual energy review (DOE‐EIA‐3834(2010)) by the methane fraction of the gas (0.783; Skone, 2011b).
EPA (2011) Fourth bar in Figure 1 EPA(2011) tabulates methane emissions in Gg CH4 (or billion kg of CH4) in Table 3‐37. These are converted to methane leakage in percent of gross natural gas production by dividing by the gross gas production in 2009 of 20,580/0.783 = 26,283 Bscf which is converted to 529.97x10⁹ kg by dividing the number of cubic feet per m3 (31.41 cu ft/m3)and multiplying by the density of methane (0.714 kg/m3). The leakage at the well site is greater than in the previous EPA studies (1.17% rather than 0.385%‐ the average of the routine leakage at the well site from the previous two EPA studies), presumably because the EPA assumes a large leakage during well completion and workover of unconventional gas wells, which are now a significant part of the natural gas supply. Since there is no difference between a conventional well and an unconventional well in terms of routine leakage , and no reason the routine leakage should have changed between 2006 and 2009, we take the routine leakage for this bar to be 0.385%. As discussed in the text the EPA analysis of the venting during well completion and workover of unconventional gas wells is flawed and had misled many workers. The EPA should evaluate and revise their EPA(2010) technical support document to reduce the potential for its misinterpretation.
Venkatish et al. (2011) Fifth bar in Figure 1 Venkatish et al. indicate the methane release in their Figure 1 in g CO2e/MJ. We measure these bars and convert first to g CH4/MJ by dividing by the GWP which they assume (25 g
CO2e/g CH4), multiplying by the low heat content of methane (0.9 x 0.055 MJ/kg CH4), and dividing by the fraction of methane in natural gas (0.783). Since Venkatish et al. increase the production venting of shale gas wells by the large assumed releases during well completion and workover, we assume the routine leakage is 0.385% as discussed above.
Skone (2011) First bar in Figure 1 In a Cornell presentation that was analyzed by Hughes (2011), Skone provided data on methane releases during production, processing and transportation of natural gas for onshore and offshore conventional wells, onshore associated (with oil) wells, tight sand vertical wells, gas wells in the unconventional Barnett shale resource, and coal bed methane wells. He tabulates the expected ultimate recovery (EUR) of a typical well in these classes, follows the EPA(2010) in calculating methane emissions to the atmosphere during well completion and workovers (so we don’t use his production numbers), and tabulates methane emissions during processing and transportation in terms of pound of CO2 per Mcf of natural gas production. These latter numbers are converted to the fraction of methane vented by dividing by the density of methane of 44.7 pounds methane per Mcf. We then sum the leakage fractions for the processing and adapt the 604 mile pipeline leakage estimate of 0.4% from Hughes (2011). Losses during distribution are assumed to be 0.22% (the value indicated by the EPA(2010) and Venkatish et al. (2011)), and routine leakage at the well site are taken to be 0.385% of total gross production for reasons discussed above. i The history of the publication of the materials discussed here is complex: On November 12, 2010 Howarth,
Santoro and Ingraffea submitted an article to Climate Change Letters which, broadly speaking, concluded that coal was a cleaner fuel than natural gas in terms of greenhouse emissions. Parts of the article were circulated immediately, and sue to this and the controversial nature of this claim the article received worldwide attention upon its publication early the following year. After thoroughly researching the issue, we wrote a Commentary disagreeing with their conclusion, which we submitted to the same journal on June 20, 2011. Our submission was reviewed and then accepted on October 21, 2011. Publication as well as informal distribution of the full version of our Commentary was, however, embargoed for almost 3 months to allow Howarth et al to prepare their reply. Despite this intention, Springer released our commentary electronically on January 3 while Howarth’s reply was still being processed. On January 19, 2012 Howarth et al. released an “in press” version of their reply in a press conference they called for this purpose. Their reply together with its supplemental material (which we had not seen and had not previously been released) was electronically published by Springer with no announcements February 2.
ii We recognize that leakage numbers will be debated for some time, and emissions estimates will rise and fall
as studies are completed and evaluated. An example is the recent analysis of Petrone of the Denver‐Julesburg Basin (DJB) emissions using air analyses from the Bolder Atmospheric Observatory (BAO)Tower, which has received a lot of very recent attention (Tollefson, 2012). Petrone et al. (in press) predict methane emissions of at least 4% of production‐ about twice those that have been directly measured from flash (stock tank) gas and raw natural gas. There is great uncertainty in this estimate and the direct measurements falls within its error range. But an obvious problem with this study is that the methane and propane measured at the BAO tower is a mix of stock tank and raw natural gas emissions from the DJB basin, assuming that no ambient air is admixed. This is a serious and almost certainly incorrect assumption. If the entrainment of zero‐propane ambient air were half raw natural gas emissions, the natural gas leakage predicted would 2.1% of methane production rather than 4.1%.
iii Statement provided to us by Kimberly Windon, Shell Appalachia Communications Manager: “Shell believes natural gas development can, and must, be done in a responsible manner. Shell has a set of five
global onshore tight/shale oil and gas operating principles that provide a tested framework for protecting water, air, wildlife and the communities in which we operate. In the newly published paper by Cornell Professor Robert Howarth, Shell Appalachia Exploration Manager Bill Langin was misquoted as stating “Shell never flares gas during well completion in its Pennsylvania Marcellus operations.” This statement was not provided to Professor Howarth. In fact, a different question was posed regarding whether Shell “routinely flares during flowback” activities. Bill Langin responded that Shell does not routinely flare flowback from its development wells, which are wells that are going directly into the pipeline for sale. It is important to note that flaring can occur at a Shell site during exploration well tests. This could happen for a number of reasons including there being no pipeline connection available for sending the product to market or the quality of the resource is not of pipeline quality and requires further processing. Shell follows the standards set out by the Pennsylvania Department of Environmental Protection, and also adheres to its operating principles which focus on safety, continuous improvement, collaboration with regulators and engagement with local residents where we strive to be open and transparent about how we operate and the impacts of our activities. Included in Shell’s principles is the company’s commitment to, where permitted, eliminating routine venting. Where venting is required by regulation, we will use vapor recovery units or similar equipment as reasonably practicable at the wellhead.”


![Cornell Alumni News - ECommons@Cornell - Cornell University [PDF]](https://m.moam.info/img/260x300/cornell-alumni-news-ecommonscornell-cornell-univer_6479a260098a9e6d678b45dd.jpg)