GENETICS Response to selection for feed conversion ratio in Japanese quail S. Varkoohi,*†1 M. Moradi Shahr Babak,* A. Pakdel,* A. Nejati Javaremi,* M. zaghari,* and A. Kause† *Department of Animal Science, Faculty of Agriculture, Tehran University, Karaj, Iran; and †Wageningen University and Research Centre, PO Box 338, 6700 AH, the Netherlands ABSTRACT We investigated the effect of selection for 4-wk feed conversion ratio (FCR) on genetic improvement of FCR, BW, weight gain (WG), feed intake (FI), and residual FI (RFI) in Japanese quail. The F line was selected for reduced FCR and the C line was maintained as a randombred control. In each generation, 35 sires and 70 dams were used as parents for the next generation. Three generations of selection were performed. Realized heritability for FCR was calculated as the ratio of cumulative selection response to the cumulative selection differential, and additionally, genetic response was quantified as the difference between the means of selection and control lines. The results showed that realized heritability for FCR after 3 generations
of selection was 0.67. The mean FCR in F line and C line in the last generation was 2.13 and 2.61, respectively. This is 18.4% cumulative genetic improvement, or 6.1% improvement per generation. In the last generation, the means of F and C lines were 193 and 166 g for BW at age 28 d (16.4% total increase, or 5.5% per generation), 184 and 158 g for WG (17.2% total higher gain and 5.7% per generation), 393 and 413 g for FI (4.9% total higher consumption and 1.6% per generation), and −24.5 and 10.2 for RFI (−34.7 g of cumulative gain; −11.6 g per generation), respectively. These results show that selection to decrease FCR increases BW and WG and decreases FI and RFI as a correlated response.
Key words: feed conversion ratio, Japanese quail, selection response, selection experiment 2010 Poultry Science 89:1590–1598 doi:10.3382/ps.2010-00744
INTRODUCTION For many species of livestock, feed costs represent a major part of total production costs. Accordingly, improvement of feed conversion ratio [FCR; feed intake (FI):weight gain (WG)] should be a major objective in most breeding programs. For a long time, genetic improvement of food utilization efficiency in commercial broilers was achieved as a correlated response to selection for increased growth rate (Crawford, 1990). Now there is considerable interest on direct selection for feed utilization efficiency within the poultry industry. Feed conversion ratio is usually measured as the ratio of FI to WG. Thus, it is a composite trait with 2 components. Predicting the effect of direct selection for ratio traits on the component traits is difficult without the knowledge of phenotypic and genetic parameters of the component traits (Gunsett, 1984). For example, selection for improved FCR can either increase growth or decrease FI, or both.
©2010 Poultry Science Association Inc. Received March 2, 2010. Accepted May 9, 2010. 1 Corresponding author:
[email protected]
Several studies on poultry species have estimated genetic parameters for FCR and its component traits (Leenstra et al., 1986; Koerhuis and Hill, 1995; Gaya et al., 2006). The heritability estimates of FCR range from 0.2 to 0.8 (Thomas et al., 1958; Wilson, 1969; Pym and Nicholls, 1979; Chambers et al., 1984; Leenstra et al., 1986) and thus genetic response to selection is expected. However, studies on realized heritabilities for FCR and on correlated genetic gains in the component traits in response to FCR selection are few in poultry (Gill and Washburn, 1974; Pym and Nicholls, 1979). Correlated responses in BW and WG in broilers have been reported by several researchers (Gill and Washburn, 1974; Pym and Nicholls, 1979; Chambers et al., 1984; Leenstra et al., 1986; N’dri et al., 2006). Yet, due to their high commercial importance, most of the studies on FCR genetics have been made on chicken layers and broilers. Because selection for FCR can lead to unpredictable or even unfavorable changes in the component traits, an additional criteria for feed utilization has been developed. Residual FI (RFI) is a measure of feed utilization that is independent of an animal’s current maintenance costs and growth (or production). Residual FI is defined as the difference between actual FI and the expected feed requirements for maintenance of BW and
1590
1591
RESPONSE TO SELECTION IN QUAIL
for growth (Koch et al., 1963; Luiting and Urff, 1991). To our knowledge, there are no publications on the genetic correlation between FCR and RFI in poultry. Here, we analyzed data on a 4-generation selection experiment for improved FCR in Japanese quail (Coturnix coturnix japonica). There are several previous studies on selection for 4-wk BW in quail (Marks, 1993; Anthony et al., 1996; Turkmut et al., 1999; Kaur et al., 2008; Baylan et al., 2009). However, there are no previous studies on selection for FCR and on correlated genetic responses in quail. Accordingly, 3 topics were investigated here using a selection experiment including a randombred control. First, we estimated realized response and heritability in FCR. Second, we estimated correlated genetic gains in WG, FI, and RFI in response to the FCR selection. Third, we assessed which of the separately recorded weeks were the most effected by selection for the whole 4-wk FCR. The study was performed in Iran, where quail is a new species farmed for meat consumption.
MATERIALS AND METHODS Population Structure and Bird Management The experimental Japanese quail population originated from a commercial farming center in Yazd, Iran. Around 1,000 birds were transported to the animal research station of Tehran University. Before the start of the experiment, the population was not selected for any traits. To establish a selection and a control line, first a total of 210 birds were randomly sampled from the population, distributed equally into 2 lines, and allowed to reproduce. Thereafter, the selection line (F line) was selected for FCR measured during a 4-wk trial, and the control line (C line) was a randombred control. Quails were bred for 4 generations, and there were 2 hatches per generation in both lines. Each generation was maintained with 70 families per line, produced by mating 35 sires and 70 dams with a 1:2 (sires:dams) mating ratio. To mate the parents, 2 dams were placed
in 2 floor cages and 1 sire was mating with them every 2 d. In each generation, the same parents were mated with each other twice at 1-wk intervals, to get 2 hatches of offspring. After mating, the dams were moved to special cages (24 × 25 × 20 cm) for egg laying (1 dam in each cage). In the F line, eggs were collected daily and labeled with a dam number. In the C line, eggs were collected without labeling. After 7 d, eggs were placed in the setter for 14 d. Then eggs were transferred to cells in a hatcher tray and were held in the hatcher for 3 d. When chicks hatched, offspring in F line were legbanded and each family was placed into their own cage (35 × 35 × 30 cm). Yet, if family size was greater than 5, the family was equally divided into 2 cages. In the C line, offspring were not leg-banded and they were randomly placed into cages (35 × 35 × 30 cm), each cage always having 5 individuals. In the F line, chicks were individually weighed at weekly intervals at 1, 7, 14, 21, and 28 d of age in each hatch. To record weekly FI in the F line, family level observations were recorded for each week. The feed given for a family was weighed and then reweighed after 7 d of ab libitum consumption. In the C line, all birds of a hatch were weighed together at 1, 7, 14, 21, and 28 d of age. To record weekly FI in the C line, feed provided for the whole hatch was weighed and then reweighed after 1 wk of ab libitum feeding. To select parents for the F line, birds from the dam families with the lowest family FCR were used as parents. In each generation, birds from 30 families (range: 20 to 40) and on average 4 birds from each family (range: 1 to 7) were used. The parents for the C line were randomly selected across the 2 hatches. When chicks hatched, they were not sexed at hatch and were placed in cages for data collection as hatched with sex ratios unknown. The sex of birds was identified at 28 d of age. Before the mating, males and females were kept separately. During the first, second, third, and fourth generations, all birds were fed from 1 to 28 d of age with a 26, 26, 27, and 28% CP diet, respectively, yet the diets
Table 1. Selection response for feed conversion ratio1 Population mean Generation
F2
C3
0 1 2 3 4 Sum
— 2.68 2.46 2.24 2.13
— 2.64 2.58 2.53 2.61
1Realized
heritability = 0.52/0.78 = 0.67 conversion ratio line. 3Control line. 4Means of selected birds. 5Response after correction. 2Feed
Final response5
Response
Selected means4
Selection differential
— 2.37 2.24 1.99 —
— 0.31 0.22 0.25 — 0.78
F
C
— — −0.22 −0.22 −0.11
— — −0.06 −0.05 +0.08
R
— — 0.16 0.17 0.19 0.52
1592
Varkoohi et al.
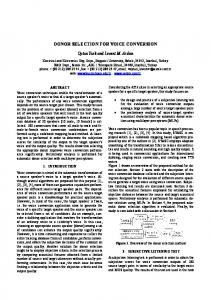
Figure 1. Line means in each generation for feed conversion ratio (FCR): a) FCR 1 to 7 d of age, b) FCR 7 to 14 d of age, c) FCR 14 to 21 d of age, d) FCR 21 to 28 d of age, and e) FCR 1 to 28 d of age. F (F-value) and P (P-value) for the statistical test of line-slope interaction, R2, b(F) (intercept of F line ± SE), and b(C) (intercept of C line ± SE).
always had 2,900 kcal/kg of ME. Water was available ad libitum.
Trait Definitions Weight gains were calculated as the difference between successive BW records. Feed conversion ratio was calculated as the ratio of FI to WG. Residual FI was
calculated as the difference between the observed and expected FI (Luiting and Urff, 1991; Kennedy et al., 1993): RFI = FI − b1 × ABW − b2 × AWG, where FI = the observed FI during a given time period; ABW = the average metabolic BW between 2
RESPONSE TO SELECTION IN QUAIL
1593
Figure 2. Line means in each generation for BW: a) hatch weight, b) BW 7 d of age, c) BW 14 d of age, d) BW 21 d of age, and e) BW 28 d of age. F (F-value) and P (P-value) for the statistical test of line-slope interaction, R2, b(F) (intercept of F line ± SE), and b(C) (intercept of C line ± SE).
recordings (ABW = BW0.75); AWG = the WG during a given period; and b1 and b2 = the regression coefficients for ABW and AWG. Weight gain, FI, FCR, and RFI were calculated for each week separately and across the whole 4-wk trial. Subscripts 1, 7, 14, 21, 28, and 1–28 are used in trait names to indicate weekly and whole trial traits, respectively. Moreover, each BW record (1, 7, 14, 21, and 28 d) was analyzed separately.
Statistical Analysis To evaluate genetic responses, the realized heritability for FCR and the slopes of cumulative genetic responses for all traits were calculated. To do this, line means in each generation were first calculated. The line- and generation-specific means for all traits were calculated using the following model (PROC MIXED, SAS Institute Inc., Cary, NC):
1594
Varkoohi et al.
Figure 3. Line means in each generation for weight gain (WG): a) WG 1 to 7 d of age, b) WG 7 to 14 d of age, c) WG 14 to 21 d of age, d) WG 21 to 28 d of age, and e) WG 1 to 28 d of age. F (F-value) and P (P-value) for the statistical test of line-slope interaction, R2, b(F) (intercept of F line ± SE), and b(C) (intercept of C line ± SE).
Yijklm = μ + Li + Hj + Gk + Gk × Hj + Gk × Li + Hj × Li + fSexl + eijklm, where Yijklm = the observations for a trait; μ is the overall mean; Li = the fixed effect of ith line; Hj = the fixed effect of jth hatch; Gk = the fixed effect of kth generation; Gk × Hj = the fixed interaction of Gk and Hj; Gk × Li = the fixed interaction of Gk and Li; Hj
× Li = the fixed interaction of Hj and Li; fSexl = the continuous fixed regression term of average sex ratio of family (in F line) or hatch (in C line); and eijklm = the random error term. In the model, the least squares means for the Gk × Li interaction were used in the further analysis. Two analyses were conducted using the line and generation-specific means. First, realized heritability for FCR was calculated as the ratio of the cumulative se-
RESPONSE TO SELECTION IN QUAIL
1595
Figure 4. Line means in each generation for feed intake (FI): a) FI 1 to 7 d of age, b) FI 7 to 14 d of age, c) FI 14 to 21 d of age, d) FI 21 to 28 d of age, and e) FI 1 to 28 d of age. F (F-value) and P (P-value) for the statistical test of line-slope interaction, R2, b(F) (intercept of F line ± SE), and b(C) (intercept of C line ± SE).
lection response to the cumulative selection differential (Falconer and Mackay, 1996). Second, for each line, a regression slope of generation means against increasing generation number was calculated (Falconer and Mackay, 1996), and an analysis of covariance was used to test for the differences in the slopes between F and C lines. The analysis of covariance model used was as follows:
Yik = Li + b0Genk + Li × b1Genk + eik, where Yik = the observations for trait i; b0Genk = the overall fixed regression term across the generations k; Li × b1Genk = the interaction of the lines with the regression slope against generation numbers; and eik = the random error. A significant Li × b1Genk interaction
1596
Varkoohi et al.
Figure 5. Line means in each generation for residual feed intake (RFI): a) RFI 1 to 7 d of age, b) RFI 7 to 14 d of age, c) RFI 14 to 21 d of age, d) RFI 21 to 28 d of age, and e) RFI 1 to 28 d of age. F (F-value) and P (P-value) for the statistical test of line-slope interaction, R2, b(F) (intercept of F line ± SE), and b(C) (intercept of C line ± SE).
indicates that the F and C lines have differing slopes and thus the lines have divergent selection responses.
RESULTS AND DISCUSSION Realized Heritability Realized heritability for FCR after selection for 3 generations was 0.67 (Table 1). The mean FCR in the F line and C line in the last generation were 2.13 and
2.61, respectively. This is 18.4% cumulative genetic improvement, or 6.1% improvement per generation. The results showed that genetic improvement in FCR was 0.16, 0.17, and 0.19 for generations 2, 3, and 4, respectively (Table 1). For FCR1–28, the slopes of mean performance against generation number differed significantly between the F and C lines (Figure 1e). The slopes showed that FCR1–28 in the F line decreased by 0.18 points per generation, whereas in the C line the slope was close to zero (−0.01). The slope for the F
1597
RESPONSE TO SELECTION IN QUAIL
line is consistent with the genetic responses estimated in Table 1. Our results for weekly FCR showed that the line × generation interaction was significant at all weeks, the slopes for the F line showing that weekly FCR were decreasing in all cases (Figure 1). These results together show high realized genetic responses for FCR selection. In broilers, realized heritability estimates for FCR have generally been from 0.18 to 0.56 with a mean of about 0.25 (Gill and Washburn, 1974; Pym and Nicholls, 1979).
Correlated Response in Growth The results showed that selection for FCR resulted in a correlated response especially in BW and WG, and in lesser degree in FI. Both BW28 (Figure 2e) and WG1–28 (Figure 3e) showed a significant line × generation interaction for the slopes. Body weight and WG increased across generations in the selection line but remained stable in the control line. Mean BW in the F line and C line in the last generation were 193 and 166 g, respectively. This represents 16.4% total increase, or 5.5% per generation. These results indicate that FCR and BW are favorable correlated. Improved FCR to a certain BW could be partially due to lower maintenance costs and lower fat deposition of birds with higher growth rate (Pym, 1990). Buyse et al. (1999) found that selection for low FCR in broiler chickens resulted in indirect selection for carcass leanness. Improved FCR to a certain BW could be partially due to lower maintenance cost and lower fat deposition of birds with a higher growth rate. Knizetova (1996) found that in quail selection for live weight at 4 wk of age there was improved growth rate and feed efficiency (WG:FI). Our results for weekly BW showed that the line × generation interaction for the slopes was significant in 3 out of 5 cases (hatch weight, BW7, and BW28; Figure 2a, b, and e, respectively). Interestingly, even hatch weight displayed significant correlated response. Selection for 4-wk BW is known to increase egg weight and hatch weight, and rapid growth at later life may be related to rapid embryonic growth (Anthony et al., 1989, 1996). Means of WG1–28 for the F line and C line in the last generation were 184 and 158 g, respectively (17.2% total higher gain; 5.7% per generation). The increased WG contributes to the improved FCR. For separate weekly WG, the line × generation interaction was significant only in the first week, again indicating that early growth in particular was affected. In line with our results, sib analysis and parent-offspring estimates for the genetic correlation between WG and FCR have ranged from −0.25 to −0.70 (Wilson, 1969; Pym and Nicholls, 1979). Similarly, Chambers et al. (1984) obtained an estimate of +0.69 for the genetic correlation between WG and feed efficiency (WG:food consumption).
Correlated Response in FI and RFI The results showed that direct selection to decrease FCR affected FI less than BW and WG. Total FI1–28 showed a significant line × generation interaction, FI being reduced in the F line but remaining more or less stable in the control line (Figure 4e). Mean FI1–28 in the F line and C line in the last generation were 393 and 413 g, respectively. The results show that selection line has lower FI compared with the control line. This corresponds to 4.9% total higher consumption, or 1.6% per generation. This is a considerably smaller genetic response compared with those of WG and BW. Similarly, none of the weekly FI exhibited a significant line × generation interaction (Figure 4a, b, c, and d). This indicates that small improvements throughout the growing period accumulated to a minor but significant reduction in total FI1–28 in response to FCR selection. In our study, RFI1–28 displayed a significant line × generation interaction, RFI reducing in the F line (Figure 5e). This is logical because BW and WG were increasing and FI decreasing from generation to generation. Mean RFI1–28 in the F line and C line in the last generation were −24.5 and 10.2 g, respectively (−34.7 g improvement; −11.6 g per generation). For weekly RFI, the line × generation interaction was significant in 2 out of 4 cases (RFI in the first and third week; Figure 5). Thus, selection for decreased FCR also decreased RFI. These results together mean that the selected birds consumed less feed than the control birds, in relation to their metabolic maintenance costs and WG.
ACKNOWLEDGMENTS We thank Johan van Arendonk from Wageningen University (the Netherlands) for providing a chance to extend the work.
REFERENCES Anthony, N. B., E. A. Dunnington, and P. B. Siegel. 1989. Embryo growth of normal and dwarf chickens from lines selected for high and low 56-day body weight. Arch. Geflugelkd. 53:116–122. Anthony, N. B., K. E. Nestor, and H. L. Marks. 1996. Short-term selection for four-week body weight in Japanese quail. Poult. Sci. 75:1192–1197. Baylan, M., S. Canogullari, A. Sahin, G. Copur, and M. Baylan. 2009. Effects of different selection methods for body weight on some genetic parameters. J. Anim. Vet. Adv. 8:1385–1391. Buyse, J., F. R. Leenstra, M. Zeman, G. Rahim, and E. Decuypere. 1999. A comparative study of different selection strategies to breed leaner meat-type poultry. Poult. Avian Biol. Rev. 10:121–142. Chambers, J. R., D. E. Bemon, and J. S. Gavora. 1984. Synthesis and parameters of new populations of meat-type chickens. Theor. Appl. Genet. 69:23–30. Crawford, R. D. 1990. Nutritional genetics. Pages 847–876 in Poultry Breeding and Genetics. Elsevier, Amsterdam, the Netherlands. Falconer, D. S., and T. F. C. Mackay. 1996. Introduction to Quantitative Genetics. 4th ed. Longman, London, UK. Gaya, L. G., J. B. M. Ferraz, F. M. Rezende, G. B. Moura, E. C. Mattos, J. P. Eler, and M. Filho. 2006. Heritability and genetic
1598
Varkoohi et al.
correlation estimates for performance and carcass and body composition traits in a male broiler line. Poult. Sci. 85:837–843. Gill, R. A., and K. W. Washburn. 1974. Genetic changes in efficiency of feed utilization of chicks maintaining body weight constant. Poult. Sci. 53:1146–1154. Gunsett, F. C. 1984. Linear index selection to improve traits defined as ratios. J. Anim. Sci. 59:1185–1193. Kaur, S., A. B. Mandal, K. B. Singh, and M. M. Kadam. 2008. The response of Japanese quails (heavy body weight line) to dietary energy levels and graded essential amino acid levels on growth performance and immuno-competence. Livest. Sci. 117:255– 262. Kennedy, B. W., J. H. Van der Werf, and T. H. Meuwissen. 1993. Genetic and statistical properties of residual feed intake. Anim. Sci. 71:3239–3250. Knizetova, H. 1996. Growth and carcass traits of Japanese quail. Zivoc. Vyroba. 41:225–233. Koch, R. M., L. A. Swiger, D. Chambers, and K. E. Gregory. 1963. Efficiency of feed use in beef cattle. J. Anim. Sci. 22:486–494. Koerhuis, A. N. M., and W. G. Hill. 1995. Predicted response in food conversion ratio for growth by selection on the ratio or on linear component traits, in a (sequential) selection program. Br. Poult. Sci. 37:317–327. Leenstra, F. R., P. F. G. Vereijken, and R. Pit. 1986. Fat deposition in a broiler sires strain. 1. Phenotypic and genetic variation in, and correlations between, abdominal fat, body weight and feed conversion. Poult. Sci. 65:1225–1235.
Luiting, P., and E. M. Urff. 1991. Residual feed consumption in laying hens. 2. Genetic variation and correlations. Poult. Sci. 70:1663–1672. Marks, H. L. 1993. Carcass composition, feed intake and feed efficiency following long term selection four week body weight in Japanese quail. Poult. Sci. 72:1005–1011. A. L., S., N. Mignon-Grasteau, M. Sellier, Tixier-Boichard, and C. Beaumont. 2006. Genetic relationships between feed conversion ratio, growth curve and body composition in slow growing chickens. Br. Poult. Sci. 47:273–280. Pym, R. A. E. 1990. Nutritional genetics. Pages 847–876 in Poultry Breeding and Genetics. R. D. Crawford, ed. Elsevier, Oxford, UK. Pym, R. A. E., and P. J. Nicholls. 1979. Selection for food conversion in broilers: Direct and correlated responses to selection for body weight gain, food consumption and food conversion ratio. Br. Poult. Sci. 20:73–86. Thomas, C. H., W. L. Blow, G. C. Cockreham, and E. W. Glazener. 1958. The heritability of body weight, gain, feed consumption and feed conversion in broilers. Poult. Sci. 37:862–869. Turkmut, L., O. Altan, I. Oguz, and S. Yalcin. 1999. Effects of selection for four week body weight on slaughter, carcass, and abdominal fat and some organ weights and blood serum parameters in Japanese quail. Turk. J. Vet. Anim. Sci. 23:63–68. Wilson, S. P. 1969. Genetic aspects of feed efficiency in broilers. Poult. Sci. 48:487–495.