In this paper, an algorithm which detects Macular Edema from OCT images has ..... Retinal Layers in SDOCT Images Congruent with Expert Manual Segmentationâ, #131667, Vol.18 No.18, Optic Express, 27th ... Rafeal C. Gonzalez, Richard E. Woods. âDigital Image Processingâ, 3rd Edition, Chapter 9, 10 & 11, pp. 627-833.
IOSR Journal of VLSI and Signal Processing (IOSR-JVSP) Volume 7, Issue 2, Ver. I (Mar. - Apr. 2017), PP 47-52 e-ISSN: 2319 – 4200, p-ISSN No. : 2319 – 4197 www.iosrjournals.org
Retinal Macular Edema Detection Using Optical Coherence Tomography Images P. Danya1, Sheela N. Rao2 1
(Final Year, M.Tech - BMSP&I, Dept. of IT, SJCE, Mysuru.) 2 (Assistant Professor, Dept. of IT, SJCE, Mysuru.)
Abstract: Macular Edema affects around 20 million people of the world each year. Optical Coherence Tomography (OCT), a non-invasive eye-imaging modality, is capable of detecting Macular Edema both in its early and advanced stages. In this paper, an algorithm which detects Macular Edema from OCT images has been presented. Initially the images are filtered to de-noise them. Then, the retinal layers - Inner Limiting Membrane (ILM) and Retinal Pigment Epithelium (RPE) are segmented using Graph Theory method. Region splitting is performed on the OCT scan and the thickness between the two layers in the different regions are determined. Area enclosed between the two layers is also estimated. Support Vector Machine, a binary classifier is used to draw a classification between normal and abnormal OCT scans. Region-wise thickness, a few Haralick’s features, area between ILM and RPE and a few wavelet features are used to train the classifier. The classifier yielded an accuracy of 95% and a sensitivity of 100%. Thus, this algorithm can be used by ophthalmologists in early detection of Macular Edema. Keywords: Macular Edema (ME), Optical Coherence Tomography (OCT), Thickness, Area, Textural Features, Discrete Wavelet Transform (DWT), Support Vector Machine (SVM), Confusion Matrix.
I.
Introduction
The organ of vision which helps us perceive the vital sense of sight is the human eye. Retina, a layer of the human eye is responsible for vision. Several diseases may affect the retina and the severity may vary from blurred vision to vision loss. A small portion of the retina, macula, is responsible for detailed central vision. Swelling or thickening of the macula is called Macular Edema (ME). Macular Edema is frequently associated with diabetes, where blood vessels in the retina begin to leak fluids, including small amounts of blood into the retina. This leakage causes macular swelling resulting in Diabetic Macular Edema (DME). ME that develops after cataract surgery is called Cystoid Macular Edema (CME). Approximately 20 million people in the world are affected by Macular Edema every year. Among the various imaging modalities used to detect ME, Optical Coherence Tomography (OCT) is capable of detecting the abnormality in its early stages. Optical Coherence Tomography, works similar to ultrasound imaging; in ultrasound imaging, sound waves are used while in OCT scan, light beams are used in a similar fashion [1]. In OCT imaging, a low coherence visible light penetrates the retina. This light beam is reflected back, recombined and detected using the detector [2].Optical Coherence Tomography is capable of providing consistent macular thickness value over repeated visits [3]. This consistency in metrics plays a prime role in monitoring patients’ progress over time [3]. The total volume occupied by the Cystoid Macular Edema was evaluated using a method as it served as a good metric for evaluation of visual acuity and the overall sensitivity was found to be 91% [4].Retinal layer segmentation was done by using a canny edge detection filter followed by a LOG filter and also by Graph Theory method [5]. Among these, the second method was found to give better results. An automated method was presented to segment and quantify the cystoid volume for abnormal retina with macular hole which resulted in a good accuracy rate of 99.7% [6]. A high accuracy and reproducibility were demonstrated when a dual-scale gradient information was used for layer segmentation of macular OCT images [7]. A fully automated assessment of Macular Edema from OCT images using Discriminant Analysis classifier has also been reported [8]. In a review conducted on OCT and Fundus photography, it was observed that it was difficult to detect early macular edema from fundus images while the same can be prominently observed from OCT images [9]. This paper focuses on detection of Macular Edema from OCT images using an algorithm developed in MATLAB. The OCT images are segmented based on graph search method and the retinal thickness is evaluated. The area enclosed between the ILM and RPE layers is estimated for all the images. Further, a few textural features and a few wavelet of the image are extracted. The classification between normal and diseased images is drawn using Support Vector Machine (SVM) classifier. In this paper the method involved in the algorithm is discussed in the following sequence: preprocessing, segmentation, thickness evaluation, area estimation, feature extraction and classification. The experimental results and the conclusions are discussed in the final sections. DOI: 10.9790/4200-0702014752
www.iosrjournals.org
47 | Page
Retinal Macular Edema Detection Using Optical Coherence Tomography Images II.
Methodology
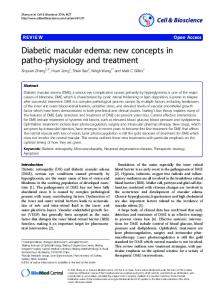
The Macular Edema detection algorithm takes the sequence of steps shown in the block diagram (Fig.1).
Fig.1. Block Diagram of ME Detection 2.1. ROI Extraction: Initially, the images in the dataset are read by the algorithm. The input images are cropped to extract the OCT region i.e., our Region of Interest (ROI) eliminating the undesired regions. The OCT region is then subjected to further processing. The original image is shown in Fig.2 and the ROI of the image is shown in Fig.3.
Fig.2. Original Image
Fig3. Region of Interest 2.2. Pre-processing: The original OCT image consists of all the three colour components namely red, green and blue (RGB). For ease of medical image processing, the RGB image is converted into grayscale image. The gray-scale image is shown in Fig.4. This gray image is then filtered using a median filter of window size 5*5 in order to remove noise and smoothen the image. The average Peak Signal to Noise Ratio of the filtered and gray images is 24.5597 dB. The filtered image is shown in Fig.5. DOI: 10.9790/4200-0702014752
www.iosrjournals.org
48 | Page
Retinal Macular Edema Detection Using Optical Coherence Tomography Images
Fig.4. Grayscale Image
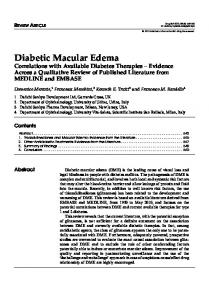
Fig.5. Median Filtered Image 2.3. Segmentation: The retina is a ten layered structure. Out of the ten layers, two of the layers are segmented and plotted in the algorithm. These two layers are Inner Limiting Membrane (ILM) and Retinal Pigment Epithelium (RPE). Each OCT image is represented in terms of nodes, where each node corresponds to a pixel. Edges are the links connecting the nodes. A set of connected edges forms a path that can be used to traverse across the graph [9]. Edge weights are assigned to make each pixel different from its neighbouring pixel. To move across the graph form one node to another, the path with a minimum total weight sum is desirable. The path that results is the cut which separates one region from another. To trace this required path, Dijkstra’s shortest path search algorithm is used to divide the image graph into layers. The necessary layers are then plotted. The result of segmentation and plots of ILM and RPE layers is shown in Fig.6.
Fig.6. Segmentation of ILM and RPE 2.4. Feature Extraction: The features extracted from the OCT images fall into four broad categories; namely, thickness of the OCT scan, area enclosed by the retinal layers (ILM and RPE), textural features and wavelet features. A total of 13 features are extracted in this work. 2.4.1. Thickness Evaluation: When the average thickness of the entire image was evaluated, the resulting thickness did not show much variation between normal and diseased images. This shortcoming is overcome by splitting the segmented images into five equal regions such that the central region consists of the fovea of the macula (Fig.7). This region splitting can be attributed to the fact that macular edema or macular inflammation is prominent in the foveal region. The average thickness of each region between the ILM and the RPE is evaluated. The thickness measure of the foveal region is comparatively higher for the images that have inflammation (edema) and lesser for normal images.
Fig.7. Region-splitting for Thickness Evaluation DOI: 10.9790/4200-0702014752
www.iosrjournals.org
49 | Page
Retinal Macular Edema Detection Using Optical Coherence Tomography Images 2.4.2. Area Estimation: The Inner Limiting Membrane (ILM) and the Retinal Pigment Epithelium (RPE) layers of the retina enclose the area covered by the macula of the retina in the OCT scan. Due to the inflammation of the macula in case of Macular Edema, the area enclosed by these two layers is comparatively larger than the same in case of normal eye. The results of the segmentation stage i.e., the plot of ILM and RPE (Fig.6) are considered as the curves representing the layers. Using Area Under the Curve (AUC) technique, the area between the ILM and RPE layers were estimated and this metric is used as one of the parameters to train the classifier. 2.4.3. Haralick’s Textural Feature Extraction: Texture is an important characteristic used in identifying objects or regions in an image [11].The texture information is adequately specified in a set of gray-tone spatial-dependency matrices (Gray Level Cooccurrence Matrix – GLCM [12]) which are computed for various angular relationships between neighboring cell pairs in the image. From the matrix, a number of textural features of a given image can be computed. A few of these features are extracted from the OCT images viz.,Energy, Contrast, Homogeneity and Entropy using equations (1) through (4). In addition to the region-wise thickness and the area between layers, the textural features also play a major role in training the machine learning model to classify between normal and macular edema affected OCT scans. … (1) … (2) … (3) … (4) where pi, jis the probability elements of the GLCM of size M*N. 2.4.4. Wavelet Feature Extraction: Both the spatial and frequency information are captured by the Discrete Wavelet Transform (DWT) [13]. In DWT, the image is analysed by decomposing it into coarse approximations using low-pass and highpass filtering. Each image may be represented as a p × q gray-scale matrix I[i,j], where each element of the matrix represents the grayscale intensity of one pixel of the image. Eight different pixels surround and form the neighbouring pixels to each non-border elements of the matrix. Typically, these eight neighbouring elements are used to traverse the matrix. We consider four decomposition directions of the matrix viz., horizontal (Dh), two diagonals (Dd) and vertical (Dv) because the resulting 2-dimensional DWT co-efficients are the same irrespective of the direction of being traversed (left-to-right or right-to-left). The first level of wavelet decomposition yields four co-efficient matrices, namely, A1, Dh1, Dv1, and Dd1 [13]. As a single numerical value as a feature of the entire image is desired, averaging methods are employed to obtain the necessary single values. Equations (5) and (6) determine the averages of the corresponding pixel intensities, whereas (7) is an averaging of the energy of the pixel intensities. Bi-orthogonal 3.7 (‘bior3.7’) wavelet filter is used for decomposition. … (5) … (6) … (7) 2.5. Classification: The binary classification of the images into normal and diseased is performed by using linear Support Vector Machine (SVM) classifier. SVMs are supervised learning models used for data classification [14]. The SVM model is trained using a dataset with samples labelled with the class they belong to. Here, normal OCT images belong to class 0 and edema affected OCT images belong to class 1. The SVM model is being trained with 13 features namely, five region-wise thickness measures, area of fluid between ILM and RPE layers, four textural features – energy, contrast, homogeneity and entropy, three wavelet features from level 1 decomposition – two averages and energy. The training dataset consists of 21 normal OCT scan images and 14 Edema OCT scan images. So, a total of 35 OCT images are used to train the SVM classification model. Once trained, the SVM model is tested on 20 OCT images containing 10 normal and 10 diseased images. The classification results were 95% accurate DOI: 10.9790/4200-0702014752
www.iosrjournals.org
50 | Page
Retinal Macular Edema Detection Using Optical Coherence Tomography Images with 19 of 20 samples classified perfectly and 1 outlier sample which was misclassified. The Receiver Operating Characteristic (ROC) or Confusion Matrix of the SVM classification results is shown in Table.1.
III.
Experimental Results
The segmentation algorithm discussed in section 2.3 yielded results with an accuracy of 84.78%. A total of 46 OCT scan images containing 26 normal images and 20 images affected by Macular Edema were segmented for ILM and RPE layers using this algorithm. Among the 46 images, 39 images were accurately segmented whereas 7 images failed to yield accurate layer segmentation. A total of 20 OCT scan images have been tested using this technique, where 10 were normal and 10 were abnormal images. Out of 20, 1 normal image was classified as abnormal (False Positive). The confusion matrix for the classification is shown in Table 1.
Observed Response
Table 1. Confusion Matrix for Classification Results Known / True Condition Object Absent Object Present Object Not Observed
True Negative (TN) 9
False Negative (FN) 0
Object Observed
False Positive (FP) 1
True Positive (TP) 10
The accuracy, sensitivity, specificity and precision of the classification results shown in the confusion matrix (Table 1) are calculated using equations (8), (9), (10) and (11). … (8) … (9) … (10) … (11) The number of test images, classification results and the corresponding accuracy, sensitivity, specificity and precision are shown in Table 2. Table 2. Classification Results No. of Test Images No. of Normal Images No. of Abnormal Images True Positive (TP) True Negative (TN) False Positive (FP) False Negative (FN) Accuracy Sensitivity Specificity Precision
IV.
20 10 10 10 9 1 0 95% 100% 90% 90.90%
Conclusion
A novel Macular Edema detection algorithm has been developed and presented. An image data set consisting of both normal and edema affected OCT scan images are considered to test and validate the proposed technique. The OCT scan images are acquired using a Spectral OCT SLO equipment from Combination Imaging System. The images are initially pre-processed by median filtering to remove the noise present. Then the retinal layers: Inner Limiting Membrane (ILM) and Retinal Pigment Epithelium (RPE) are acquired using a graphtheory based segmentation algorithm. An accuracy of 84.78% was obtained with a satisfactory amount of DOI: 10.9790/4200-0702014752
www.iosrjournals.org
51 | Page
Retinal Macular Edema Detection Using Optical Coherence Tomography Images visually acceptable contours. The segmented OCT image is split into five equal regions column-wise such that the third and central region consists of the fovea of the macula. Typically the inflammation in Macular Edema is prominent in the foveal region. The average thickness between ILM and RPE layers are evaluated for each of the five regions for all the images. The area of fluid accumulation i.e., the area enclosed by ILM and RPE is then estimated using Area Under the Curve technique considering the segmentation results co-ordinates for ILM and RPE layers. Further, a few textural features and a few wavelet features of the images were extracted. So a total of 13 features are extracted from each OCT image. A linear Support Vector Machine (SVM) model is trained with the data and used to classify between normal and diseased image samples. An accuracy of 95%, sensitivity of 100%, specificity of 90% and a precision of 90.90% are observed from the classification results.
Acknowledgements We whole heartedly thank Dr. Pallavi Prabhu and Mr. Arun Kumar (Technician), Sushrutha Eye Hospital, Mysuru for readily providing us with OCT scan images required for our work.
References [1]. [2]. [3]. [4]. [5].
[6]. [7].
[8]. [9]. [10].
[11]. [12]. [13]. [14].
James G. Fujimoto, Costas Pitris, Stephen A. Boppart, Mark E. Brezinski. “Optical Coherence Tomography: An Emerging Technology for Biomedical Imaging and Optical Biopsy”. Neoplasia vol. 2, pp. 9-25, January-April 2000. Joel S. Schuman. “Introduction to Optical Coherence Tomography”, 5 October, 2012. Eric H. Broecker, Mark T. Dunbar. “Optical Coherence Tomography: its clinical use for the diagnosis, pathogenesis, and management of macular conditions”. Optometry, Elsevier. vol.76, no.2, pp. 79-101. February, 2005. Gary R. Wilkins, Odette M. Houghton, Amy L. Oldenburg. “Automated Segmentation of Intraretinal Cystoid Fluid in Optical Coherence Tomography”. IEEE Trans Biomed Eng. vol. 59(4), pp. 1109-1114, April 2012. Appaji M. Abhishek, Tos T.J.M. Berendschot, Shyam Vasudeva Rao, Supriya Dabir. “Segmentation and nalysis of Retinal Layers (ILM & RPE in Optical Coherence Tomography Images with Edema”. 2014 IEEE Conference on Biomedical Engineering and Sciences. pp. 204-209, 8 – 10 December, 2014. Li Zhang, Weifang Zhu, Fei Shi, Haoyu Chen, Xinjian Chen. “Automated Segmentaion of Intraretinal Cystoid Macular Edema for Retinal 3D OCT Images with Macular Hole”, IEEE, pp. 2374-8, 2015. Qi Yang, Charles A. Reisman, Zhenguo Wang, Yasufumi Fukuma, Masanori Hangai, Nagahisa Yoshimura, Atsuo Tomidokoro, Makoto Araie, Ali S. Raza, Donald C. Hood, Kinpui Chan. “Automated Layer Segmentation of Macular OCT Images using dualscale gradient information”, Optical Society of America, Opt Express, 18(20), 27 September 2010. Bilal Hassan, Gulistan Raja. “Fully Automated Assessment of Macular Edema using Optical Coherence Tomography (OCT) Images”. IEEE Digital Library, 2016. Taimur assan, M. Usman Akram, Bilal Hassan, Ammara Nasim, Shafaat Ahmed Bazaz. “Review of OCT and Fundus Images for Detection of Macular Edema”. IEEE Digital Library, 2015. Stephnie J. Chiu, Xiao T. Li, Peter Nicholas, Cynthia A. Toth, Joseph A. Izatt, Sina Farsiu. “Automatic Segmentation of Seven Retinal Layers in SDOCT Images Congruent with Expert Manual Segmentation”, #131667, Vol.18 No.18, Optic Express, 27th August 2010. Robert M. Haralick, K. Shanmugam, Its’hak Dinstein. “Textural Features for Image Classification”, IEEE Transactions on Systems, Man and Cybernetics, Vol SMC -3, No. 6, pp. 610-621, November 1973. Rafeal C. Gonzalez, Richard E. Woods. “Digital Image Processing”, 3rd Edition, Chapter 9, 10 & 11, pp. 627-833., ISBN: 978-81317-2695-2, Prentice Hall © 2009. Sumeet Dua, U. Rajendra Acharya, Pradeep Chowriappa and S. Vinitha Sree. “Wavelet-Based Energy Features for Glaucomatous Image Classification”, IEEE Transactions On Information Technology In Biomedicine, Vol. 16, No. 1, January 2012. Corinna Cortes, Vladimir Vapnik. “Support-Vector Networks”, Machine Learning, 20(3), pp. 273-297, 1995.
DOI: 10.9790/4200-0702014752
www.iosrjournals.org
52 | Page