by means of sequential search and retrieval by means of a single step of parallel ..... ing of each participant revealed what appeared to be universal compliance.
Copyright 2001 by the American Psychological Association, Inc. 0278-7393/01/$5.00 DOI: 10.1037//0278-7393.27.2.384
Journal of Experimental Psychology: Learning, Memory, and Cognition 2001, Vol. 27, No. 2. 384-413
Retrieval Processes in Recognition and Cued Recall Peter A. Nobel and Richard M. Shiffrin Indiana University Bloomington The present studies used response time (RT) and accuracy to explore the processes and relation of recognition and cued recall. The studies used free-response and signal-to-respond techniques and varied list length and presentation rate. In Experiment 1, the free-RT distributions for recognition had much lower mean and variance than those for cued recall. Similarly, signal-to-respond curves showed fast rates of accumulation of information in recognition and slow rates in recall. (Quantitative models of the results are presented in the companion article by D. E. Diller, P. A. Nobel, and R. M. Shiffrin, 2001). To rule out the possibility that the slower responses in cued recall were due to a fast retrieval process followed by a slow process of cleaning up the retrieved trace for output, additional signal-to-respond tasks provided the relevant alternatives at test. Yet, these conditions showed slow growth rates, similar to those seen in recall. The results support the hypothesis that retrieval processes differ for single-item recognition and cued recall, with retrieval in cued recall (and associative recognition) due to a sequential search.
and a shortened distractor task between study and test (e.g., Shepard, 1967). In contrast, (a) words that have a higher natural language frequency increase recall accuracy (at least for lists of one frequency; see Gillund & Shiffrin, 1984) but decrease recognition accuracy (e.g., Deese, 1960; Hall, 1979); (b) instructions for maintenance rehearsal improve recognition accuracy (Glenberg & Adams, 1978) but do not substantially change recall accuracy (e.g., Dark & Loftus, 1976); and (c) strengthening some list items (either by extra study time or extra repetitions) harms the free recall of other items, does not much alter cued recall of other items, or may even slightly help the recognition of other items (Ratcliff, Clark, & Shiffrin, 1990; Shiffrin, Ratcliff, & Clark, 1990). Whether these findings concerning accuracy of report support similar or different retrieval mechanisms for recall and recognition remains an open question because models of both types have been developed that account for many, if not all, of these results.
The present studies used both response time (RT) and accuracy to explore the processes and relation of recognition and cued recall. The focus of this article is what is termed explicit or episodic memory. Experiment 1 reports free-response and signalto-respond results for single-word recognition and cued recall (a quantitative model for these results is provided in the companion article by Diller, Nobel, and Shiffrin [2001]). Experiments 2 and 3 explore the relation between various types of recognition and cued recall and present additional evidence that the retrieval processes used in these paradigms differ qualitatively. Recognition and recall have been studied for many years, but the similarity of the processes that underlie them remains a matter of debate. In the present research project we collected and analyzed distributions of RTs, and accuracy in signal-to-respond procedures, in single-word, paired, and associative recognition, and in cued recall, in the hope that such measures would illuminate the similarities and differences between retrieval processes used in these cases. Whether recognition and recall are accomplished by similar retrieval processes is presently an open question. For some variables manipulated in memory paradigms, recognition and recall respond in a similar fashion, whereas for others, the results differ. For example, the accuracy of recognition and recall is improved by increased study time (e.g., Ratcliff & Murdock, 1976; Shiffrin, 1970), decreased list length (e.g., Roberts, 1972), lessened delay,
Another line of evidence that sometimes is used to argue for different retrieval in recall and recognition is based on studies in which a given word is tested successively for recognition and recall (e.g., Flexser & Tulving, 1978). Study typically takes place in a pair setting in which a cue leads with high probability to a response (e.g., glass-VASE). In later tests, a word (e.g., VASE) may not be recognized as having been presented but then is recalled when prompted with the studied cue (e.g., glass). Attempts have been made to argue for independent retrieval in such cases, but such conclusions are hotly contested, and models for the results include cases in which essentially the same retrieval operation for recall and recognition can produce the results (e.g., Metcalfe, 1991; her composite holographic associative recall model (CHARM) assumes storage of both single-word information and pair information, with a recall probe accessing the pair information and a recognition probe accessing the single-word information).
Peter A. Nobel and Richard M. Shiffrin, Department of Psychology, Indiana University Bloomington. Peter A. Nobel is now at Microsoft Corporation, Seattle, Washington, and is now named Peter A. Koss-Nobel. The research in this article was submitted by Peter A. Nobel in partial fulfillment of the requirements for a PhD in psychology at Indiana University Bloomington. Funding for this research was provided by National Institute of Mental Health Grant MH12717. Correspondence concerning this article should be addressed to Richard M. Shiffrin, Department of Psychology, Indiana University Bloomington, Bloomington, Indiana 47405. Electronic mail may be sent to shiffrinO indiana.edu.
The difficulty of coming to definitive conclusions on the basis of accuracy results motivated us to take a careful look at RTs. RT measures can be particularly useful in illuminating the similarities and differences between the retrieval mechanisms that operate in recognition and recall. Free recall requires the participant to output 384
RETRIEVAL PROCESSES
as many items as possible from the previous list, in any order. This is a sequential task that is spread out in time, typically over several minutes at least, with the time between successive recalls tending to grow to many seconds as the recall period proceeds. As a result, almost all models of free recall posit a sequential search of memory (e.g., Atkinson & Shiffrin, 1968; Howard & Kahana, 1999; Metcalfe & Murdock, 1981; Raaijmakers & Shiffrin, 1980, 1981; Rohrer & Wixted, 1994; Shiffrin, 1970). However, both cued recall and recognition require a single response, so both retrieval by means of sequential search and retrieval by means of a single step of parallel retrieval remain plausible theoretical models. For shorthand, we term these two approaches parallel versus serial retrieval, respectively. In considering the distinction between recall and recognition, one needs to take into account another theoretical dichotomy: (a) access to a particular identifiable event with some episodic and personal content (assumed to underlie most successful recalls) and (b) a much less specific sense of familiarity (or activation, or matching) without specific content (typically assumed to underlie at least a substantial portion of recognition performance). For shorthand, we term these approaches event retrieval and familiarity, respectively. Parallel and serial models can be combined with event retrieval and familiarity models into four general subclasses; a model in any of these subclasses could be proposed for either recognition or cued-recall tasks. We are not aware of accuracy measures sufficient to choose among these various models. In this article, we shall see how the additional consideration of RT measures can more tightly constrain the potential models for each type of task. The main datum to be extracted from RTs, as we elaborate in detail below, is the general slowness of cued recall relative to recognition. One interpretation of such results ascribes recall to a slow process like serial search and recognition to a fast process like parallel retrieval, often termed familiarity. However, it seems that there is nothing to prevent whatever goes on in recall from occurring on occasion during recognition testing. Thus, some recognition models propose recall-like processes as one component in a dual-route retrieval framework. The other component is based on parallel global access (e.g., Horton, Pavlick, & MoulinJulian, in press; Jacoby, 1991; Juola, Fischler, Wood, & Atkinson, 1971; Mandler, Pearlstone, & Koopmans, 1969; Yonelinas, 1999). It is important to note that dual-route models for recognition can, in principle, be subdivided into two types. In one type (e.g., Juola et al., 1971), the recall-like route is slower than the familiarity route. In the other type, the recall-like route (which in recall tasks is extended in time and often quite slow) is truncated or cut off and is therefore much faster when used in recognition tasks than recall tasks. For example, a process of successive sampling and recovery could (often) be slow when used in recall, due to many samples, but in a recognition task could be truncated to the first sample. In this second case, the two routes would differ qualitatively in some aspect other than time (e.g., the two routes may differ with respect to the variables that affect them; see Brainerd, Reyna, & Mojardin, 1999; Jacoby, 1991). Although both empirical results and plausible conceptual arguments can be mustered in favor of dual-route models for recognition (at least for those with a truncated recall-like route), most current quantitative theorists fit recognition data with a single process of parallel activation or parallel matching, sometimes
385
called "global matching" (e.g., Chappell & Humphreys, 1994; the search of associative memory [SAM] model of recall [Gillund & Shiffrin, 1984]; MINERVA [Hintzman, 1988]; CHARM1 [Metcalfe Eich, 1982, 1985]; the theory of distributed associative memory [TODAM; Murdock, 1982]; the matrix model [Pike, 1984]; and the retrieving effectively from memory model [REM; Shiffrin & Steyvers, 1997]). The success of such single-route models is probably due in substantial part to two facts. First, latency data are often not collected or examined, making it most difficult to distinguish single- and dual-route models. Second, latency data may not be that helpful in distinguishing single-route recognition models from dual-route models in which the recall-like route is truncated. In addition, if familiarity values that underlie the single-route decisions are highly correlated with recall success, then it might become almost impossible to distinguish single- and dual-route models.2 In fact, if such a correlation exists, participants might well choose to base almost all responses on familiarity, even if a recall-like route were available. These arguments were finetuned by Hintzman and Curran (1994); they varied the similarity of foils in recognition and frequency judgment tasks and examined retrieval dynamics. The results supported the view that most responding was based on a familiarity process but that sometimes false alarms to highly similar foils could be inhibited by a (relatively) slow recall-like process involving access to specific trace information. It should be noted that the possibility of a truncated recall-like process operating as a second route in recognition does not open up the possibility that such a process could be posited as the sole route for recognition. Such a model could possibly explain accuracy and times for correct "old" responses but would have difficulty explaining the common finding that RTs for correct "new" responses are roughly equivalent to those for correct "old" responses, a result that was also found in the present studies (also see Ratcliff & Murdock, 1976). Thus, current theorists favor sequential search models for free recall (usually based on event retrieval) and parallel global matching models for recognition (based on familiarity). The situation is less clear in the case of cued recall: Some models posit sequential search (e.g., Raaijmakers & Shiffrin, 1980, 1981), whereas others posit parallel retrieval processes akin to those in recognition (e.g., Hintzman, 1988; Metcalfe Eich, 1982; Murdock, 1982). Our goal in this article was to use RTs and retrieval dynamics to compare and contrast retrieval processes in cued recall and in recognition. Short-Term Memory and Long-Term Memory We favor a memory model having distinguishable short-term and long-term components, with different roles and related but distinguishably different rules for storage and retrieval (e.g., Atkinson & Shiffrin, 1968; Shiffrin, 1993). Therefore, the present studies were designed to minimize the likely contribution of re1 Technically, CHARM first retrieves by using the probe and then matches the result to the probe. We consider these two steps together as the global operation. 2 Research like that of Wiseman and Tulving (1975) and Flexser and Tulving (1978) includes cases in which the correlation is not very high, but for recall and recognition tasks like the ones in this article, it is possible that such correlations could be high enough to make this argument plausible.
NOBEL AND SHIFFRIN
386
trieval from short-term store: Arithmetic was used after list presentations before retrieval, and study-test lags were generally kept quite long. Regardless, the conclusions should remain valid for models that do not use the short/long-term distinction (e.g., Dosher, McElree, Hood, & Rosedale, 1989; Hockley & Murdock, 1987; Ratcliff, 1978). Experiment 1 In this article, we present accuracy and RT data from recognition and cued-recall paradigms. In Experiment 1, the participants were tested concurrently in recognition and cued recall: The participants studied a list of words without knowing whether the following test would be recognition or recall. The type of test was indicated at the start of the test period. RT measures have played a significant role in theorizing on perception, information processing, and cognitive processes (see, e.g., Luce, 1986; Townsend & Ashby, 1983). There is an important but smaller literature on data and models of RT in tasks involving long-term memory. Studying recognition memory, Ratcliff and Murdock (1976) described a series of four experiments in which they explored the relation between accuracy and RT under various manipulations (some of their results reprised those reported by Murdock & Anderson, 1975). Their studies allowed retrieval from both short- and long-term memory, but long enough lists were used that their results contained data of relevance for long-term retrieval. Analyzing only high-confidence responses, they found higher accuracy and shorter RTs for decreased list length and higher accuracy and longer RTs for slower presentation rates. There is also a small literature on data and models of RT in tasks involving recall from long-term memory. In free-recall tasks, analysis has been restricted mainly to interresponse times (see, e.g., Murdock & Okada, 1970; Raaijmakers & Shiffrin, 1980; Rohrer & Wixted, 1994). The basic findings show that interresponse times increase in a positively accelerated fashion and that, at any given output position, the interresponse time is a good predictor of the number of words yet to be recalled. Rohrer and Wixted fitted free-recall latency distributions with an ex-Gaussian and interresponse times at a given output position as a function of the items not yet recalled. Indow (1995) successfully modeled several aspects of retrieval from long-term memory, including interresponse times, with Weibull distributions. For cued recall, error latency is longer than correct latency (see, e.g., Millward, 1964), and there is a direct relation (positive correlation) between correct latency and error rate (see, e.g., MacLeod & Nelson, 1984). In one approach, the correct and error latencies were analyzed separately and interpreted differently: Correct latency was seen as an index of the amount of information about the item available in memory, whereas error latency was viewed as an index of the participant's willingness to continue searching memory (e.g., Millward, 1964). This approach, of course, presupposes a model involving some sort of sequential search. Ratcliff and Murdock (1976) stressed the importance of analyzing latency data at the level of the entire distribution rather than at the level of the mean because distributions can provide much more information. For instance, finding a lower mean RT for a particular condition can be the result of a decrease in overall RT or speeding up of slower responses. Ratcliff (1978) suggested that models
should account for the shape of RT distributions (in particular, their skewness) and specify the relation between speed and accuracy, despite the difficulty of obtaining reliable distributional data. We followed this advice in the design of the present study. We used two different paradigms to track the time course of retrieval. In both, participants took part in a large number of sessions to enable the collection of data providing reliable characteristics of the RT distributions and reliable estimates of the dependence of accuracy on RT for each condition of length and strength (list lengths were 10 or 40 pairs of words, and presentation time per pair was two thirds of a second or 2 s). One paradigm used a free-response procedure (i.e., participants were asked to respond as quickly and accurately as possible). The free-response procedure is commonly used but is limited by the possibility that participants might adopt different strategies in recognition and cued recall, such as differing biases to respond quickly in the two tasks. To control for possible strategy differences of this sort, in the second paradigm we used a signal-to-respond procedure in which the participants were told to withhold responses until a signal was given and then to respond within a fixed short window of time. Measuring accuracy at each of a range of controlled processing times allows independent assessment of, on the one hand, the dynamics of retrieval and, on the other hand, asymptotic performance (i.e., the highest achievable accuracy; see, e.g., Dosher, 1981, 1984a, 1984b; Wickelgren & Corbett, 1977). The same participants took part in both paradigms (on different days), each using similar study conditions. To compare RTs for cued recall and recognition, it is essential for one to eliminate as much as possible artifactual or peripheral sources of differences, such as the use of one of two response keys to indicate an "old" or a "new" response in recognition, and the sequential use of 26 keys to type a response in recall. To equate the demand characteristics of the tasks as much as possible, we had the participants give a verbal response that triggered a voice key; this response latency was used as the basis for all measures of RT. Immediately after the verbal response, the participants provided a typed response that was used to assess accuracy.
Method Participants Ten Indiana University Bloomington graduate students received financial compensation for their participation in the experiment. There were a total of 30 experimental sessions: 15 for the free-response procedure and 15 for the signal-to-respond procedure. In addition, there were 1 or 2 training sessions for signal to respond. Five students started with free response and, after completion of 15 such sessions, moved on to the signal-to-respond sessions. (One of these students left the experiment for medical reasons after finishing the full free-response part of the experiment.) Five students started with 15 experimental sessions of signal-torespond and then moved on to the free-response sessions.
Materials and Apparatus The stimuli were high-frequency English nouns (ranging from 21 to 1,567 occurrences per million) from three to nine letters long (Francis & Kucera, 1982). Fifty words were used on two practice lists to start the 1st experimental session, and 880 words were used in each experimental session. No word was studied on more than one list in a session, no word was tested more than once in a session, and a studied word could be tested
RETRIEVAL PROCESSES in a session only in the test period immediately following its study list. The same pool of 880 words was permuted and used again for each session of the study.3 The words were displayed on IBM-compatible PCs. RTs were recorded using a voice-activated response box; subsequent typed responses used to verify accuracy were entered on the keyboard.
Design and Procedure Each session was divided into 16 study-test cycles. During study, participants saw a list of pairs of words. All pairs on a given list were presented at the same presentation rate. Varied between lists were the length of the list (10 or 40 pairs) and the presentation time (670 or 2,000 ms per pair). After presentation of the list, a simple arithmetic task (addition) was given for 16 s. Participants had 10 s to type their addition answer on the keyboard. Two test conditions were defined by the instructions given after the arithmetic period and at the start of the test list; the same type of test was used for the entire test period for a given list. For both types of tests, single words were presented successively. In the recognition task, participants were asked to differentiate between an old word (for old tests, the right or left word from a pair was tested with equal frequency) and a new word. In the cued-recall task, one word from a study pair was given (the right or left member of a pair was tested with equal frequency), and participants had to try to generate the other word of the pair. A word presented for test always was presented centered on the screen. Each of the four lists that had a particular combination of length and strength was tested twice in each condition in each session. Recognition test lists consisted of 20 words, regardless of the length of the studied list: 10 old words and 10 new words were tested, randomly intermixed. Half of the old words tested had been studied on the right side of a pair, and half had been studied on the left side. Only 1 word from a given pair could be tested. In cued recall, the number of test words was 10, regardless of the length of the studied list. Thus, for both conditions, for the short lists, 1 word from each pair was tested. Also for both conditions, for half of the long lists the first 10 pairs were tested, and for the other half of the long lists the last 10 pairs were tested. After the word pool was permuted for each session, the 16 study-test cycles were generated, and their order was randomized. On each trial, the participants had to give a verbal response through a microphone headset that triggered a voice-activated response box (the sensitivity of which was adjusted as needed throughout training). This was followed by a typed response on the keyboard (one of two keys for recognition or the response word for recall). The verbal response was used to obtain RTs, and the typed responses were used to assess accuracy. Participants were under the impression that their verbal responses were being recorded (though this was not in fact the case). They were told they had to type the response corresponding to their verbal response (even if they retrieved information from memory after the verbal response and before the typed response that would suggest another answer). Spot checking of each participant revealed what appeared to be universal compliance with this instruction. The verbal response in recognition was "P—yes" when the test word was recognized, and "P—no" if it was not recognized. This verbal response was followed by typing an F for positive responses or a J for negative responses. In cued recall, the verbal response was "P—word" (i.e., a particular word was pronounced after the "P" sound) when the participant was able to recall the other word of the pair (these responses could be correct or could be intrusions) and "P—no" if the participant could not recall an answer in the time allowed or gave up. This was followed by typing the recalled word after a positive response or a J after a negative response. The "P" sound was inserted at the beginning of the verbal response to equate the onset times for different phonemes. Differences as large as 150
387
ms in initial phonemes have been reported (see, e.g., Pechmann, Reetz, & Zerbst, 1989). In all cases, if the microphone was triggered by anything else besides a valid "P—" response (e.g., breathing, extraneous noise, or "P—" followed by a pause), the participants were instructed to press a key labeled trash, which marked the trial as invalid. Participants were instructed and trained to respond without a pause between the "P" sound and the following response; spot checking revealed universal compliance with these instructions. In the free-response sessions, participants were asked to respond verbally as quickly and as accurately as possible after presentation of the test item and were given a maximum of 5 s to do so. If no verbal response had been given after 4,500 ms, a brief tone was given (30 ms, 500 Hz) to indicate that a response had to be made within the next 500 ms. There was no time limit for the typed response. At the end of each trial, feedback on accuracy was given. After finishing the test list, participants received feedback on proportion correct and mean overall RT for correct responses (such feedback helped maintain motivation). In the signal-to-respond sessions, participants were instructed not to respond until a response signal (30 ms, 500 Hz) was given and then to respond verbally within 300 ms after the tone but not before 50 ms after the tone. 4 The lag between onset of the test item and the signal was variable. Ten different lags were used: 100, 200, 300, 400, 550, 800, 1,100, 1,400, 2,500, and 4,500 ms. The lags were assigned randomly to the test trials in cued recall; in recognition, each lag was assigned randomly to an old test word and a new test word. At the end of each trial, feedback was given for accuracy, and RT feedback was given if the response was too fast or too slow. After finishing the test list, participants were given feedback on proportion correct and mean overall RT for correct responses.
3 Ratcliff and Murdock (1976) used repeated words in many studies, as we did in the present experiment. In a previous study with a paradigm very similar to that of Experiment 1 in this article, we contrasted a condition that used a pool of 6,000 different words, of lower frequency, with a condition that repeated words, of higher frequency, from session to session. The data showed very similar patterns for the two conditions. Although the differences were not large, recognition performance (d') was better for the nonrepeated (low-frequency) words, and recall was better for the repeated (high-frequency) words, as typically noted in the literature. The recall advantage for repeated words occurred in the face of any proactive interference that developed across sessions, but repetitions could have led to a compensating increase in the effectiveness of coding techniques for individual words. (This experiment was not suitable for the present purposes because the study times we used [2 s vs. 6 s] and the list lengths [10 words vs. 20 words] did not produce significant differences in accuracy.) In any event, we saw nothing in this prior experiment to provide a compelling reason to use nonrepeated words in the present experiment. Most important, because the design of the present study would have required about 28,000 words if all were to be different, it would have been difficult or impossible to find such a number of words that were reasonably uniform in frequency, length, and type (e.g., nouns). We therefore decided to use a smaller set of words, repeated across sessions. 4 After giving a negative response in cued recall in the signal-to-respond conditions, participants were given a second chance to type in their response. This feature was suggested by some participants after a pilot study in which the difficulty with cued recall at the short lags caused distress; motivation increased considerably with a second opportunity for the participants to show that they could recall if given enough time. These second-chance responses were not analyzed.
388
NOBEL AND SHIFFRIN
Results5 In this article, we report the results relevant for the overall comparison of recognition with cued recall, including accuracy, mean RTs, and certain summary distributions. The companion article by Diller et al. (2001) presents the distributions for the individual conditions and the predictions from the associated model. All results reported in this article are significant at the .005 level or lower, unless otherwise indicated.
Table 2 Intrusion Results for the Experiment 1 Free-Response Cued-Recall Condition Category
Proportion
Current list Previous list Semantic—target Semantic—cue Unknown
.391 .276 .114 .068 .152
Free Response Table 1 presents free-response accuracy for recognition and cued recall. Table 2 presents intrusion results for cued recall. Tables 3 and 4 present free-RT measures of central tendency and standard deviation for recognition and cued recall, respectively. Figure 1 presents summaries of the free-RT distributions for recognition and cued recall, averaged across conditions of length and strength. As suggested by Tables 3 and 4 (and as discussed in detail by Diller et al., 2001), the RT distributions differed very little across variations in length and strength, so the summaries in Figure 1 are highly representative and sufficient for the comparisons of recall and recognition. Trials that were marked invalid by the participants were excluded from all analyses, as were trials on which no response was given within the 5-s interval. For recognition, about 0.03% and 1.54% were excluded, respectively, and in total, approximately 1.6% of the responses were excluded; for cued recall, about 0.85% and 2.24% were excluded, respectively, and in total, about 3.1% of the responses were excluded.
Free-Response Accuracy Recognition accuracy. Table 1 provides the probabilities of an old response for the four length-strength conditions, for length and strength separately, and for targets (hits) and distractors (false alarms); it also presents a" (calculated for each participant and then averaged). Analyses of variance (ANOVAs) revealed significant
Table 1 Accuracy Results for Experiment 1 Recognition and Cued Recall (Free Response) Recognition
Recall
Condition
HI
FA
d'
CO
IN
10-670 10-2,000 40-670 40-2,000 10 pairs 40 pairs 670 ms 2,000 ms
.69 .83 .65 .78 .76 .72 .67 .80
.21 .14 .31 .25 .17 .28 .26 .19
1.40 2.15 0.97 1.58 1.78 1.28 1.19 1.86
.17 .45 .11 .34 .31 .23 .14 .39
.10 .08 .06 .08 .09 .07 .08 .08
Note. The conditions in the first four rows represent list length (10 or 40 pairs) followed by presentation time (670 or 2,000 ms). The data for the fifth and sixth rows are for the two list lengths collapsed across presentation time, and the data for the last two rows are for the two presentation times collapsed across list length. HI = hits; FA = false alarms; CO = corrects; IN = intrusions.
effects for length and presentation time on all accuracy measures. Performance on the short lists was better than on the long lists: for d', F(l, 9) = 106.63, MSE = 0.35; for hits and misses, F(l, 9) = 14.57, MSE = 0.34; for correct rejections and false alarms, F(l, 9) = 101.26, MSE = 0.31. In a similar manner, performance on lists with slow rates of presentation was better than on lists with fast rates of presentation: for d', F(\, 9) = 38.51, MSE = 1.79; for hits and misses, F(l, 9) = 47.19, MSE = 1.07; for correct rejections and false alarms, F(l, 9) = 18.41, MSE = 0.73. The manipulations of length and strength had substantial effects on recognition performance: a 39% increase in d' for the shorter lists and a 56% increase in d' for the stronger lists. The accuracy results for variables that we regarded as being of secondary importance (variables that are not included explicitly in the models of Diller et al., 2001) may be found at the following website: http://www. psych.indiana.edu/publications.html. In short, there were differences across participants and serial positions but not across sessions, list position within session, or test position. Recall intrusion analysis. Trials on which the participants gave a positive verbal response (i.e., "P—word") followed by an incorrect typed response were labeled as intrusions. Inspection of the intrusions showed that some were spelling errors (nonwords that matched the correct answer in most letters); these were recorded as correct responses (a total of 10.1% of all intrusions). The remaining intrusions were divided into five categories (in the order listed; when an intrusion fell into more than one category, it was counted once only, in the first of the following categories): (a) presented on the current list; (b) presented on a previous list; (c) semantically related to the target (e.g., if the target was "pistol" and the response was "gun"); (d) semantically related to the cue (this happened mostly for word pairs with strong existing associations; e.g., "cow-milk"); or (e) unknown, if the response did not fit any of the previous categories. Table 2 shows the proportion of intrusions in each category. Most of the intrusions (68%) were episodic, representing words from the current or previous lists. Recall accuracy. Table 1 gives the probabilities of correct responses and of intrusions for the four length-strength conditions and for length and strength separately. ANOVAs revealed significant effects for length and presentation time on most accuracy measures. Performance on the short lists was better than on the long lists: for correct responses, p(c), F(l, 9) = 59.22, MSE = 0.36; for intrusions, F(l, 9) = 11.79, MSE = 0.08; for give-ups, F(l, 9) = 111.43, MSE = 0.28. In a similar manner, 5 The data for this experiment (and subsequent experiments) are available from the authors on request.
389
RETRIEVAL PROCESSES Table 3 Experiment 1 Recognition: Response Time (RT) Central Tendency Measures for the Free-Response Conditions
tions.html. There were significant differences between participants and across serial positions but no interactions.
Free-Response Times
Response Condition
HI
FA
10-670 10-2,000 40-670 40-2,000 10 pairs 40 pairs 670 ms 2,000 ms
785 (280) 760 (256) 789 (273) 796 (292) 772 (268) 793 (283) 787 (277) 778(275)
1,004 (322) 1,017 (359) 971 (341) 1,015 (400) 1,009 (337) 990 (369) 984 (334) 1,016 (386)
CR
MI
838 (286) 834 (293) 846 (284) 862 (312) 836 (290) 855 (299) 842 (285) 847 (302)
965 (352) 1,008 (389) 928 (295) 999(370) 980 (366) 955 (328) 945 (323) 1,003 (378)
Mean RT
The RT results for the variables of secondary importance, for both recognition and recall, are also given on the following website: http://www.psych.indiana.edu/publications.html. The differences that were found (e.g., differences among participants) were not of much importance themselves. However, because these vari-
Table 4 Experiment 1 Cued Recall: Response Time (RT) Central Tendency Measures for the Free-Response Conditions Response
Mean 1/RT 10-670 10-2,000 40-670 40-2,000 10 pairs 40 pairs 670 ms 2,000 ms
1.39 1.43 1.39 1.40 1.41 1.39 1.39 1.41
1.17 1.09 1.20 1.11 1.14 1.16 1.19 1.10
1.30 1.30 1.29 1.27 1.30 1.28 1.29 1.28
1.14 1.10 1.18 1.11 1.13 1.15 1.16 1.11
Median RT 10-670 10-2,000 40-670 40-2,000 10 pairs 40 pairs 670 ms 2,000 ms
726 706 729 730 716 729 727 718
983 988 924 969 985 946 953 978
789 774 793 801 782 797 791 787
909 940 872 957 924 914 890 949
1.30 1.32 1.29 1.28 1.31 1.28 1.29 1.30
1.14 1.11 1.18 1.10 1.12 1.14 1.16 1.11
Median 1/RT 10-670 10-2,000 40-670 40-2,000 10 pairs 40 pairs 670 ms 2,000 ms
1.40 1.44 1.40 1.39 1.42 1.40 1.40 1.42
1.08 1.08 1.14 1.09 1.08 1.11 1.11 1.08
Note. Values were computed after adjustment of the data for nuisance variables. For each set of conditions, the first four rows represent list length (10 or 40 pairs) followed by presentation time (670 or 2,000 ms). The data for the fifth and sixth rows are for the two list lengths collapsed across presentation time, and the data for the last two rows are for the two presentation times collapsed across list length. Standard deviations are in parentheses. HI = hits; FA = false alarms; CR = correct rejections; MI =
performance on lists with slow rates of presentation was better than on lists with fast rates of presentation: for />(c), F(l, 9) = 38.76, MSE = 4.75, for give-ups, F(l, 9) = 36.05, MSE = 5.24. The manipulations of length and strength had substantial effects on recall performance: a 35% increase in p(c) for the shorter lists and a 179% increase in p(c) for the stronger lists. The accuracy results for variables regarded as being of secondary importance (variables not modeled in Diller et al., 2001) are given on the following website: http://www.psych.indiana.edu/publica-
Condition
CO
IN
GU
2,549 (1,001) 2,934(1,066) 2,666 (891) 2,900(1,011) 2,725 (1,048) 2,799 (967) 2,594 (960) 2,917 (1,038)
2,111(1,012) 2,656(1,141) 1,960 (919) 2,475 (1,058) 2,324(1,097) 2,172(1,011) 2,031 (966) 2,556(1,099)
MeanRT 10-670 10-2,000 40-670 40-2,000 10 pairs 40 pairs 670 ms 2,000 ms
1,486 (863) 1,516(835) 1,494(789) 1,649(854) 1,507(843) 1,610 (840) 1,489(834) 1,573(846)
10-670 10-2,000 40-670 40-2,000 10 pairs 40 pairs 670 ms 2,000 ms
0.84 0.88 0.81 0.74 0.87 0.76 0.83 0.82
Mean 1/RT 0.49 0.63 0.49 0.41 0.55 0.44 0.49 0.52
0.73 0.64 0.67 0.52 0.69 0.61 0.70 0.57
Median RT 10-670 10-2,000 40-670 40-2,000 10 pairs 40 pairs 670 ms 2,000 ms
1,262 1,345 1,379 1,473 1,305 1,430 1,316 1,407
2,531 2,716 2,647 2,737 2,619 2,693 2,583 2,726
1,803 2,728 1,698 2,389 2,264 2,043 1,750 2,558
Median 1/RT 10-670 10-2,000 40-670 40-2,000 10 pairs 40 pairs 670 ms 2,000 ms
0.89 0.81 0.80 0.74 0.85 0.77 0.85 0.77
0.45 0.44 0.41 0.42 0.45 0.41 0.43 0.43
0.59 0.43 0.62 0.47 0.51 0.54 0.61 0.45
Note. Values were computed after adjustment of the data for nuisance variables. For each set of conditions, the first fourrowsrepresent list length (10 or 40 pairs) followed by presentation time (670 or 2,000 ms). The data for the fifth and sixth rows are for the two list lengths collapsed across presentation time, and the data for the last two rows are for the two presentation times collapsed across list length. Standard deviations are in parentheses. CO = corrects; IN = intrusions; GU = give-ups.
390
NOBEL AND SHIFFRIN
1000
2000
3000
5000
4000
Reaction Time (ms) 1i—
0.3 -
UOI)J
0.2 -
1
B
—
1— r- A
rA
= .23 n = 998 0 = 357 m = 965
1 INI
Ml
P = 26 u =i367 = 346 m = 319
0
" P = .08 (i = 2758 0 = 1013 m = 2653
/\
A
0-
0.1 -
0.0 -
1. 1000
2000
3000
4000
5000
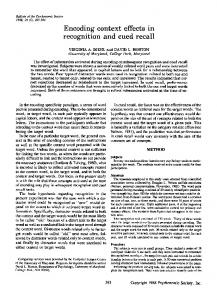
Reaction time (ms) Figure 1. Experiment 1 response time (RT) distributions conditionalized on correct responses (A: hits [HI], correct rejections [CR], and correct cued recalls [CO]) and incorrect responses (B: false alarms [FA], misses [MI], and recall intrusions [IN]). Data are collapsed across length and strength. The abscissa has RT in intervals of 50 ms. The ordinate has relative frequency of responses in each RT interval. Each panel includes proportion of responses of that type (p), mean RT (fi), standard deviation (cr), and median RT (m).
ables can and did distort the shapes of the RT distributions (and because we fitted these distributions quantitatively in Diller et al., 2001), we adjusted the RTs to remove the effects of such variables. In the following sections, we present analyses based on the adjusted RTs. Appendix A gives a detailed description of the adjustment method. It is important to point out that none of the patterns of data exhibited and discussed in this article and none of the statistical effects are changed if the raw data are analyzed instead. (The tables present results for the adjusted RTs; the tabled RT means were unaffected by the adjustment procedures, but the tabled RT standard deviations were a little lower than for the raw data.) In keeping with traditional measures, we analyzed not only distributions but also measures of central tendency. When nuisance variables are left in the data, different measures of central tendency can produce quite different results (e.g., Ratcliff, 1993; Ulrich & Miller, 1994). For the adjusted data, the different measures tell much the same story. Nonetheless, we analyzed the adjusted data using means and medians and did so for both RT and 1/RT. The use of 1/RT was suggested by Ratcliff (1993), who showed that
when variability among participant means was low relative to the standard deviation of the distribution (as is true for the adjusted data), the inverse transformation (1/RT) was always close to the optimal cutoff for outliers and that the median provided an accurate estimate of the location of the distribution. As measures of variability, we focused on standard deviations, assuming that the adjustment techniques would prevent any significant distortions of the results. Recognition RT. Table 3 presents the RT results (mean RTs, standard deviations, mean 1/RTs, median RTs, and median 1/RTs) for the four length-strength conditions, for length and strength separately, and for each of the possible responses: hits, false alarms, correct rejections, and misses. The most surprising aspect of these results is the similarity across variations in length and strength. Only a few of the comparisons among means were statistically significant: Mean RT for hits was significantly higher on the long lists than on the short lists, F(l, 9) = 9.94, MSE = 0.09, p = .012, and mean RT for misses was lower on the fast lists than on the slow lists, F(l, 9) = 7.30, MSE = 0.28, p = .024; none of the other comparisons yielded statistically significant results. In addition, a few comparisons among medians were statistically significant: Median RT for false alarms was significantly higher on the long lists than on the short lists, F(l, 9) = 11.89, MSE = 0.02, p = .007, and median RT for misses was lower on the fast lists than on the slow lists, F(l, 9) = 6.86, MSE = 0.07, p = .028; none of the other comparisons were significant. Analysis of 1/RT may be better justified, and in this case no significant differences for any comparisons across length and strength conditions were found for the means; for the medians, there was a significant difference for false alarms for list length, F(l, 9) = 8.62, MSE = 0.02, p = .017. The striking similarities of measures of central tendency (and of standard deviations) across length and strength conditions are mirrored in the plots of the entire RT distributions, although the graphs of the distributions for the various conditions are presented in the companion article by Diller et al. (2001). The plots of the distributions were constructed by cumulating observations in 50 bins of size 100 ms (thereby covering the range from 0 to 5 s). The graphs of the RT distributions therefore give 50 proportions that sum to 1.0; in each 100-ms bin is the proportion of all responses of that type that had times within that interval. In addition, for convenience, all graphs of distributions contain tabular information about the proportion of responses of that type (p), mean RT (jx), standard deviation (cr), and median RT (m). The distributions were compared statistically with the nonparametric Kolmogorov-Smirnov (K-S) test for differences between the cumulative distributions. Because the number of observations in each distribution was quite large, this test was very sensitive. List-length differences were found for hits (D = .061) and correct rejections (D = .050). Presentation time differences were found for misses (D = .069). The other five comparisons were not significantly different statistically. The similarity of the RT distributions across variations in length and strength is particularly striking when contrasted with marked differences in accuracy across those same conditions. Such results may have important potential implications for theory, as taken up by Diller et al. (2001). Figure 1 (summing across length and strength) illustrates the small differences found between the distributions for positive and
391
RETRIEVAL PROCESSES
negative recognition responses (solid lines vs. large dashes). When the responses were correct (top panel; hits and correct rejections), the distributions were similar but not quite identical: Hits were about 60 ms faster than correct rejections, F(l, 9) = 2,728.30, MSE = 0.01, and F(l, 9) = 116.35, MSE = 0.51, for 1/RT. Differences were found for median RT, F(l, 9) = 327.65, MSE = 0.01, and the K-S test, D = .153. When the recognition responses were incorrect (lower panel; false alarms and misses), the distributions were again similar but not identical: False alarms were about 30 ms slower than misses, F(l, 9) = 45.72, MSE = 0.03, for RT, but they did not differ for 1/RT. In addition, differences were found for median RT, F(l, 9) = 29.29, MSE = 0.02, and the K-S test, D = .068. A comparison of the upper to lower panels in Figure 1 illustrates the distributional differences for correct and incorrect responses, summed across length and strength conditions (recognition distributions are on the left of each panel). These differed on all measures. For targets (solid lines), there were large differences between hits and misses. Hits were about 180 ms faster than misses: F(l, 9) = 3,746.65, MSE = 0.02, for RT; F(l, 9) = 224.61, MSE = 0.71, for 1/RT; F(l, 9) = 1,220.16, MSE = 0.01, for median RT; and D = .346 for the K-S test. For distractors (large dashes), large differences between correct rejections and false alarms were found. Correct rejections were about 150 ms
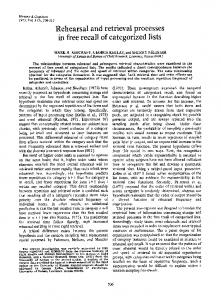
faster than false alarms: F(l, 9) = 1,555.91, MSE = 0.03, for RT; F(l, 9) = 52.62, MSE = 0.77, for 1/RT; F(l, 9) = 476.18, MSE = 0.02, for median RT; and D = .266 for the K-S test. The relation between accuracy and RT for the four separate conditions is easier to see in an alternate plotting of the data: The top left panel of Figure 2 shows d' as a function of RT deciles for the short lists for each presentation time; the bottom left panel shows this for the long lists. In all conditions, slow responses were considerably less accurate than fast responses. We looked as well at other aspects of the RT distributions that various investigators have suggested could be of importance. For example, the hazard functions have a shape that is fairly common for data from other sorts of tasks, such as simple RT, for which the underlying distributions are ex-Gaussian (e.g., Luce, 1986, p. 134; Van Zandt & Ratcliff, 1995). An example of such a hazard function is given in Appendix B. Recall RT. As with recognition, analyses were based on the adjusted data. With one minor exception discussed in Appendix A, none of the patterns of data exhibited and discussed subsequently and none of the statistical effects are changed if the raw data are analyzed instead. Table 4 presents the RT results (mean RTs, standard deviations, mean 1/RTs, median RTs, and median 1/RTs) for the four lengthstrength conditions, for length and strength separately, and for
10 pairs 670 ms 2000 ms
3 --
I 2 Q.
1 "-
0-40
60
80
100
Percentile (RT)
I
40
60
80
100
80
100
Percentile (RT)
1
40 pairs —o— 670 ms —v— 2000 ms -
3 --
•= 2 9Q
1 -0 -20
40
60
Percentile (RT)
100
40
60
Percentile (RT)
Figure 2. Relation between accuracy and response time (RT) in free response in Experiment 1. Left panels for recognition; right panels for recall. Performance as a function of RT deciles (Panels A: short lists; Panels B: long lists).
NOBEL AND SHIFFRIN
392
each of the possible responses: corrects, intrusions, and give-ups. Comparisons of the means revealed several statistically significant results: Mean RT for give-ups was significantly higher on the short lists than on the long lists, F(l, 9) = 12.41, MSE = 4.00; mean RT was lower on the fast lists than on the slow lists for corrects, F(l, 9) = 5.87, MSE = 1.33, p = .038; intrusions, F(l, 9) = 10.48, MSE = 1.43, p = .010; and give-ups, F(l, 9) = 30.06, MSE = 17.94; the other comparisons did not yield significant results. In addition, a few comparisons among medians were statistically significant: Median RT for corrects was significantly higher on the slow lists than on the fast lists, F(l, 9) = 6.61, MSE = 0.18, p = .030; median RT for give-ups was lower on the long lists than on the short lists, F( 1,9) = 11.03, MSE = 0.68, p = .009; and median RT for give-ups was lower on the fast lists than on the slow lists, F(l, 9) = 31.98, MSE = 3.07; none of the other comparisons were significant. Analysis of 1/RT may have been better justified, and in this case no significant differences for any comparisons across length and strength conditions were found for the means; for the medians, there were significant differences for corrects for list length, F(l, 9) = 8.07, MSE = 0.10, p = .019, and presentation time, F(l, 9) = 16.01, MSE = 0.05, and for give-ups for presentation time, F(l, 9) = 34.42, MSE = 0.11. Although differences were found in the measures of central tendency across length and strength conditions, the RT distributions nonetheless overlapped considerably; although averaging across length and strength was not quite as well justified as was the case for recognition, we did so to allow ready comparison with the recognition results. Figure 1 shows the summary RT distributions (conditionalized for giving a particular response) for correct responses and intrusions. The distributions for give-ups were generally slow and skewed toward slow responses (the plots are presented in Diller et al., 2001). The distributions for each length-strength condition were compared statistically with the nonparametric K-S test for differences between the cumulative distributions. Five out of six comparisons were significantly different. List-length differences were found for corrects (D = .094) and give-ups (D = .069). Presentation time differences were found for corrects (D = .081), intrusions (D = .160), and give-ups (D = .231). The considerable overlap of the RT distributions across variations in length and strength is particularly striking when contrasted with the large differences in accuracy across those same conditions. The relation between accuracy and RT for the four conditions is further explored in Figure 2. The top right panel shows the proportion of corrects as a function of RT
deciles for the short lists for each presentation time; the bottom right panel shows the proportion of corrects as a function of RT deciles for the long lists. In all conditions, slow responses were considerably less accurate than fast responses. We looked as well at other aspects of the RT distributions that various investigators have suggested could be of importance. For example, the hazard functions for the intrusion and give-up data had a shape that is fairly common for data from other sorts of tasks, such as psychophysical judgments (e.g., Luce, 1986, p. 130). An example of such a hazard function is given in Appendix B.
Comparison of Recognition and Recall RTs The recognition results were similar in pattern to the cued-recall results, to a first degree of approximation: Despite the large differences in accuracy, the RT distributions changed little as a function of length and strength. These length and strength findings are discussed and modeled in Diller et al. (2001). The between-paradigm comparisons, however, revealed large RT differences. Table 5 presents the RT results for measures of central tendency (mean RTs, standard deviations, mean 1/RTs, median RTs, and median 1/RTs), collapsed over length and strength conditions, for each of the possible responses: (a) hits, false alarms, correct rejections, and misses in recognition and (b) corrects, intrusions, and give-ups in recall. Statistical comparisons of the means yielded significant results: Mean RT in recall was significantly higher than in recognition—for corrects and hits, F(l, 9) = 28,541.73, MSE = 0.04, and for intrusions and false alarms, F(l, 9) = 11,234.53, MSE = 0.17. In addition, the comparisons among medians were statistically significant: Median RT for cued recall was significantly higher than for recognition—for corrects and hits, F(l, 9) = 767.53, MSE = 0.15, and for intrusions and false alarms, F(l, 9) = 1,294.22, MSE = 0.53. Analysis of 1/RT may have been better justified, and in this case all comparisons yielded significant results for both mean 1/RT—for corrects and hits, F(l, 9) = 524.32, MSE = 1.38, and for intrusions and false alarms, F(l, 9) = 105.28, MSE = 2.50—and median 1/RT—for corrects and hits, F(l, 9) = 2,228.34, MSE = 0.05, and for intrusions and false alarms, F(l, 9) = 2,234.84, MSE = 0.05. These large differences in measures of central tendency were mirrored in the standard deviations, which were significantly larger for the larger means (see Table 5), although statistical analysis was truncated for brevity.
Table 5 Response Time (RT) Summary Results for Experiment 1 (Free Response) Recognition
Recall
Condition
HI
FA
CR
MI
CO
IN
GU
Mean RT Standard deviation Mean 1/RT Median RT Median 1/RT
782 276 1.40 723 1.41
998 357 1.15 965 1.10
845 294 1.29 789 1.30
967 346 1.14 919 1.13
1,551 843 0.82 1,364 0.81
2,758 1,013 0.51 2,653 0.43
2,242 1,054 0.65 2,153 0.53
Note. RTs are collapsed across length and strength conditions. HI = hits; FA = false alarms; CR = correct rejections; MI = misses; CO = corrects; IN = intrusions; GU = give-ups.
393
RETRIEVAL PROCESSES
The differences between recognition and cued-recall RTs are seen even more clearly in the plots of the RT distributions, as illustrated in Figure 1. The distributions look markedly different for recall and recognition (confirmed statistically with nonparametric K-S tests, ps < .001). Clearly, the cued-recall distributions are shifted to the right, are more skewed to the right, and have higher variance. Appendix B contains examples of hazard functions (the probability that an event will occur given that it has not occurred yet). It may be noteworthy that the shapes were quite different for recognition (increasing then decreasing) and recall (increasing). Van Zandt and Ratcliff (1995) discussed the difficulty of drawing conclusions from hazard functions, partly because the interesting part of the shape (the part after the rise to an initial peak) is determined by only a small part of the RT data in the tails of the distributions. In addition, they demonstrated (and referred to a relevant literature) that mixtures of processes with different rates often produce nonmonotonic hazard functions, even when each component of the mixture has an increasing hazard function. Given that the hazard functions for both recognition and recall are likely to be the result of mixtures, the different shapes for recognition and recall may be another indication of different retrieval processes for the two tasks. This finding could be the basis for a more thorough investigation in the future, but for this article, we are satisfied merely to call attention to the difference.
Signal-to-Respond Trials that were marked invalid by the participants were excluded from all analyses (about 0.7% in recognition and 1.0% in recall). An acceptance range for RTs between 25 and 300 ms excluded 17.4% of responses in recognition and 34.0% of responses in recall, and a range between 25 and 400 ms excluded 3.6% of responses in recognition and 9.6% of responses in recall. Because none of the qualitative patterns or trends reported here and none of the statistical analyses changed for these two ranges, we decided to use responses that fell below the upper bound of our instructions, and we report observations with RTs in the range of 25 to 300 ms.
Asymptotic Accuracy We defined asymptotic accuracy as the average performance over the three longest lags (1,400, 2,500, and 4,500 ms), because the performance seemed to have stabilized by this time (e.g., Dosher, 1984a). Table 6 shows the asymptotic results (averaged over the three longest lags) for the four length-strength conditions and for length and strength separately. For recognition, Table 6 gives the probability of an old response for targets (hits), distractors (false alarms), and a"; for cued recall, Table 6 gives the probability of a correct response and an intrusion. For recognition, ANOVAs showed significant effects for length and presentation time on all accuracy measures. Performance on the short lists was better than on the long lists: for a", F(l, 8) = 39.75, MSE = 0.27; for hits and misses, F(l, 8) = 13.55, MSE = 0.01, p = .006; and for correct rejections and false alarms, F(l, 8) = 70.80, MSE = 0.01. In a similar manner, performance on lists with slow rates of presentation was better than on lists with fast rates of presentation: for d', F(l, 8) = 20.31, MSE = 0.69; for
Table 6 Asymptotic Accuracy Results for the Signal-to-Respond Condition for Experiment 1 Cued-recall response
Recognition response Condition
HI
FA
d!
CO
IN
10-670 10-2,000 40-670 40-2,000 10 pairs 40 pairs 670 ms 2,000 ms
.74 .83 .64 .79 .78 .71 .69 .81
.20 .09 .28 .19 .15 .24 .24 .14
1.63 2.38 1.02 1.72 1.94 1.32 1.27 2.02
.25 .58 .16 .39 .42 .27 .21 .49
.07 .08 .07 .08 .07 .07 .07 .08
Note. All values were computed by first averaging across participants and sessions and then averaging across the longest three lags. The conditions in the first four rows represent list length (10 or 40 pairs) followed by presentation time (670 or 2,000 ms). The data for the fifth and sixth rows are for the two list lengths collapsed across presentation time, and the data for the last two rows are for the two presentation times collapsed across list length. HI = hits; FA = false alarms; CO = corrects; IN = intrusions.
hits and misses, F(l, 8) = 12.07, MSE = 0.03, p = .008; and for correct rejections and false alarms, F(l, 8) = 14.07, MSE = 0.02, p = .006. For cued recall, performance on the short lists was better than on the long lists: for corrects, F(l, 8) = 44.37, MSE = 0.25, and for give-ups, F(l, 8) = 69.73, MSE = 0.16. In a similar manner, performance on lists with slow rates of presentation was better than on lists with fast rates of presentation: for corrects, F(l, 8) = 28.35, MSE = 1.67, and for give-ups, F(l, 8) = 44.48, MSE = 1.15. No differences were found for intrusions. Intrusion analysis. We analyzed the intrusion types in the signal-to-respond condition by using the same criteria as those described for the free-response data. Again, typographical errors of correct responses were recoded as correct (a total of 9.5% of all intrusions), and the remaining intrusions were divided into the five categories previously described. Table 7 shows the proportion of intrusions in each category. Again, most intrusions (75%) came from the current list or the previous lists. Retrieval dynamics assessed by exponential functions. Sensitivity of performance is typically plotted as a function of either signal delay or delay until response (also termed total processing time). Because participants typically produce slower RTs after short signal delays, the two approaches are not equivalent. More often than not, investigators have used total processing time, and we followed this convention (given the unfortunately noisy character of our signal-to-respond data, it would probably have been unwise to expend much energy analyzing the data in both ways). Thus, a given d', or p(c), is plotted at a time corresponding to the signal delay plus the average RT required for a signal at that delay. (The hit and false-alarm rates that together were used to calculate a" for each length and strength are given in the companion article by Diller et al. [2001], along with model predictions.) Examination of typical signal-to-respond functions shows an initial period of chance performance, a subsequent period during which accuracy increases rapidly, and a final period in which
NOBEL AND StflFFRIN
394 Table 7 Experiment 1 Cued Recall: Intrusion Results for the Signal-to-Respond Condition Category
Proportion
Current list Previous list Semantic—target Semantic—cue Unknown
.464 .282 .114 .069 .071
accuracy reaches asymptote (e.g.> Dosher, 1984a, 1984b).6 These retrieval functions are typically described by an exponential function with three parameters (see Equation 1): an asymptotic accuracy parameter that reflects limitations in memory information, an intercept at which point accuracy first rises above chance, and a rate of rise from chance to asymptote (see, e.g., Dosher, 1984a, 1984b; Hintzman & Curran, 1994; Wickelgren & Corbett, 1977). The dynamics of retrieval are commonly summarized by the intercept and the rate parameters. We compared the retrieval dynamics underlying the four conditions by fitting the following exponential function to the d' and p{c) data (see Dosher, 1981, 1984a; Hintzman & Curran, 1994; Wickelgren & Corbett, 1977):
f
f
(f-/)
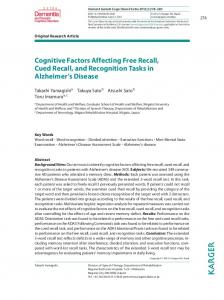
d\ is the value predicted by Equation 1, 5' is the overall mean, and k is the number of free parameters (Hintzman & Curran, 1994; Reed, 1976). For recall, the d's in Equation 2 were replaced by an arcsine transformation of p(c).7 The data were fitted by minimizing the sum of the squared errors (and consequently maximizing the value of r2) through a parameter estimation program that used combinations of the simplex method (Nelder & Mead, 1965) and the Davidson-Fletcher-Powell method (Fletcher & Powell, 1963).8 The top left panel of Figure 3 shows the observed recognition d' data, and the bottom left panel of Figure 3 shows the observed recall proportion correct data, both with the best fitting exponential functions for the four conditions. To fit the data for either recognition or recall (separately), we first let all parameters vary with
conditions (12 free parameters) and then fitted a restricted model with a common intercept and growth rate but different asymptotes (6 free parameters). The full and restricted models can be compared through an ANOVA (see, e.g., Neter, Wasserman, & Kutner, 1985). The restricted models did not fit significantly worse than the full models: for recognition, F(6,28) = 0.77, MSE = 0.02, p = .600, and for recall, F(6, 28) = 0.95, MSE = 0.001, p = A16. The exponential functions shown in Figure 3 are the predictions for the restricted models. The values of the best fitting parameters for both models are given in Table 8. As one would expect, the estimates of A, the asymptotic levels, closely mimicked the values reported earlier in the Asymptotic Accuracy section. They differed with length and strength variations, and the results are not repeated here. For both recognition and recall, measured either by averaging across the three longest lags or by using the asymptotic parameter estimates, accuracy was uniformly superior in the signal-to-respond task than in the freeresponse task. Such findings are fairly typical (e.g., Dosher, 1982; Dosher & Rosedale, 1989). Although none of the individual comparisons in the present study reached significance—for recogni-
6
Our cued-recall signal-to-respond functions in Experiment 1, and to some extent in Experiment 2 as well, exhibited an atypical pattern, with an initial period of above chance performance that was relatively flat. Given the variability of our signal-to-respond data, we chose to ignore this finding and fitted the cued-recall functions with the exponentials described in the text, just as was done for the recognition conditions in which such a fit was better justified. Nonetheless, the finding may well be real and deserves some discussion. The less interesting explanation involves variability in intercept across participants, items, trials, and so forth. Such variability would produce an aggregate signal-to-respond function that is ogival, with a slowly rising initial edge, even if a pure exponential applies on each trial. Further such variability might well be higher for recall processes than for the familiarity calculated for recognition. Possibly a more interesting explanation is based on the idea that on some trials an extra process occurs at the shortest lags: Suppose familiarity of the test word is assessed as the first step in retrieval (as posited in the model in the companion article by Diller et al., 2001). Occasionally, when familiarity is high, the participant might initiate a "P" sound, anticipating (usually correctly) that successful recall will occur quickly enough to produce an output within the instructional constraints of the experiment (consistent with the common finding that RT after the signal is, on average, slower at the fastest signals). Such an explanation might be consistent with hints in associative recognition tasks, some in prior reports (e.g., Dosher, 1984b; Gronlund & Ratcliff, 1989) and some in Experiments 2 and 3 in the present article, that there is a brief period of time with above chance but rather flat performance before the exponential growth starts in earnest. Notwithstanding the facts that such observations may be unreliable and may have many other explanations, there is other evidence that familiarity may be playing a role early in associative conditions, and this is discussed after Experiments 2 and 3. 7 The variance of p(c) was not constant across lags because of a floor effect at the lower lags. To stabilize the variances and to allow proper statistical comparisons, we transformed the proportions in recall by using the following equation (see, e.g., Montgomery & Peck, 1982): p(c)' = 2 arcsineVp(c). Both the observed data and Equation 1 were transformed using the arcsine equation. 8 These minimization methods were implemented in a program called MINUTT, which was originally developed by F. James and M. Roos at the CERN, Geneva, Switzerland. See also Press, Teukolsky, Vetterling, and Flannery (1992) for a general discussion of these techniques, including source code.
395
RETRIEVAL PROCESSES
0.0
1000 2000 3000 4000 Total Processing Time (ms)
5000
1000 2000 3000 4000 Total Processing Time (ms)
2.5
I
B
0.6 -
I
I
5000
I
_
2.0
T _
1.5 _ _ • o
„
y
0.4 -
T
ST
f"
•T
r'
1.0
0.2 - -
0.5
W
-o—
3
670 ms 2000 ms
—o— 670 ms -••*•• 2000 ms
0.0 -
0.0
1000
2000
3000
4000
5000
y
1000
Total Processing Time (ms)
2000
3000
4000
5000
Total Processing Time (ms)
Figure 3. Experiment 1 signal-to-respond accuracy as a function of signal delay plus response time for the four length-strength conditions. Symbols are the observed data; lines are the predicted exponential functions for the restricted model with a common intercept and growth rate. Left panels: d' for the recognition conditions; right panels: p(c) for the cued-recall conditions. Best fitting parameters can be found in Table 8.
tion, f(8) = 2.21, p = .058, for the 10-pairs/670-ms list; f(8) = 1.44, p = .189, for the 10-pairs/2,000-ms list; t(8) = 0.68, p = .516, for the 40-pairs/670-ms list; and f(8) = 1.01, p = .340, for the 40-pairs/2,000-ms list; for recall, ?(8) = 2.27, p = .053, for the 10-pairs/670-ms list; r(8) = 2.28, p = .052, for the 10-pairs/ 2,000-ms list; f(8) = 2.00, p = .081, for the 40-pairs/670-ms list; and t(8) = 0.70, p = .501, for the 40-pairs/2,000-ms list—the consistent trends may suggest that participants in free response sometimes terminated their memory retrieval processes at a point in time at which less information was available than at the longest lags in signal-to-respond.9 For recognition and cued recall analyzed separately, the asymptotic levels of performance in each case were higher for short lists and slower lists, but the retrieval dynamics did not differ across these length-strength conditions.10 Of greatest present interest, however, are the comparisons of the retrieval dynamics between recognition and cued recall. To compare these dynamics (we return to this point in the discussion of Experiment 2), we made the assumption that p(c), the probability of correct recall, and d', the measure of sensitivity for recognition, are appropriate measures. For reference, we also looked at the retrieval dynamics based on the hit rate in recognition. To increase the power of the comparisons and to reduce noise, the data were collapsed across length and
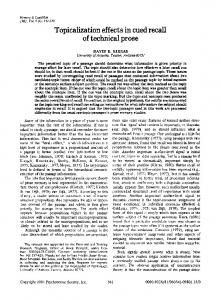
strength (a procedure at least marginally justified by our findings that only the asymptotes, and not the retrieval dynamics, differed across length and strength). We first separately fitted exponential functions to each of the three measures, using nine parameters (three for each measure). Figure 4A shows the observed data with the resultant best fitting exponential functions forp(h), d', andp(c). The asymptotes are on different scales and not directly comparable, but it is arguably appropriate to compare retrieval dynamics. Therefore, two restricted four-parameter models were fitted to the data, models with a common intercept and growth rate but different asymptotes. One restricted model was fitted to the data forp(h) andp(c) (predictions
9
In the context of a rather different task using sentences, Dosher (1982) discussed cases in which differences in asymptotic accuracy might be expected to produce differences in free-response RT. Her findings and associated arguments highlight the need to find a way to model the small free-response RT differences found in Experiment 1 as a function of length and strength. Such a model is presented in Diller et al. (2001). 10 These findings may remind one of similar results by Dosher (1984b), using associative recognition. Her results are mentioned in the discussion of Experiments 2 and 3, both of which used associative recognition.
NOBEL AND SHIFFRIN
396
Table 8 Experiment 1 Signal-to-Respond: Best Fitting Parameters of the Exponential Functions Condition Free parameter
10 pairs
40 pairs
670 ms
2,000 ms
r2
discussed and modeled in the companion article by Diller et al. (2001). However, in this article, we focus on the differences in RTs and retrieval dynamics between recognition and cued recall. The free-response procedure showed large RT differences between cued recall and recognition. For correct responses (hits and correct rejections in recognition, and corrects in cued recall), the mean and
Recognition k = 12 G A k = 6 G A
245 135 1.89
249 93 1.39
288 101 1.28
212 131 2.03
.908
271 96 1.85
271 96 1.41
271 96 1.26
271
.893
2.02
Cued recall 12 102 628 0.44
0 1,239 0.32
111 619 0.22
13 921 0.54
.924
G A
68 762 0.46
68 762 0.27
68 762 0.23
68 762 0.51
.924
G A
0
1000
2000
3000
4000
0.0 5000
Total Processing Time (ms)
Note, k = number of free parameters; / = intercept (ms); G = growth rate (ms); A = asymptote.
are graphed in Figure 4B) and another to the data for d' and p(c) (predictions are graphed in Figure 4C). The values of the best fitting parameters for the models are shown in Table 9. The full and restricted models can be compared through an ANOVA (see, e.g., Neter et al., 1985). Both of the restricted models fitted significantly worse than the full model: F(2, 14) = 45.15, MSE = 0.001, for p(h) and p(c) and F(2, 14) = 7.56, MSE = 0.005, p = .006, for d' and p(c). These results confirm what appears to be the case after visual inspection: Retrieval dynamics were slower for cued recall than for recognition. The parameter estimates showed a lower intercept for cued recall than for recognition, but this was a potentially unreliable result, due largely to the well-known codependence of the growth rate and intercept parameters (e.g., Gronlund & Rateliff, 1989). A restricted fit holding only the growth rate parameters constant was rejected: F(l, 14) = 45.90, MSE = 0.006, for p(h) and p(c) and F(l, 14) = 12.95, MSE = 0.005, for a" andp(c). A restricted fit holding only the intercept parameters constant could not be rejected for d', F(l, 14) = 2.11, MSE = 0.005, p = .169, but could be rejected for p(h), F(l, 14) = 6.01, MSE = 0.001, p = .028. These tests of the parameters of the exponential functions that were fitted to the signal-to-respond results thus confirm the freeresponse results: Retrieval dynamics measured in signal-torespond (i.e., some combination of the intercept and growth rate parameters) were slower in cued recall than in recognition.
Discussion When considered separately, both recognition and cued recall showed differences in accuracy but little difference in RT when length and strength were varied. These very interesting results are
0
1000
2000
3000
4000
5000
Total Processing Time (ms)
o
a.
0
1000
2000
3000
4000
0.0 5000
Total Processing Time (ms) Figure 4. Experiment 1 signal-to-respond results based on total processing time forp(h) and d' in recognition and pic) in cued recall. Symbols are the observed data (collapsed across length and strength); lines are the predicted exponential functions for the full model (A) and restricted models (B and C) with a common intercept and growth rate. Best fitting parameters can be found in Table 9.
RETRIEVAL PROCESSES Table 9
Experiment 1 Recognition and Recall Comparisons: Best Fitting Parameters of the Exponential Function Condition Free parameter k= 9 I G A k = 4 / G A I G A
Recognition, P(h)
Recognition, d'
Recall, p(c)
263 85 0.75
239 117 1.60
51 854 0.38
.988 .991" .989b
187 160 0.26
.941
167 200 0.27
.610
187 160 0.77 167 200 1.65
Note, k = number of free parameters; / = intercept (ms); G = growth rate (ms); A = asymptote. a Pairwise i2 for/?(h) andp(c), k = 6. b Pairwise r 2 for d' andp(c), k = 6.
variance for the recognition distributions were quite a bit lower than for cued recall. In addition, responses in cued recall spanned the entire response interval, whereas responses in recognition showed a cutoff around 2 s. It is not clear whether it is appropriate to compare incorrect responses in recognition with intrusions in cued recall, but false alarms and misses in recognition showed RT distributions with means and variability vastly different from those for intrusions in cued recall. The results from the signal-to-respond procedure were unfortunately much noisier than those from the free-response procedure. The accuracy results were clearest and directly mimicked those found in free response. Asymptotic accuracy in signal-to-respond was slightly higher than accuracy in free response, possibly suggesting that participants in free response terminated their retrieval processes before all of the relevant information was available. Despite the noise in the data, statistical comparisons of the parameters of exponential functions fitted to the signal-to-respond curves confirmed the differences seen in the free-response data. The retrieval dynamics, summarized by the growth rate (G) and the intercept (I), were quite different for single-item recognition and cued recall, with the growth rate in particular being faster in recognition than in cued recall. These differences are fairly evident in the functions graphed in Figure 3. These differences in RTs (and the results of the additional studies reported in this article) provided the primary reason for fitting different models of retrieval to recognition and cued recall (Diller et al., 2001). In that article, recognition is treated as a variant of the REM model (Shiffrin & Steyvers, 1997; the general approach is similar in conception to that underlying the SAM model; e.g., Gillund & Shiffrin, 1984). Recognition involves matching the test word to all images in memory, in parallel, producing likelihood ratios for each image. The likelihood ratios are summed, and a response is based on the result, so that retrieval operates essentially as a one-step process. The cued-recall model is instead a multistep process. Although the first step is that of the recognition model, namely, the production of likelihood ratios for
397
each image, there are additional steps, as in the sequential search process of the SAM model for cued recall (e.g., Raaijmakers & Shiffrin, 1980, 1981). In each cycle of the search, an individual image is sampled from memory, and then some of the contents of that image are recovered and examined. The cycles continue until a response is emitted or the participant decides to give up. This system produces recall times that are spread out much farther in time than those of the recognition model. At first glance, the differences between the recognition and recall RTs seem to rule out models with a common retrieval operation. The results specifically seem at odds with several memory models that posit a single retrieval operation for both recognition and recall (e.g., Hintzman, 1988; Metcalfe Eich, 1982,1985; Murdock, 1982). For example, in CHARM (Metcalfe Eich, 1982, 1985), episodic information about items is stored in a compositedistributed memory vector by a convolution operation. The retrieval mechanism consists of correlating the test probe with the memory vector, which results in a retrieved trace. The retrieval operation must be relatively fast to fit the rapid RTs found in recognition. Because this mechanism operates in both recognition and recall, the observed differences in RT distributions have to be explained by what happens after retrieval. Similar reasoning operates in the case of other models positing a common retrieval operation. This argument can be clarified by distinguishing between retrieval of episodic and lexical-semantic information. In an explicit memory model like CHARM, the initial retrieval is of episodic information. This information is in the form of a noisy feature vector. In recognition, the subsequent decision could be quite rapid because the test alternative is available to the participant: The noisy vector could be compared directly with the test item, or access to the lexical entry of the test item could be speeded by the presence of the test item. However, in cued recall, no comparison item is available. To produce an output, the retrieved vector must be compared with a lexicon separate from the episodic memory (though this process is left unspecified in CHARM). It is presumably this comparison with the lexicon that takes the extra time seen in cued recall. Similar arguments can be made for TODAM (Murdock, 1982), in which the postretrieval process is termed deblurring (though otherwise left unspecified). A related argument can be used in the case of the matrix model (e.g., Pike, 1984). Such arguments have some potential conceptual problems, including the fact that lexical access is observed to be an extremely rapid process (see, e.g., Hintzman & Curran, 1997) but nonetheless must be taken seriously. Hintzman's (1988) MINERVA model stores episodic vectors separately (rather than in composite fashion). For recall, MINERVA calculates and uses echo content, rather than echo intensity. It is unclear whether the time needed to retrieve echo content for recall is different from that needed to retrieve echo intensity for recognition. If the needed time is slower for recall, there are, by definition, different modes of retrieval for recognition and recall. We focus, therefore, on the case in which retrieval of echo intensity and echo content take the same time course. Consider that, as in CHARM, TODAM, and the matrix model, the result in MINERVA of retrieval for recall is a noisy vector. However, because stored vectors are separate, the process of deblurring the retrieved vector can potentially consist of a series of successive retrievals, each using as a probe the result of the
NOBEL AND SHIFFRDM
398
previous retrieval; with luck, these retrievals will converge on a particular trace. Thus, this model could account naturally for the slower recall responses. Furthermore, these successive retrievals occur from episodic memory, so one would not want to refer to a distinction between retrieval and postretrieval in this case. Nonetheless, the extra recall time in this model, as in the three models previously mentioned, is due to the process that turns the initially retrieved noisy vector into a response. It is this general notion, that an initially fast retrieval like that occurring in recognition is followed by a slow process of cleaning up the retrieved vector to produce a recall, that we wished to test in the following studies. Experiment 2 Consider the possibility that participants begin retrieval in recall tasks by generating a noisy response with a time course that parallels that in recognition and then spend additional time beyond that needed in recognition to clean up the information to generate a response. If so, providing participants in recall tasks with the potential answer might eliminate the need for additional time. This reasoning parallels that of Wickelgren and Corbett (1977) and led us to adopt a variant of their signal-to-respond procedure (which they called "yes-no recall" but we term wickelcall). The results of this study paralleled those of Wickelgren and Corbett, demonstrating similar retrieval dynamics for wickelcall and associative recognition. If one assumes that wickelcall taps the processes of cued recall, both findings provide evidence against the hypothesis that the slower RTs in cued recall are due to a postretrieval process required to clean up a noisy vector and produce a response. However, the analyses suggest that a stronger, simpler, and more diagnostic study could provide even clearer evidence, and this study is now reported as Experiment 2 (an account of the wickelcall study is reported as Experiment 3). The critical condition of Experiment 2 used associative recognition as a diagnostic tool: Signal-to-respond tests consist of two words presented together; responses are withheld until a signal and then must be given immediately. The two words are either two words that had been studied together (targets) or two words from two different study pairs (distractors). The critical issue is the time course of retrieval in this case (which provides both alternatives and therefore obviates the need for a postretrieval clean-up operation) compared with that in cued recall and in single-word and pair recognition. Gronlund and Ratcliff (1989) used STR techniques to examine various forms of single-item, pair, and associative recognition. They found, as did Dosher (e.g., 1984b) and Hintzman and Curran (1994) in somewhat different tasks, that there is an initial period during associative recognition when retrieval seems to be based on familiarity and similar foils tend to be given "old" responses. Related to this finding, Gronlund and Ratcliff found that true associative information first begins to determine responding as much as 200 ms after familiarity begins to accumulate. These findings indicate one way that retrieval of associative information differs from retrieval of familiarity. Gronlund and Ratcliff also obtained point estimates of rate of growth, and surprisingly, these estimates indicated faster growth for associative conditions, but as the authors pointed out, these estimates were highly unreliable because of (among other things) trade-offs of parameter values for intercept and rate of growth. The present studies address these issues.
Outline of Experiment 2 Participants were tested on three types of recognition tasks and a cued-recall task in a signal-to-respond procedure. The cuedrecall task and the single-word recognition task each used one test word. The associative recognition and paired recognition tasks each used two test words. We decided to eliminate the variations of length and strength because they did not bear on the issues of present interest. In all cases, study lists consisted of pairs of items. Three types of recognition tasks were used: (a) a single-item recognition task that was the same as that used in Experiment 1 (single words as targets and new words as distractors), (b) an associative recognition task (intact pairs as targets and rearranged pairs as distractors), and (c) a paired recognition task (intact pairs as targets and pairs of new words as distractors). In addition, a cued-recall task was included; this task was the same as that used in Experiment 1.
Method Participants Ten Indiana University Bloomington graduate students received financial compensation for their participation in the experiment. There were a total of 10 experimental sessions and 1 training session.
Materials and Apparatus The stimuli were high-frequency English nouns (ranging from 21 to 2,012 occurrences per million) from 3 to 10 letters long (Francis & Kucera, 1982). Forty-four words were used on two practice lists to start the 1st experimental session, and 1,068 words were used in each experimental session. No word was studied on more than one list in a session, no word was tested more than once in a session, and a studied word could be tested in a session in the test period only immediately following its study list. The same pool of 1,068 words was permuted and used again for each session of the study. The words were displayed on IBM-compatible PCs. RTs were recorded using a voice-activated response box; subsequent typed responses used to verify accuracy were entered on the keyboard.
Design and Procedure Each session was divided into 24 study-test cycles. During study, participants saw a list of pairs of words. All pairs on a given list were presented at the same presentation rate. The length of each list was 20 pairs, with a presentation time of 1,000 ms per pair. Four test conditions were defined by the instructions given after the study period and at the start of the test list; the participants did not know the test condition during study. The same type of test was used for the entire test period for a given list. For two types of tests, single words were presented for tests, one at a time (single-word recognition and cued recall), and for the other two types of tests, pairs of words were presented for tests, two at a time (associative recognition and paired recognition). In the single-item recognition task, participants were asked to differentiate between an old word (the right or left word from a pair was tested with equal frequency) and a new word. In the cued-recall task, one word from a study pair was given (the right or left member of a pair was tested with equal frequency), and participants had to try to generate the other word of the pair. In the associative recognition task, participants were asked to differentiate between intact pairs and rearranged pairs of previously studied items (in all cases, the left-right assignment remained intact). In the paired recognition task, participants were asked to differentiate between intact pairs and new pairs of items (for new pairs, neither word had been
399
RETRIEVAL PROCESSES presented before). A test word or test pair always was presented centered on the screen. Each of the four conditions was tested six times in each session. All test lists consisted of 12 trials, regardless of condition. For the recognition conditions, 6 targets and 6 distractors, randomly intermixed, were tested. In single-item recognition and cued recall, half of the words tested had been studied on the right side of a pair, and half had been studied on the left side. For all conditions, the first and last pairs of each study list were not tested, and the last three presentations of the "testable" pairs (18 in total) were never tested first. The test list for associative recognition was constructed by randomly selecting 6 pairs out of the testable pairs (targets); 6 distractor pairs were generated by randomly selecting a right side of 1 of the remaining pairs (12 in total) and a left side of another pair (only one word per pair was used for the distractors). The test list for paired recognition was constructed by randomly selecting 6 pairs (targets) out of the testable pairs; 6 distractor pairs were generated by randomly selecting new words from the word pool. The test list for single-item recognition consisted of 6 randomly selected items from different pairs of testable words (half of which had been studied on the right side of a pair and half of which had been studied on the left side); 6 distractors were generated by randomly selecting 6 new words from the word pool. The test list for cued recall consisted of 12 randomly selected items from different pairs of testable words; again, half were presented on the right side and half on the left side. After the word pool was permuted for each session, the 24 study-test cycles were generated, and their order was randomized. A signal-to-respond procedure was used, with the procedures matching those used for Experiment 1. Response collection matched that for Experiment 1, with a voiced response followed by a typed response.
Results Trials that were marked invalid by the participants were excluded from all analyses (about 0.5% in total). We followed traditional practice and our own previous analyses of Experiment 1 by excluding also observations with RTs greater than 300 ms. The trials eliminated for each condition were about 14%, 19%, 16%, and 26% for single-item recognition, associative recognition, paired recognition, and cued recall, respectively. Another set of analyses excluding responses with RTs greater than 400 ms reduced these percentages to 2.6, 3.8, 2.9, and 6.2, respectively. The qualitative patterns of results did not change, however, and the statistical conclusions reported below were not altered for this enlarged data set. We therefore report the data with the 300-ms cutoff, the cutoff that matched our instructions and feedback.
Cued-Recall Intrusions For the cued-recall condition, trials on which the participants gave a positive verbal response (i.e., "P—word"), followed by an incorrect typed response, were labeled as intrusions. The intrusions that were typographical errors of correct responses were recoded as correct responses (a total of 7.9% of all intrusions). The other intrusions were analyzed the same way as in Experiment 1. Table 10 shows the proportion of intrusions in each category. As in Experiment 1, most intrusions were words from the current lists or the previous lists (about 75% of the total).
Asymptotic Accuracy We again assessed asymptotic accuracy by averaging results over the longest three lags (2,500, 3,500, and 4,500 ms). Table 11 shows the asymptotic results for the probability of an "old" re-
Table 10 Intrusion Results for Experiment 2 Category
Proportion
Current list Previous list Semantic—target Semantic—cue Unknown
.464 .282 .114 .069 .071
sponse (hits and false alarms) for the three recognition conditions, d' for these conditions, and the probabilities of correct recall and intrusions. For the recognition conditions, ANOVAs showed a significant effect for d' and false alarms but not for bits: for d', F(2, 18) = 10.29, MSE = 0.29, and for false alarms, F(2, 18) = 22.71, MSE = 0.26. Paired performance was superior to the other recognition conditions. The single-item and associative recognition conditions did not differ significantly on hits, false alarms, or d\ a surprising result that is taken up in the discussion.
Retrieval Dynamics Assessed by Exponential Functions As in Experiment 1, we fitted exponential functions to d' for the recognition conditions and p(c) for the cued-recall conditions as a function of total processing time. However, there are other ways to measure recognition performance, and there are a number of potential problems in comparing intercept and rate of growth parameters when the measurements lie on different scales, such as p(c) for cued recall and d' for recognition. We decided to tackle these issues by (a) scoring the recognition data in four ways and (b) transforming the measurements to lie on similar scales. The measures that we used to assess recognition were d' (on a scale from 0 or even less to infinity; see Green & Swets, 1966); A' assuming a standard deviation ratio of .8 and A' assuming a standard deviation ratio of 1.0 (see Snodgrass & Corwin, 1988), and Gamma (see Nelson, 1984). Gamma is defined as (H — F)/(H + F - 2HF), where H is the hit rate and F is the false-alarm rate (see Nelson, 1984), and is bound in [0, 1] when H > F. For H < F, Gamma was set to 0. For the A' measures, H and F were first transformed to z scores, after which A' was computed (see Iverson & Sheu, 1992, Equation 8b). The resulting z score, A', was transformed into a proportion that ranged from .5 to 1. These values were transformed by 2p — 1 (truncated at 0), where p is the proportion, to the range [0, 1] to yield measures comparable to cued recall. The A' measures, Gamma, and p(c) lie in the interval [0, 1]; for each of these, the goodness of fit used to fit the exponential function was assessed after an arcsine transformation was applied to better equate variances (see Footnote 4). The fits were then evaluated by the proportion of variance accounted for, adjusted for the number of free parameters, as described for Experiment 1. Figure 5A gives the results for d'\ it shows the observed recognition data with the best fitting exponential functions. Figure 5B shows the observed cued-recall data, pic), with the best fitting exponential function. These were obtained by letting all parameters vary with conditions, for a total of 12 free parameters, for which the best fitting values are shown in Table 12. The point
NOBEL AND SHIFFRIN
400
Table 12 Best Fitting Parameters of the Exponential Function (Experiment 2)
Table 11
Asymptotic Accuracy Results for Experiment 2 Response
Response
Condition Condition
HI
FA
d'
Single RN Paired RN Associative RN Cued recall
.78 .75 .75
.21 .06 .21
1.69 2.20 1.62
CO
IN
.24
.10
Note. All values were computed by first averaging across participants and sessions and then averaging across the longest three lags. HI = hits; FA = false alarms; CO = corrects; IN = intrusions; RN = recognition.
estimates of these parameters are not too meaningful because of high variability of the estimates in some cases and because of the interdependencies of the growth rate and intercept parameters. We calculated the results for a variety of restricted models, with outcomes that are discussed below, but we first provide a more
1
i
1
!
2.5 - -A T7
^
_
v
2.0 /
c Q.
/
1.5 -
I 6
6 _^
0.5 -
I ///
' u it
•
a
.
&
Recognition —•— single —^— associative —^— paired
f
0.0 -
_
A
i 1.0 -
v
•
1
\
1000
2000
1
1
3000
4000
5000
Total Processing Time (ms)
B 0.3 o o
o o
o
S0.2-
0.1 -
-
—o— Cued recall 0.0 -
/ 1000
2000
3000
4000
5000
Total Processing Time (ms) Figure 5. Experiment 2 signal-to-respond accuracy as a function of total processing time. A: d' results for recognition; B: p(c) for cued recall. Symbols are the observed data; lines are the predicted exponential functions for the full models. Best fitting parameters can be found in Table 12. Proportion of variance explained: r2 = .939 for single-item recognition, r2 = .896 for paired recognition, r2 = .875 for associative recognition, and r2 = .872 for cued recall.
Free parameter
Single RN
Paired RN
Associative RN
Cued recall
/ G A
357 56 1.68
279 133 2.26
317 319 1.54
173 831 0.26
Note. RN = recognition; 7 = intercept (ms); G = growth rate (ms); A = asymptote.
readily interpretable and easy-to-perceive measure of the differences in intercepts and growth rates across the conditions. Figure 6A shows the 95% confidence contours for the best fitting retrieval dynamics parameters (/ and G), for the a" measure, and for cued recall p(c). These contours were obtained by comparing the full model, in which all parameters were free to vary, with a restricted model, in which the asymptote was the only free parameter. A grid search was performed for fixed values of / and G, and the sum of squared errors was minimized while A was varied. The error values of the full and restricted models were then compared through an F test (see, e.g., Neter et al., 1985), with two degrees of freedom for the numerator and seven degrees of freedom for the denominator. The a level was set at .05; if the restricted model did not fit significantly worse, that particular combination of / and G fell inside the 95% confidence region; otherwise, it fell outside the region. The combinations of / and G that formed the boundary are plotted in Figure 6. This procedure was repeated separately for each of the four conditions. This contour map is a useful way of displaying the results because it displays the well-known interdependencies of the intercept and growth rate parameters. The confidence intervals are elongated regions with a major diagonal having a negative slope. Thus, a slow growth rate tends to be associated with a small intercept, and vice versa. One of these parameters can partially compensate for changes in the other. The procedure that was used to produce the results for the a" measure that are depicted in Figure 6A was repeated for each of the other measures of recognition performance, with results shown in the next three panels: Gamma in Figure 6B, A' with a standard deviation ratio of .8 in Figure 6C, and A' with a standard deviation ratio of 1.0 in Figure 6D; the cued-recall plot is the same in all four panels but is repeated for convenience of comparison. The panels of Figure 6 tell much the same story: Retrieval dynamics for cued recall and associative recognition were fairly similar with partially overlapping confidence intervals; both exhibited slower growth than either item or pair recognition. (Item recognition tends to have larger intercepts and faster growth rates than pair recognition.) These points were confirmed statistically by comparing the four conditions in pairwise fashion, in all combinations. In each case, a free fit of all parameters was compared (a) with a model that had a common intercept and growth rate and (b) with a model that had a common growth rate (for the d' recognition measure only). For a", the only restricted model with a common intercept and growth rate that did not fit significantly worse than the full model was the
RETRIEVAL PROCESSES i
A 500 - .
400 -
2 3
300 -
Ill
—i 1 1: Item recognition II: Pair recognition III: Associative recognition IV: Cued recall
401 -•
-
•
T "
B
1: Item recognition II: Pair recognition III: Associative recognition IV: Cued recall
500 -
dy
IV 400 -
I I" I 300-
200 -
200 -
\
\ 100 -
100 -
\
\ \
" v\ i
1 400
—. -1 800
1 1200
1
1600
0 -
1— 800
^
2000
400
Growth Rate (G)
1
1600
2000
Growth Rate (G)
600
i
D
I: Item recognition II: Pair recognition III: Associative recognition IV: Cued recall
500
1
1200
i
1: Item recognition II: Pair recognition III: Associative recognition IV: Cued recall
500 IV 400 -
-
III
J
300IWi
\
\
200 -
\
\
\
II \ 100 -
\
0 400
800
1200
1600
2000
Growth Rate (G)
1_ 400
800
1200
1
1600
2000
Growth Rate (G)
Figure 6. Experiment 2: 95% confidence contours for intercept and growth rate for single-item recognition, paired recognition, associative recognition, and cued recall. A shows d', B shows Gamma, C shows A' with a standard deviation ratio of .8, and D shows A' with a standard deviation ratio of 1.0.
one for associative recognition and cued recall, F(2,18) = 1.97, MSE = 0.018, p = .168; all other pairwise comparisons yielded F values with ps < .001. When the growth rates were considered alone, the associative recognition and cued-recall conditions did not differ significantly, F(l, 18) = 3.89, MSE = 0.018, p = .064, of course, and all other comparisons did. For Gamma, the only restricted model with a common intercept and growth rate that did not fit significantly worse than the full model was the one for associative recognition and
cued recall, F(2, 18) = 2.37, MSE = 0.028, p = .122; all other pairwise comparisons yielded F values withps < .01. For both A' measures (standard deviation ratios of 1.0 and .8), two restricted models with a common intercept and growth rate did not fit significantly worse than the full model, namely, for single-item recognition and paired recognition, F(2, 18) = 2.71, MSE = 0.007, p = .094, for a ratio of 1.0, and F(2, 18) = 2.29, MSE = 0.008, p = .130, for a ratio of .8, and for associative recognition and cued recall, F(2,18) = 2.52, MSE = 0.003, p =
NOBEL AND SHIFFRIN
402
.108, for a ratio of 1.0, and F(2, 18) = 2.74, MSE = 0.003, p = .091, for a ratio of .8. The results of all these analyses suggest that the differences among the growth rate and intercept parameters among the conditions were not due to differences in the range or type of the scales of measurement. Whether the measures we looked at are the measures that ought to be used for recall and recognition is a somewhat different and more difficult question. This issue is addressed in the discussion following Experiment 3.
Experiment 3 When measured in any of the standard ways, information grows more rapidly for single-item old-new recognition and for paired recognition than for associative recognition and cued recall. Experiment 3 provides supporting evidence from a related procedure.11 The "yes-no recall" signal-to-respond procedure used by Wickelgren and Corbett (1977) is very similar to cued recall. The idea is to provide a cue for cued recall, which the participant is to use to try to recover an answer. However, the answer, if generated, is to be withheld until a later point in time. The participant is interrupted at a certain time and provided with a candidate response word to which a "yes-no" response must be given at once. This candidate response is always a word from the list, and so is familiar, but may or may not have been studied with the cue word. If the participant has already retrieved a word in a form that can be output, it ought to be possible to very quickly match it to the provided answer. The trick is to allow so little time for a response that a correct answer cannot be given unless the response has already been retrieved. It is known that intact rearranged decisions are quite slow, and the point in time at which such decisions begin to rise above chance performance is a few hundred milliseconds later than the point in time at which old-new recognition decisions begin to rise above chance performance (220 ms later in Gronlund & Ratcliff, 1989; see also Dosher, 1981; Hintzman & Curran, 1994). Thus, requiring a rapid response allows time for matching to occur in cases in which the correct answer has been generated by the participant during the interval between cue and probe (as demonstrated by Wickelgren & Corbett, 1977) but does not allow time for coming to a correct decision if the cleaning-up process has not been finished. We term this procedure wickelcall. If the sequential sampling model for cued recall is correct, then performance should gradually rise as signal delay increases, reflecting the cases in which the correct image has been sampled up to that point in time. For example, if the free-response data show that 10% of correct recalls occur after 3 s, then the new technique will still be (roughly) 10% short of asymptotic performance at a 3-s test. In contrast, if cleaning up a retrieved trace is what takes the extra time in recall, then the provided answer should eliminate this step, and performance should reach asymptote no later than the point in time at which recognition responses cease to occur (about 2 s; see Figure 1). A wickelcall test requires participants to decide whether two words were presented together in the same pair at study or were presented in two different pairs at study. This is thus a sequential version of associative recognition (used in Experiment 2). A regular associative recognition condition was also used in this study: Two words from the same pair or different pairs were presented
simultaneously at the start of the trial, and the participant responded when a later signal arrived.
Method Participants Ten Indiana University Bloomington graduate students received financial compensation for their participation in the experiment. There were a total of 10 experimental sessions and 1 or 2 training sessions.
Materials and Apparatus The stimuli were high-frequency English nouns (ranging from 21 to 2,012 occurrences per million) from three to nine letters long (Francis & Kucera, 1982). Forty words were used on two practice lists to start the 1st experimental session, and 960 words were used in each experimental session. Other details matched those for Experiment 2.
Design and Procedure Each session was divided into 32 study-test cycles. During study, participants saw a list of pairs of words. All pairs on a given list were presented at the same presentation rate. Varied between lists were the length of the list (10 or 20 pairs) and the presentation time (2 or 6 s per pair; though these variations were not of major importance for the purposes of this article). After presentation of the list, a simple arithmetic task (addition) was given for 16 s. Participants had 10 s to type their addition answer on the keyboard. Two test conditions were defined by the instructions given after the arithmetic period and at the start of the test list; during list presentation, the participants did not know which test condition would be used. The same type of test was used for the entire test period for a given list. In the associative recognition condition, participants were asked to differentiate between intact pairs and rearranged pairs of previously studied items (in all cases, the left-right assignment remained intact). In the wickelcall condition, one word from a study pair was given, and the other word was replaced by a question mark (the right or left member of a pair was tested with equal frequency, and the left-right assignment remained intact), and participants had to try to generate the other word of the pair but withhold any overt response. After a variable lag, the question mark was replaced with a word from the study list; this second word could be either the correct word from the studied pair or a word from another pair on the study list. The participants were asked whether the second word matched the one they studied with the first word. Each of the four lists that had a particular combination of length and strength was tested four times in each condition in each session. A session consisted of two equal parts divided by a small break. Each part contained two randomized blocks of the eight types of lists. Test lists consisted of 10 pairs (5 intact and 5 rearranged) for the short lists and 20 pairs (10 intact and 10 rearranged) for the long lists. In the wickelcall condition, the question mark appeared on each side on half of the trials. For the long lists, the testing order was blocked; the first 10
1
' An early version of Experiment 1 used presentation times of 2 and 6 s and list lengths of 10 and 20 pairs; this study was redone (and reported as Experiment 1 in this article) with different manipulations of length and strength to produce observable effects of these variables on accuracy. The wickelcall study was carried out after this early study and therefore used its values for length and strength manipulations. By the time we carried out the study reported in this article as Experiment 2, we realized that manipulations of length and strength were not needed to study differences in RTs between different tasks.
RETRIEVAL PROCESSES presented pairs during study were tested first, followed by the second 10 presented pairs. After the word pool was permuted for each session, the 32 study-test cycles were generated, and their order was randomized. The response collection procedures followed those of Experiments 1 and 2 for signal to respond, with the following differences: Participants gave no voiced response; they provided binary typed responses and were asked to respond within 200 ms after the tone. In the wickelcall condition, the probe consisted of just one word, and the response word at most delays appeared 200 ms prior to the tone (in effect allowing 400 ms for participants to respond from the presentation of the probe); lags of 100 and 200 ms were identical to associative recognition (simultaneous presentation of the two word cues), and at a lag of 300 ms, the probe word preceded the test word by only 100 ms. In both conditions, if no response had been given 200 ms after the tone, the trial was marked as invalid.
403
tion was better than on lists with fast rates of presentation: for d', F(l, 9) = 15.85, MSE = 0.31; for hits and misses, F(l, 9) = 7.71, MSE = 0.02, p = .022; and for correct rejections and false alarms, F(l, 9) = 10.14, MSE = 0.01, p = .011. In general, these results are similar to those from Experiment 2, showing asymptotic accuracy differences as a function of length and strength variations. The dependence was somewhat weaker in this study, possibly because in this study the list-length variation was less extreme and the presentation times were slower overall, making the presentation time variation less extreme because of the nonlinear increase in performance with increasing study time.
Retrieval Dynamics Assessed by Exponential Functions Results Trials that were marked invalid (RTs > 200 ms) were excluded from all analyses. In total, approximately 9% of the associative recognition responses were excluded, and 13% of the wickelcall responses were excluded.
Asymptotic Accuracy Asymptotic accuracy, the average over the longest three lags (1,400, 2,500, and 4,500 ms), is given in Table 13 for hits, false alarms, and d' for the various conditions. For the wickelcall condition, ANOVAs showed significant effects for list length but not for presentation time. Performance on the short lists was better than on the long lists: for d', F(l, 9) = 27.76, MSE = 0.09; for hits and misses, F(l, 9) = 26.38, MSE = 0.01; and for correct rejections and false alarms, F(l, 9) = 6.61, MSE = 0.01, p = .030. No significant effects were observed for the variable presentation time. For the associative recognition condition, ANOVAs showed significant effects for list length and presentation time on almost all accuracy measures. Performance on the short lists was better than on the long lists: for d', F(l, 9) = 53.31, MSE = 0.05, and for hits and misses, F(l, 9) = 32.36, MSE = 0.01; no significant differences were found for correct rejections and false alarms. In a similar manner, performance on lists with slow rates of presenta-
We fitted exponential functions to d' as a function of total processing time, as in the first two studies. For each combination of length and strength, the left-hand panels of Figure 7 show the observed data for wickelcall, and the right-hand panels show the same for associative recognition. To fit the data for each task, we first let all parameters vary with conditions (12 free parameters) and then fitted a restricted model with a common intercept and growth rate but different asymptotes (6 free parameters). The full and restricted models were compared through an ANOVA (see, e.g., Neter et al., 1985). For wickelcall, the restricted model did not fit significantly worse than the full model, F(6, 28) = 0.48, MSE = 0.01, p = .816. For associative recognition, the restricted model also did not fit significantly worse than the full model, F(6, 28) = 0.52, MSE = 0.02, p = .787. The exponential functions shown in Figure 7 are the predictions for the restricted models. The values of the best fitting parameters for both models are shown in Table 14. The slow and regular growth curves in Figure 7 and the growth rate parameter values are consistent with the time course results from Experiments 1 and 2 for cued recall, and not recognition. In general, the results are consistent with those of Dosher (1984a), who studied associative recognition and found that variation of presentation time produced asymptotic accuracy differences but not differences in retrieval dynamics.
Comparing Retrieval Dynamics in Recognition and Recall Table 13 Asymptotic Accuracy Results for Experiment 3 Wickelcall
Associative recognition
Condition
HI
FA
d'
HI
FA
d'
10-2,000 10-6,000 20-2,000 20-6,000 10 pairs 20 pairs 2,000 ms 6,000 ms
.41 .42 .33 .37 .42 .35 .35 .39
.18 .14
0.75 0.91 0.54 0.54 0.85 0.56 0.64 0.70
.75 .81 .66 .74 .78 .70 .69 .76
.24 .19 .26 .21 .22 .23 .25 .21
1.51 1.88 1.17 1.61 1.73 1.37 1.29 1.70
.17 .21 .16 .19 .17 .18
Note. All values were computed by first averaging across participants and sessions and then averaging across the longest three lags. The conditions in the first four rows represent list length (10 or 20 pairs) followed by presentation time (2,000 or 6,000 ms). The data for the fifth and sixth rows are for the two list lengths collapsed across presentation time, and the data for the last two rows are for the two presentation times collapsed across list length. HI = hits; FA = false alarms.
Figure 8 shows the observed associative recognition and wickelcall data, collapsed over length and strength. In addition, singleitem recognition results are shown from a comparable experiment carried out a few years earlier with a different set of participants (using the same list lengths, presentation times, and procedures, except that the time following the signal in which the participants had to respond was limited to 300 ms; Nobel & Shiffrin, 1992). Each curve is shown with the best fitting exponential function. Table 15 gives the values of the best fitting parameters. Figure 9 shows the 95% confidence contours for the best fitting retrieval dynamics parameters (/ and G). See the discussion in Experiment 2 for the construction methods and interpretation. The large overlap of the associative recognition and wickelcall contours indicates the same underlying retrieval parameters. Pairwise comparisons of the three conditions confirmed the conclusions evident in the graph: The only restricted model with a common intercept and growth rate that did not fit significantly worse than the full model was the one for associative recognition and wickelcall, F(2, 14) = 1.97, MSE = 0.01,/? = .177. The other restricted
NOBEL AND SHIFFRIN
404
2.0 0
V-cT
1.5 -
f 1.00.5 0.0 -
0
1000 2000 3000 4000 Total Processing Time (ms)
LJ.—|
5000
1
—o— 10 pairs • » - - 40 pairs
1
1000 2000 3000 4000 Total Processing Time (ms)
5000
1000 2000 3000 4000 Total Processing Time (ms)
5000
1.25 1.00 a> 0.75
0.50 0.25
>— 670 ms • • - 2000 ms
0.0
0.00 1000 2000 3000 4000 Total Processing Time (ms)
5000
0
Figure 7. Experiment 3: The left-hand panels show wickelcall results, and the right-hand panels show associative recognition results for the four length-strength conditions (d' as a function of total processing time). Symbols are the observed data; lines are the predicted exponential functions for therestrictedmodel with a common intercept and growth rate. Best fitting parameters can be found in Table 14.
models fitted significantly worse than the full models: for wickelcall and single-item recognition, F(2,14) = 15.58, MSE = 0.01, and for associative recognition and single-item recognition, F(2, 14) = 21.89, MSE = 0.01. We also compared the conditions in pairwise fashion for the case in which only the growth rate parameter was fixed across conditions. In this case, wickelcall and associative recognition did not differ significantly, of course, and the other two comparisons did, F(l, 14) = 14.66, MSE = 0.002, for associative recognition and single-item recognition and F(l, 14) = 8.22, MSE = 0.007, p = .012, for wickelcall and single-item recognition. Comparing the conditions in pairwise fashion with a restricted model in which only the intercept parameter was fixed across conditions yielded no significant results. These results suggest slower retrieval for wickelcall and associative recognition than for single-item recognition.
Discussion Using both free response and signal-to-respond, Experiment 1 demonstrated slower retrieval for cued recall than recognition. According to one interpretation, recognition operates in one step of parallel activation producing a value of familiarity, whereas cued recall proceeds as a sequence of sampling and recovery operations (e.g., Gillund & Shiffrin, 1984; Raaijmakers & Shiffrin, 1980).
Experiments 2 and 3 examined the alternative possibility that episodic retrieval in cued recall proceeds with a time course like that in episodic recognition but that recall requires an additional protracted process that cleans up the retrieved information in order to produce a response, probably through reference to a lexical store. The wickelcall and associative recognition conditions provide the relevant words to the participants and therefore should have eliminated the need for a protracted additional process. Nonetheless, the retrieval dynamics were very slow compared with single-word recognition and were statistically consistent with those in cued recall, suggesting instead that retrieval in wickelcall and associative recognition proceeds as it does in cued recall. We suggest that in each of these cases retrieval operates as a sequential search. The astute reader will have noted that the asymptotic performance level for wickelcall was quite low, much lower than the comparable associative recognition level. This result had been found by Wickelgren and Corbett (1977; for associative recognition of both pairs and triples). A version of their explanation seems reasonable: Suppose both wickelcall and associative recognition operate as a search process. In associative recognition, each of the two test items might be used as recall cues, with each route contributing something independent to the observed performance
RETRIEVAL PROCESSES Table 14 Best Fitting Parameters of the Exponential Function (Experiment 3)
405
Table 15 Best Fitting Parameters of the Exponential Functions (Experiment 3 and Nobel & Shijfrin, 1992)
Condition Free parameter
10 pairs
20 pairs
Condition
2,000 ms
2
6,000 ms
r
Free parameter
Single-item recognition
Wickelcall
Associative recognition
/ G A
376 190 2.05
475 661 0.76
423 422 1.52
Wickelcall k= 12 529 410 0.61
501 549 0.69
539 577 0.75
.921
G A
381 880 0.96
I G A
503 612 0.91
503 612 0.66
503 612 0.71
503 612 0.74
.928
Note. The wickelcall and associative recognition data are from Experiment 3 (collapsed across length and strength); the single-item recognition data are from a comparable experiment (Nobel & Shiffrin, 1992). / = intercept (ms); G = growth rate (ms); A = asymptote.
Associative recognition k= 12 413 467 1.81
428 410 1.42
479 311 1.33
372 552 1.79
.959
G A I G A
417 445 1.79
417 445 1.44
417 445 1.38
417 445 1.74
.963
Note, k = number of free parameters; / = intercept (ms); G = growth rate (ms); A = asymptote.
level. In wickelcall, only one word is available as a recall cue until the second arrives, and then there is not sufficient time to carry out a recall operation with the second word, possibly accounting for the performance difference. It is interesting that Wickelgren and Corbett compared wickelcall for learned pairs and triples, both cued with one word at the start of retrieval and then tested after a delay with a second word. To perform well in the triple condition,
participants would have had to recall at least one and sometimes both of the other words in a triple and had these ready for rapid matching. The advantage of associative recognition over wickelcall was surprisingly similar for pairs and triples, consistent with a model in which sampling is used during the delay period to locate the relevant pair or triple, the contents of which are then used at final test to make a decision (see Shiffrin, Murnane, Gronlund, & Roth, 1989, for additional evidence and arguments supporting this point). The associative recognition and wickelcall results from Experiment 3 come from a different study with different participants than the (earlier) single-word recognition study with which they are compared. In addition, it is questionable whether it is proper to compare single-word testing with two-word testing. However, Experiment 2 eliminated these potential problems, and the results gave rise to the same conclusions: Measured in any of the standard
700
600 - -
500 - -
400 - Item recognition Associative recognition Wickcall
300--
0.0 1000
2000
3000
4000
5000
200 - -
Total Processing Time (ms) Figure 8. Comparison of wickelcall and associative recognition (both from Experiment 3) and single-item recognition (data from Nobel & Shiffrin, 1992), showing d' as a function of total processing time. Symbols are the observed data (all data are collapsed across length and strength); lines are the predicted exponential functions for the full model. Best fitting parameters can be found in Table 15. Proportion of variance explained: r2 = .933 for wickelcall, r2 = .973 for associative recognition, and r2 = .990 for single-item recognition.
Item recognition B = Associative recognition C = Wickelcall
100 400
800
1200
1600
2000
Growth Rate (G) Figure 9. Experiment 3: 95% confidence contours for intercept and growth rate for wickelcall, associative recognition, and single-item recognition.
406
NOBEL AND SHIFFRIN
ways, information grows more rapidly for single-item old-new recognition and for paired recognition than for associative recognition and cued recall. It is now time to ask how commensurate are the measurements for cued recall and the various forms of recognition. For example, if in cued recall the cube root of performance—that is, of p(c)— was plotted as a function of time, the rate of growth would be larger, perhaps becoming similar to that in single-item recognition. There are several things one might say about such concerns. First, in the absence of some plausible model to justify measuring performance in this way, such an approach is just another way of describing the observation that the rates of growth differ. Second, even within the recognition domain, distinctly different rates of growth occur for single-item and paired recognition compared with associative recognition. We propose an account of this finding in which associative recognition is carried out through the use of recall, thereby exhibiting slower rates of growth. Arguments positing different measurement scales for cued recall and recognition would not provide a plausible account of this pattern of results. Experiments 2 and 3 addressed the possibility that there is a retrieval phase in cued recall that operates as quickly as retrieval in recognition but that the slow recall responses are due to the need to clean up the (rapidly) retrieved noisy trace. Such an argument does not seem consistent with either the wickelcall or associative recognition results: Both provide explicit response alternatives to the participant and, hence, should not require slow cleaning up of a retrieved trace. Why then is associative recognition slow? Why cannot the participant use a parallel computation of familiarity (a fast process) to carry out this task? There are several answers to consider. The first allows the possibility that familiarity is indeed used to carry out associative recognition but produces rather poor performance levels in comparison with recall processes. It is therefore used in parallel with recall processes but changes performance too little to be noticed. The best evidence for such a familiarity process acting in combination with recall would occur at very small lags in signal to respond, at a point in time before recall processes kick in. Unfortunately, the data at such observation intervals are notoriously noisy and unreliable, in our experiments and others as well, making it most difficult even to demonstrate an early use of familiarity, let alone demonstrate greater familiarity for intact than rearranged test pairs. Perhaps the most that can be said is that there are hints in our recall and associative recognition STR functions, and in related data from Dosher (1984b) and Gronlund and Ratcliff (1989), that there may be an early period during which associative and recall performance is above chance, but the functions are not yet rising rapidly according to the exponential rates characteristic of the rest of the STR functions. It may not be wise to draw any stronger conclusions, partly because variability in intercept across participants, trials, and items could produce similar patterns. A second answer also assumes that familiarity-based associative recognition is relatively ineffective and that, for this reason, participants may choose not to use a retrieval strategy that uses this basis for response. There may be a number of related reasons why associative recognition is relatively ineffective when based on familiarity. Most of these reasons are based on quantitative details of the processes assumed to carry out associative recognition by means of familiarity, but a few general considerations are worth
noting. First, words in the test pairs are individually as familiar whether they are in intact or rearranged pairs, if assessed in isolation. This fact alone may make it difficult to detect additional familiarity due to configural properties, especially if there is considerable variability in individual item familiarity so that a panmay seem familiar by virtue of very high familiarity of one component alone. The degree of extra familiarity to be expected for intact pair testing would depend on the model or models used to handle this case. One idea is that the context of other items may cause the encoding of a given item to change (e.g., diamond in the context of wedding may be coded differently than diamond in the context of card game; see Clark & Shiffrin, 1987; Dosher & Rosedale, 1989, for relevant data and discussion). Another idea is that retrieval with a compound cue consisting of both words tends to match or activate an intact pair to a degree beyond that expected for the sum of the activations of two rearranged pairs. Both these predictions depend on the details of the storage and activation models, including any limited capacity that would prevent full use of multiple words or their features as compound cues. Related issues concern the possibility of separate storage of information for a single item and for a pair containing that single item. For example, Dosher and Rosedale (1989, 1997) argued for functional independence of stored single-item information and stored pair (or triple) item information (an "ensemble"). One might superficially think that separate storage of ensemble information would increase the usefulness of familiarity as a retrieval strategy, but this possibility and the others mentioned would require quantitative modeling to assess the strength of the arguments (see Shiffrin & Steyvers, 1998, for one approach to this issue). At this point, we can say only that it is plausible that for any one of several reasons the use of joint familiarity to carry out associative recognition might be a relatively ineffective process. Whatever the reason, we hypothesize that associative recognition is carried out primarily by sampling and recovery cycles in a search process. Such a model is similar to that presented for cued recall in the companion article by Diller et al. (2001) and is sketched below. If so, the similar retrieval dynamics for cued recall and associative recognition would be expected. The similarity of accuracy in Experiment 2 for associative recognition and single-item recognition (despite the RT difference) was unexpected at first glance. In previous studies (e.g., Clark & Shiffrin, 1987, 1992), associative recognition exhibited poorer performance than single-item recognition. However, the present results argue for different retrieval mechanisms in the two tasks, and if so, there is no necessary relation between performance in the two cases. For example, if associative recognition operates by sampling of separately stored pair-image traces, a sampled pair image could be judged "old" if both parts match the probe but judged "new" if just one part matches (resampling probably would occur if nothing matches). Such a source of information might selectively enhance associative recognition performance in comparison with single-word recognition carried out by a global summation of familiarity. In addition to such retrieval-model considerations, storage strategies could also play a role. For example, our well-trained participants may have become efficient at associative coding, coding that allows generation of an associate when the appropriate image is sampled. Alternatively, the participants may have put less emphasis on context (which allows discrimination of list items from new items) and more emphasis on interitem coding.
RETRIEVAL PROCESSES
The observed higher level of performance for pair than singleword recognition would be expected under the assumptions of almost any model, because presenting two words rather than one, when the distractors consist of two new words, more or less gives two chances of discriminating correctly. The dynamics of retrieval are more surprising: It appears that pair recognition showed slightly lower intercepts and slightly slower information retrieval than single-word recognition (see Figures 5 and 6 and Table 12). The lower intercept might reflect variability in feature encoding, the minimum time for the first features to become active, getting lower as the number of features increase. Slower growth rate might be due to some sort of limitation of parallel decision making, if, for example, the response rule requires separate calculation of the familiarity values of the two words, and the product of these values determines the decision. However one explains the differences in retrieval dynamics for single-word and pair recognition, the slowing of retrieval caused by the presence of two test words is quite small and does not come close to explaining the large amount of slowing of retrieval seen in associative recognition. This provides some confidence for concluding that associative recognition is an extended process in time, quite possibly due to a search process containing cycles of sampling and recovery. On Models for Recognition and Recall In the companion article, Diller et al. (2001) provide quantitative simulation models for single-item recognition and cued recall and fit the models to the data from these tasks for both free response and signal-to-respond. In that article, possible extensions to pair recognition, associative recognition, and wickelcall are also discussed. The reader is referred to that article for details. Here we give only a brief summary of the basic approach for single-word recognition and cued recall.
The Assessment of Retrieval Completion (ARC)-REM Recognition Model A word is represented as a vector of 20 nonzero feature values. A studied word pair is copied into memory as an image that is incomplete (some values are zero) and error-prone (some values are copied incorrectly). The study time determines the number of nonzero entries. This episodic image for a pair of words is represented as a vector of 40 feature values, 20 for each word, including zero values. When a test word appears at a given moment in time, t, its (complete or incomplete) vector is matched in parallel to all the episodic images of words from the list (for single-word recognition, the double-length vectors for pairs are treated as two single-word vectors). For each episodic image, the matching consists of a count of the mismatching values, excluding zeros, and a count of the matching cases and their values. These numbers are converted by formula (see Diller et al., 2001; Shiffrin & Steyvers, 1997) to a likelihood ratio for each image. The likelihood ratio gives the probability that the image was stored during study of the test word, divided by the probability that the image was stored during study of something else. These likelihood ratios are averaged to produce the odds for that moment in time, t. How / is chosen for free response and signal-to-respond is discussed in the
407
next paragraph. A default decision of "old" is given if the odds are greater than 1, but this criterion can be adjusted by the participant. The ARC-REM model (in Diller et al., 2001) assumes that the features of the probe become active individually, in highly variable fashion. While this is happening, the features of each image are decaying exponentially. Comparison of a given feature takes place only when both a probe feature and a corresponding image feature are active at the same time. Once an image feature is compared, however, it is protected from further forgetting. In free response, a response is made when a high enough proportion (an estimated parameter) of the probe features have become active (ARC is a key assumption enabling the model to predict accuracy differences but not RT differences when length and strength are varied). In signalto-respond tasks, the odds are calculated on the basis of the comparisons that have been made up to the time of the signal.
The ARC-REM Model for Cued Recall The recognition and cued-recall models of Diller et al. (2001) are essentially identical to the point at which likelihood ratios have been calculated on the basis of matching values of a test word to memory images (in cued recall using free response, the likelihoods are calculated when all probe features have become active). These likelihood ratios are then used as the basis for cued recall. The cued-recall model is more complicated than that for recognition because it consists of a series of steps, each involving sampling of an image, recovery of information from the sampled image, and decisions. This is termed the memory search. The memory search has the following stages. First, use the test word to generate likelihood ratios for the episodic images of each word from the study list. These remain fixed through the rest of the search for that trial. Second, for each pair, select the maximumlikelihood ratio.12 Sample a pair proportional to these maxima raised to a fractional power. Third, examine the match between the test word and the word image sampled: If the match is good enough, accept this pair as the one being sought; if not, then skip to Step 6. The criterion for acceptance drops as the 5-s period for accepting nears its end. Fourth, try to recover information from the other word image in the accepted pair. The ability to output an answer depends on the number of features in that word image, or else skip to Step 6. Fifth, if a word is output, the probability that it will be correct depends on the likelihood ratio for the sampled pair, or else an intrusion is made. Sixth, an exit from Step 3 or 4 triggers a decision whether to give up and terminate the search. This decision is based on the familiarity of the test word; that is, if the odds that the test word is "old" are below a criterion, the search is terminated. This decision becomes more liberal as the 5-s period for responding nears its end. Seventh, if a decision is made to continue, the search returns to Step 2, and sampling is made again with replacement. All of the steps in the search have associated distributions of times. The time for Step 1 is that determined by the rules for recognition, and the subsequent steps have times that are described 12 One could just as easily assume that a pair image is sampled on the basis of the individual word likelihood ratios raised to a fractional power. The alternative models would likely be indistinguishable for the present data, but there might be testable differences for tasks in which the two words of a pair vary in their similarity.
NOBEL AND SHIFFRIN
408
in Diller et al. (2001). For signal-to-respond, one could imagine complicated modifications in which search continues despite low familiarity of the probe word or is continued past the point when a plausible response is first encountered. However, we simply assumed that the free-response model continues until the signal: A response recovered by that time is output, or else a give-up response is made. General Discussion We are proposing that single-item and paired recognition are carried out by a process of parallel access to recent episodic images; the results of retrieval are combined and used to drive a decision process leading to a relatively fast response (either "old" or "new"). We are suggesting that cued recall and associative recognition are carried out through a memory search, with successive sampling and recovery until a relevant image is located, producing responses that are skewed toward longer RTs. The associative recognition conditions are particularly diagnostic because the slow responses in cued recall could otherwise have been ascribed to a process of cleaning up (possibly through lexical access) a memory trace retrieved in a single rapid step. Associative recognition provides the two alternatives at test, obviating the need for such a clean-up process. The wickelcall findings support the same argument. It is interesting to note that the pattern of results from Experiment 1 in single-word recognition is similar to that in cued recall (i.e., substantial accuracy differences and small or missing RT differences across length and strength conditions). It is quite possible for this reason that a model similar to that proposed for recognition, based on one retrieval step, could be applied to cued recall. However, the parameters of such a model would have to be quite different from those for recognition to predict the much slower retrieval in cued recall. In the absence of any obvious reason why retrieval based on the single-word cue used in both paradigms should have quite different temporal characteristics, we prefer to assume that different retrieval processes are operating in recognition and cued recall (and in pair vs. associative recognition paradigms as well). Why should different retrieval processes be used in cued recall and associative recognition than in single-word and pair recognition? We have touched on the answers in earlier discussion but elaborate a bit more here. This question has two components: (a) Why are recall processes not used to carry out the simpler sorts of episodic recognition? (b) Why are familiarity judgments not used to carry out associative recognition? We take these up in turn. In the case of single-word and pair recognition paradigms, the use of a global familiarity process may be driven by convenience and ease: Recent list items may be stored with sufficiently distinct context that such a mechanism is able to discriminate such items from new items with relative ease. Carrying out an extended search might involve considerable additional effort without a proportional gain in performance. This argument does not, however, preclude the possibility that a familiarity process is augmented by certain types of recall-like processes, as long as those processes operate quickly and easily. Dual-route (or multiple-route) models of recognition have, of course, been suggested by many investigators (e.g., Brainerd et al., 1999; Dosher, 1984b; Hintzman & Curran, 1994; Horton et al., in
press; Jacoby, 1991; Juola et al., 1971; Mandler et al., 1969; Yonelinas, 1999). The present results argue that a recall-like route cannot be much extended in time, but it is, of course, possible to adopt an intermediate position. Recall carried out by search and sampling sometimes succeeds very quickly (when the first or perhaps the second sample selects the correct image; see, e.g., Hintzman & Curran, 1994) and only occasionally requires the large number of samples that produce very slow responses. Suppose then that the familiarity response is collected in parallel with a sample-recovery from memory, with the first to succeed governing a response. This model would indeed combine familiarity with a recall-like mechanism and would still produce very fast RTs (even faster than the familiarity mechanism alone). Our own data are almost certainly not sufficient to test between such a version of the "familiarity plus recall" model and the "familiarity only" model, especially because the two routes might lead to correlated response decisions. We have not tried to fit a combined model for this reason, and also because the complexity of the present models is already quite high. We have no theoretical or conceptual objections to such a combined model, however. Let us return to the converse of this issue: If recall processes do sometimes contribute meaningfully to recognition, even in truncated form, why would participants in a recognition task not continue search and sampling for an extended period of time, thereby improving performance? Even if such search is effortful and aversive, participants are apparently willing to put out such effort in recall tasks. Probably the net gain is too low to merit such activity, given that familiarity may provide a good basis for response, and given that those cases in which familiarity judgments are in error may be highly correlated with cases in which an extended search may fail (if, e.g., the target image is stored quite weakly). In cued recall, of course, the participant has no choice because familiarity of the test word does not provide a response; the relevant image must be sampled for recall to succeed, and it may take quite a few samples for this to happen. Thus, there seem to be plausible arguments for a single-step parallel activation and matching process for old-new recognition tasks (possibly augmented by a truncated recall-like process) and for an extended search for cued-recall tasks. What then are the processes used in associative recognition? It would theoretically be possible, according to the ARC-REM model, to probe memory with both test words and use familiarity of the result to make a decision. The problem is that this procedure does not appear to work well when the distractor pairs contain familiar list items. For example, Clark and Shiffrin (1987) looked at this situation for word triples, doubles, and singles. Operating within the context of the SAM model (e.g., Gillund & Shiffrin, 1984), they found that calculating familiarity for various multiword cues could not produce performance levels for various types of associative recognition as high as those observed. They therefore augmented the SAM model with an encoding specificity hypothesis to solve this problem. In retrospect it seems more likely that participants use a recall strategy in these situations (e.g., Clark, 1992; Clark & Shiffrin, 1992; Dosher, 1984b; Gronlund & Ratcliff, 1989; Hintzman & Curran, 1994). This issue was discussed in the context of the REM model by Shiffrin and Steyvers (1998). If familiarity judgments in associative recognition produce performance levels that are unacceptably low, then the participant might well be led to adopt a recall procedure, sampling images one
RETRIEVAL PROCESSES
at a time and making decisions on the basis of the information recovered from those images. Because this procedure is based on sequential image sampling, its time course ought to be roughly akin to that seen in cued recall, which we argue is also based on sequential sampling. This pattern was observed in Experiment 2. Of course, various mixed models are conceivable, and we discussed one variant in which guessing strategies might be based on familiarity. The fact that associative recognition exhibits a slow rate of retrieval is important because it provides evidence concerning the type of retrieval occurring in cued recall. One argument that could be made concerning retrieval in cued recall goes as follows: (a) An initial phase of parallel retrieval occurs, with a time course like that seen in recognition (perhaps because the same mechanism underlies this phase in both tasks), (b) The result of Phase 1 retrieval is a "noisy" set of information that is often insufficiently precise to allow generation of an overt response, (c) A second phase of retrieval then ensues, in which the noisy information is cleaned up to the point where an overt output can be made. This second phase could consist of probing the lexical-semantic memory with the noisy trace from Phase 1 and finding an acceptable match or possibly could consist of using the noisy trace from Phase 1 as a probe of the episodic memory a second time (and this recycling could continue for some number of additional steps). The second phase of retrieval is needed, according to this argument, because there is no potentially correct word available with which the noisy trace from Phase 1 can be compared (as happens in recognition tasks). Associative recognition (and wickelcall) is therefore critical because the participant is provided with the potentially correct words with which the retrieved trace from Phase 1 might be compared directly. This direct comparison should circumvent the need for a second phase of retrieval and should produce a fast time course of retrieval, as in single-item and paired recognition. The data showed quite slow retrieval in associative recognition, however, and we have concluded that this line of argument is incorrect and that search and sampling is a better model for associative recognition. This argument on the basis of the associative recognition results is not entirely airtight, and some alternative hypotheses need to be considered. Perhaps a second phase of retrieval is needed in associative recognition despite the presence of the response alternatives. For example, suppose the participant uses a mnemonic or imaging technique to remember each pair (e.g., to encode tablehorse, the participant imagines a rider sitting on a horse using a table rather than a saddle). Perhaps recognition of a test pair requires recall of the mnemonic or image. The mnemonic or image is not provided at test, of course, and might have to be recovered in a second phase of retrieval. We think it is perfectly reasonable that participants use mnemonic, imaging, and other coding techniques to remember pairs of words, and indeed such techniques would improve recall in a search model (see, e.g., Raaijmakers & Shiffrin, 1980, 1981). However, the existence of such codes, and their usefulness in cued recall, does not convince us that a second phase of retrieval to generate them would be needed in the hypothesized model for associative recognition. After all, the retrieved trace from Phase 1 presumably has noisy information concerning the two words in the image as well as the code used to connect them. If the two noisy
409
words match the test pair, then this ought to be enough to respond "old," and it is not clear how coming up with a cleaned-up trace later in time would improve performance. In addition, there is the logical problem that the image or mnemonic to be recalled might not even be available in the participant's lexicon (as in the example with a table on a horse). In contrast, if Phase 2 of retrieval (in the hypothetical augmented model) takes place through the episodic images in memory (or the one episodic image in the case of composite storage models), then the whole problem has just been regressed one step, and one is still left with the necessity of sequential search or some similar slow process in Phase 2 of retrieval. For reasons like these, we think the search model for cued recall and associative recognition is simpler, easier to defend, and generally to be preferred. We do note that if future research reveals reliable differences between retrieval dynamics for cued recall and associative recognition, these might be due to the use of mnemonic information in cued recall. As a final comment, the arguments that have been made for a different and more extended retrieval mechanism in cued recall and associative recognition (and wickelcall), than in single-word and pair recognition, do not depend critically on the details of the models that have been fitted to the data in the companion article by Diller et al. (2001). Improved models may surface in the future, but on the basis of the data patterns reported here, we think it is likely that such models will need to incorporate different retrieval mechanisms for old-new single-item and paired-item recognition on the one hand and for cued recall, associative recognition, and wickelcall on the other hand. The most likely models, based on the data in these three articles, would in our view attribute retrieval in pair and single-word recognition to parallel global activation and matching and would attribute retrieval in cued recall and associative recognition (and wickelcall) to sampling of, recovery from, and decisions about individual memory images sampled successively. References Ashby, F. G., Tein, J. Y., & Balakrishnan, J. D. (1993). Response time distributions in memory scanning. Journal of Mathematical Psychology, 37, 526-555. Atkinson, R. C , & Shiffrin, R. M. (1968). Human memory: A proposed system and its control processes. In K. W. Spence & J. T. Spence (Eds.), The psychology of learning and motivation: Advances in research and theory (Vol. 2, pp. 89-195). New York: Academic Press. Brainerd, C. J., Reyna, V. F., & Mojardin, A. H. (1999). Conjoint recognition. Psychological Review, 106, 160-179. Chappell, M., & Humphreys, M. S. (1994). An auto-associative neural network for sparse representations: Analysis and application to models of recognition and cued recall. Psychological Review, 101, 103—128. Clark, S. E. (1992). Word frequency effects in associative and item recognition. Memory & Cognition, 20, 231-243. Clark, S. E., & Shiffrin, R. M. (1987). Recognition of multiple-item probes. Memory & Cognition, 15, 367-378. Clark, S. E., & Shiffrin, R. M. (1992). Cuing effects and associative information in recognition memory. Memory & Cognition, 20, 580-598. Dark, V. J., & Loftus, G. R. (1976). The role of rehearsal in long-term memory performance. Journal of Verbal Learning and Verbal Behavior, 15, 479-490. Deese, J. (1960). Frequency of usage and number of words in free recall: The role of association. Psychological Reports, 7, 337-344. Diller, D. E., Nobel, P. A., & Shiffrin, R. M. (2001). An ARC-REM model
410
NOBEL AND SHIFFRIN
for accuracy and response time in recognition and recall. Journal of Experimental Psychology: Learning, Memory, and Cognition, 27, 414-435. Dosher, B. A. (1981). The effect of delay and interference: A speed accuracy study. Cognitive Psychology, 13, 551-582. Dosher, B. A. (1982). Effect of sentence size and network distance on retrieval speed. Journal of Experimental Psychology: Learning, Memory, and Cognition, 8, 173-207. Dosher, B. A. (1984a). Degree of learning and retrieval speed: Study time and multiple exposures. Journal of Experimental Psychology: Learning, Memory, and Cognition, 10, 541-574. Dosher, B. A. (1984b). Discriminating preexperimental (semantic) from learned (episodic) associations: A speed-accuracy study. Cognitive Psychology, 16, 519-555. Dosher, B. A., McElree, B., Hood, R. M., & Rosedale, G. (1989). Retrieval dynamics of priming in recognition memory: Bias and discrimination analysis. Journal of Experimental Psychology: Learning, Memory, and Cognition, 15, 868-886. Dosher, B. A., & Rosedale, G. (1989). Integrated retrieval cues as a mechanism for priming in retrieval from memory. Journal of Experimental Psychology: General, 118, 191-211. Dosher, B. A., & Rosedale, G. (1997). Configural processing in memory retrieval: Multiple cues and ensemble representations. Cognitive Psychology, 33, 209-265. Fletcher, R., & Powell, M. J. D. (1963). A rapidly convergent descent method for minimization. Computer Journal, 6, 163-168. Flexser, A. J., & Tulving, E. (1978). Retrieval independence in recognition and recall. Psychological Review, 85, 153-171. Francis, W. N., & Kucera, H. (1982). Frequency analysis of English usage: Lexicon and grammar. Boston: Houghton Mifflin. Gillund, G., & Shiffrin, R. M. (1984). A retrieval model for both recognition and recall. Psychological Review, 91, 1-67. Glenberg, A., & Adams, F. (1978). Type I rehearsal and recognition. Journal of Verbal Learning and Verbal Behavior, 17, 455—463. Green, D., & Swets, J. (1966). Signal detection theory and psychophysics. New York: Wiley. Gronlund, S. D., & Ratcliff, R. (1989). Time course of item and associative information: Implications for global memory models. Journal of Experimental Psychology: Learning, Memory, and Cognition, 15, 846-858. Hall, J. F. (1979). Recognition as a function of word frequency. American Journal of Psychology, 92, 497-505. Hintzman, D. L. (1988). Judgments of frequency and recognition memory in a multiple-trace memory model. Psychological Review, 95, 528-551. Hintzman, D. L., & Cumin, T. (1994). Retrieval dynamics of recognition and frequency judgments: Evidence for separate processes of familiarity and recall. Journal of Memory and Language, 33, 1—18. Hintzman, D. L., & Curran, T. (1997). Comparing retrieval dynamics in recognition memory and lexical decision. Journal of Experimental Psychology: General, 126, 228-247. Hockley, W. E., & Murdock, B. B., Jr. (1987). A decision model for accuracy and response latency in recognition memory. Psychological Review, 94, 341-358. Horton, D. L., Pavlick, T. J., & Moulin-Julian, M. W. (in press). Retrievalbased and familiarity-based recognition and the quality of information in episodic memory. Journal of Memory and Language. Howard, M. W., & Kahana, M. (1999). Contextual variability and serial position effects in free recall. Journal of Experimental Psychology: Learning, Memory, and Cognition, 25, 923—941. Indow, T. (1995). Retrieval sequences and retention curves: An analysis based on extreme statistics (Tech. Rep. No. MBS 95-31). Irvine: University of California, Irvine, Institute for Mathematical Behavioral Sciences. Iverson, G. J., & Sheu, C.-F. (1992). Characterizing random variables in the context of signal detection theory. Mathematical Social Sciences, 23, 151-174. Jacoby, L. L. (1991). A process dissociation framework: Separating auto-
matic from intentional uses of memory. Journal of Memory and Language, 30, 513-541. Juola, J. F., Fischler, I., Wood, C. T., & Atkinson, R. C. (1971). Recognition time for information stored in long-term memory. Perception & Psychophysics, 10, 8-14. Luce, R. D. (1986). Response times: Their role in inferring elementary mental organization. New York: Oxford University Press. MacLeod, C. M., & Nelson, T. O. (1984). Response latency and response accuracy as measures of memory. Ada Psyckologica, 57, 215-235. Mandler, G., Pearlstone, Z., & Koopmans, H. J. (1969). Effects of organization and semantic similarity on recall and recognition. Journal of Verbal Learning and Verbal Behavior, 8, 410-423. Metcalfe, J. (1991). Recognition failure and the composite memory trace in CHARM. Psychological Review, 98, 529-553. Metcalfe, J., & Murdock, B. B. (1981). An encoding and retrieval model of single-trial free recall. Journal of Verbal Learning and Verbal Behavior, 20, 161-189. Metcalfe Eich, J. (1982). A composite holographic associative recall model. Psychological Review, 89, 627-661. Metcalfe Eich, J. (1985). Levels of processing, encoding specificity, elaboration, and CHARM. Psychological Review, 92, 1-38. Miller, D. R., & Singpurwalla, N. D. (1977). Failure rate estimation using random smoothing (NTIS No. AD-A040999/5ST). Millward, R. (1964). Latency in a modified paired associate learning experiment. Journal of Verbal Learning and Verbal Behavior, 3, 309-316. Montgomery, D. C , & Peck, E. A. (1982). Introduction to linear regression analysis. New York: Wiley. Murdock, B. B., Jr. (1982). A theory for the storage and retrieval of item and associative information. Psychological Review, 89, 609-626. Murdock, B. B., Jr., & Anderson, R. E. (1975). Encoding, storage and retrieval of item information. In R. L. Solso (Ed.), Information processing and cognition: The Loyola symposium (pp. 145-194). Hillsdale, NJ: Erlbaum. Murdock, B. B., Jr., & Okada, R. (1970). Interresponse times in single-trial free recall. Journal of Experimental Psychology, 86, 263-267. Nelder, J. A., & Mead, R. (1965). A SIMPLEX method for function minimization. Computer Journal, 7, 308—313. Nelson, T. O. (1984). A comparison of current measures of the accuracy of feeling-of-knowing predictions. Psychological Bulletin, 95, 109—133. Neter, J., Wasserman, W., & Kutner, M. H. (1985). Applied linear statistical models: Regression, analysis of variance, and experimental designs. Homewood, IL: Irwin. Nobel, P. A., & Shiffrin, R. M. (1992). Constraints on models of recognition and recall imposed by data on the time course of retrieval. In L. Erlbaum (Ed.), Proceedings of the Fourteenth Annual Conference of the Cognitive Science Society (pp. 1014-1019). Hillsdale, NJ: Erlbaum. Pechmann, T., Reetz, H., & Zerbst, D. (1989). [Criticism of a measurement technique: The inaccuracy of voice-key measurements]. Sprache und Kognition, 8, 65-71. Pike, R. (1984). Comparison of convolution and matrix distributed memory systems for associative recall and recognition. Psychological Review, 91, 281-294. Press, W. H., Teukolsky, S. A., Vetterling, W. T., & Flannery, B. P. (1992). Numerical recipes in C: The art of scientific computing (2nd ed.). Cambridge, MA: Cambridge University Press. Raaijmakers, J. G. W., & Shiffrin, R. M. (1980). SAM: A theory of probabilistic search of associative memory. In G. H. Bower (Ed.), The psychology of learning and motivation: Advances in research and theory (Vol. 14, pp. 207-262). New York: Academic Press. Raaijmakers, J. G. W., & Shiffrin, R. M. (1981). Search of associative memory. Psychological Review, 88, 93-134. Ratcliff, R. (1978). A theory of memory retrieval. Psychological Review. 85, 59-108. Ratcliff, R. (1979). Group reaction time distributions and an analysis of distribution statistics. Psychological Bulletin, 86, 446-461.
RETRIEVAL PROCESSES Ratcliff, R. (1993). Methods for dealing with reaction time outliers. Psychological Bulletin, 114, 510-532. Ratcliff, R., Clark, S., & Shiffrin, R. M. (1990). The list-strength effect: I. Data and discussion. Journal of Experimental Psychology: Learning, Memory, and Cognition, 16, 163-178. Ratcliff, R., & Murdock, B. B., Jr. (1976). Retrieval processes in recognition memory. Psychological Review, 83, 190-214. Reed, A. V. (1976). List length and the time-course of recognition in immediate memory. Memory & Cognition, 4, 16-30. Roberts, W. A. (1972). Free recall of word lists varying in length and rate of presentation: A test of total-time hypotheses. Journal of Experimental Psychology, 92, 365-372. Rohrer, D., & Wixted, J. T. (1994). An analysis of latency and interresponse time in free recall. Memory & Cognition, 22, 511-524. Shepard, R. N. (1967). Recognition memory for words, sentences, and pictures. Journal of Verbal Learning and Verbal Behavior, 6, 156-163. Shiffrin, R. M. (1970). Memory search. In D. A. Norman (Ed.), Models of human memory (pp. 375-447). New York: Academic Press. Shiffrin, R. M. (1993). Short-term memory: A brief commentary. Memory & Cognition, 21, 193-197. Shiffrin, R. M., Murnane, K., Gronlund, S., & Roth, M. (1989). On units of storage and retrieval. In C. Izawa (Ed.), Current issues in cognitive processes: The Tulane Floweree Symposium on Cognition (pp. 25-68). Hillsdale, NJ: Erlbaum. Shiffrin, R. M., Ratcliff, R., & Clark, S. (1990). The list-strength effect: II. Theoretical mechanisms. Journal of Experimental Psychology: Learning, Memory, and Cognition, 16, 179-195. Shiffrin, R. M., & Steyvers, M. (1997). A model for recognition memory:
411
REM—retrieving effectively from memory. Psychonomic Bulletin and Review, 4, 145-166. Shiffrin, R. M., & Steyvers, M. (1998). The effectiveness of retrieval from memory. In M. Oaksford & N. Chater (Eds.), Rational models of cognition (pp. 73-95). Oxford, England: Oxford University Press. Snodgrass, J. G., & Corwin, J. (1988). Pragmatics of measuring recognition memory: Applications to dementia and amnesia. Journal of Experimental Psychology: General, 117, 34-50. Townsend, J. T., & Ashby, F. G. (1983). The stochastic modeling of elementary psychological processes. Cambridge, England: Cambridge University Press. Ulrich, R., & Miller, J. (1994). Effects of truncation on reaction time analysis. Journal of Experimental Psychology: General, 123, 34-80. Van Zandt, T., & Ratcliff, R. (1995). Statistical mimicking of reaction time data: Single process models, parameter variability, and mixtures. Psychonomic Bulletin and Review, 2, 20-54. Wickelgren, W. A., & Corbett, A. T. (1977). Associative interference and retrieval dynamics in yes-no recall and recognition. Journal of Experimental Psychology: Human Learning and Memory, 3, 189-202. Wiseman, S., & Tulving, E. (1975). A test of confusion theory of encoding specificity. Journal of Verbal Learning and Verbal Behavior, 14, 370381. Yonelinas, A. P. (1999). The contribution of recollection and familiarity to recognition and source-memory judgments: A formal dual-process model and an analysis of receiver operating characteristics. Journal of Experimental Psychology: Learning, Memory, and Cognition, 25, 14151434.
Appendix A Response Time Data Adjustment Method The aim of this article and the companion article by Diller et al. (2001) was to examine and model not only the measures of central tendency for the RTs but also the entire RT distributions. However, averaging across variables of little interest for modeling efforts can affect various characteristics of the RT distributions when those variables have an effect. One approach to this problem would involve including in the models components and parameters reflecting each of these variables. However, we regard these as "nuisance" variables and do not wish to clutter the models with extra complexities and parameters in an attempt to model them. One approach to solving this problem involves "vincentizing" the RT distributions, as suggested by Ratcliff (1978,1979). This method works well when there is one nuisance variable to be taken into account. In our case, the main differences were those introduced by different participants, so the vincentizing approach could have been used. However, this method does not generalize to multiple variables, so it is of some interest to present a method that might do so. Thus, we adopted another approach in which a regression-like analysis is used to remove the effects of nuisance variables. The adjusted data are presented in the main body of this and the companion article and are modeled in the companion article. None of the patterns of data exhibited and discussed in the body of the article and none of the statistical effects, are changed if the raw data are analyzed instead.
within session (termed list position, not to be confused with serial position within list), and output position. The second pass involved adjustments for the standard deviations of each of these nuisance variables. The adjustments were made separately for each type of response, that is, for hits, false alarms, correct rejections, and misses. We included sessions, list positions, and output positions in these adjustments, even though these did not differ significantly, in case there might have been differences that lack of power prevented from reaching significance. The adjustment model used for the means assumed that Y(i, j , k, I) = X(i, j , k, l) + [G-
m(i)] + [G - m(j)] + [G - m(k)] + [G - m(l)],
(Al)
where X(i, j , k, I) is a given single RT having participant i, session j , list position k, and output position /; Y(i, j , k, I) is the RT for that same observation adjusted for the means of the nuisance variables; G is the overall mean RT for the entire study; m(i') is the overall mean for participant i; m(j) is the overall mean for session/, m(k) is the overall mean for list position k; and m(l) is the overall mean for output position /. In the first pass, all RTs were adjusted according to Equation Al. The adjustment model for the variability assumed that
RT Adjustment Method The raw data were adjusted in two passes. The first pass involved adjustments for the means of sessions, participants, serial position of list
(Appendixes continue)
j , k, I) X [S(k)/s(k)][S(l)/s(t)l
(A2)
NOBEL AND StflFFRIN
412
where Z(i,;', k, I) is the final adjusted RT for this observation; s(t) is the overall standard deviation for participant i, and S(i) is the mean of the s(i); s(f) is the overall standard deviation for session j , and S(f) is the mean of the s(j); s(k) is the overall standard deviation for list position k, and S(k) is the mean of the s(k); and s(l) is the overall standard deviation for output position /, and S(l) is the mean of the £(/). In the second pass, all observations were adjusted according to Equation A2. Figure Al shows an example of the result of these corrections for free-response recognition data from Experiment 1. RTs were cumulated in 50 bins of size 100 ms. The unadjusted distribution in Figure Al shows RT for hits in the 40-pairs/2,000-ms condition; this distribution is bimodal, with an early bump, due mainly to 1 particularly fast participant. The adjusted distribution is given by the dashed line; the participant and other differences have been removed, and the distribution is unimodal and smoother. Figure A2 shows an example of the result of these corrections for the cued-recall times. The unadjusted distribution in Figure A2 shows RT for
Raw p =.78 M- =785 a =393 m = 712
0.3 - -
I 0.2 - -
•-•• Adjusted p =.72 u =796 o =292 m = 730
0.1 --
0.0 1000
2000
•
3000
4000
5000
Reaction Time (ms) Figure Al. Example of response time distributions for recognition free response (hits in the 40-pairs/2,000-ms condition) before and after adjusting for "nuisance" variables, p = proportion of responses of that type; /u. = mean response time;