ISSN 2278-6783
Chemical Science Review and Letters Research Article
A Spectrophotometric Method for the Assay of Peroxidase Using Paraphenylenediamine dihydrochloride and Iminodibenzyl as Chromogenic Reagents: Applications in Some Plant Sources Padmarajaiah Nagaraja*1 , Nelligere Arkeswaraiah Chamaraja1 , Anantharaman Shivakumar2 and Honnur Krishna1 1
Department of Studies in Chemistry, University of Mysore, Manasagangotri, Mysore- 570006, Karnataka, India 2 St. Philomena’s college, PG Department of Chemistry, Mysore- 570006, Karnataka, India
Abstract A kinetic model for measurement of rate reaction for peroxidaseactivity using para-enylenediaminedihydrochloride (PPDD) and iminodibenzyl (IDB) is presented. Under KH2 PO4 /K2 HPO4 buffer (pH 7.0), PPDD entraps the free radical and gets oxidized to electrophilic diimine, which couples with IDB to give an intense green colored product with λmax750nm at 25ᵒC. The peroxidase assay is achieved from 0.379 to 6.064nM and the linearity for H 2 O2 was 3.5 to 164 µM. Catalytic efficiency and catalytic power of commercial peroxidase are 3.720×10⁴ µM-1 min-1 and 2.251×10⁻³ min-1 , respectively. Catalytic constant (kcat ) and specificity constant (kcat /Km) at saturated concentration of cosubstrates were 0.032 min-1 and 3.717×10⁻⁴ µM-1 min-1 respectively. Michaelis–Menten constants for H2 O2, PPDD K PPDD K H 2O2 K IDB and IDB were m = 85 µM, m = 69 µM and m = 92 µM respectively. The method was successfully tested peroxidase activity in some plant extracts.
Keywords: Horseradish peroxidase, Hydrogen donor, PPDD, IDB, peroxidase assay
*Correspondence P. Nagaraja, Email:
[email protected]
Introduction Horseradish peroxidase (EC 1.11.1.7; donor-H2 O2 oxidoreductase) is one of the heme peroxidases and it is defined as oxidoreductase, which acts on peroxide as electron donor. HRP has been extensively studied and frequently used to exemplify the peroxidase reaction cycle. HRP catalyses the reduction of peroxides with oxidation of the heme group in the active site of the enzyme and the reaction mechanism can be represented as follows [1–4]. HRP (Fe3+) + H2 O2 → Compound І + H2 O Compound I + AH2 → Compound II + AH* Compound II + AH2 → HRP (Fe3+) + AH* + H2 O
(1a) (1b) (1c)
Peroxidase catalyzes a variety of oxidative transformations of organic and inorganic co-substrates by using hydrogen peroxide as a substrate [5, 6]. The reduction of peroxides at the expense of electron donating substrates make peroxidase useful in a number of industrial, analytical and biotechnological applications [7]. Peroxidase is a ubiquitous enzyme in plants, microorganisms and animals, where it plays important roles. In plants, it participates in the lignification process and the mechanism of defense in physically damaged or infected tissues [8]. In food industry, peroxidase has been widely used as an indicator of the capability of vegetable blanching due to its high thermal
Chem Sci Rev Lett 2014, 3(12), 1068-1079
Article CS27204510
1068
Chemical Science Review and Letters
ISSN 2278-6783
stability and wide distribution [9]. It is used in various analytical applications in diagnostic kits, such as quantification of important biomarkers such as glucose, uric acid, cholesterol, glutamate and choline [5]. Of later peroxidase based biosensors have found application in analytical systems for the quantification of hydrogen peroxide and organic hydro peroxides, while co-immobilized along with H2 O2 - producing enzymes they can also be used in the quantification of above stated biomarkers. Due to its ability to convert colorless substrates into chromogenic products, peroxidase is well suited in the preparation of enzyme-conjugated antibodies, which are used in enzyme-linked immunosorbent assay (ELISA) tests [10, 11]. Peroxidase can be used in the detoxification of various phenols and aromatic amines present in polluted water [12-14]. More recently reports have appeared on the decolorization and removal of fabric dyes from polluted water and dyeing effluents by using soluble and immobilized peroxides [15, 16]. Several methods are available for the quantification of peroxidase activity, which include the spectrofluorimetry and luminescence [17]. However, they have their own limitations, as the instruments used in fluorometry and luminescence is too expensive and less flexible. Another disadvantage of the luminescence is its poor selectivity [18]. The electro-analytical system involves several steps to immobilize the enzyme on a solid support, which may reduce the enzyme activity. During the assimilation of the enzyme within the solid support, a large amount of enzyme is not utilized, which results in the wastage of an expensive biocatalyst. Spectrophotometers are cost-effective, easy to handle, and the reagents used are generally economical. The unfussiness, rapidity, facile and inexpensive properties of spectrophotometry has made it an exemplary method to determine the activity of HRP [19]. In spectrophotometric method a wide range of hydrogen donors (e.g., caffeic acid and 2, 2-azino-bis (3-ethylbenzothiazolin- 6-sulfonate)) have been utilized in peroxidase assay systems including methods which use potentially carcinogenic and mutagenic materials [20, 21]. With the objective of utilizing the non-toxic chemicals in order to reduce the amount of formation of hazardous products, new chromogenic reagents which are less toxic when compared to other co-substrates for the assay of HRP has been proposed. In the proposed method a detailed study on the horseradish peroxidase and hydrogen peroxide an enzymesubstrate compound is presented. A new kinetic mathematical model has been developed to evaluate the Michaelis – Menten constants. In the method PPDD-IDB couple serves as hydrogen donor for horseradish peroxidase assay and it is an elegant, highly sensitive spectrophotometric method for the determination of HRP activity and micro molar quantity of hydrogen peroxide. The coupled green coloured product is stable and has maximum absorbance at 750 nm. The absorption at longer wavelengths allows it to avoid the background interference caused by the crude extracts. The linearity range for the assay of peroxidase makes the method more considerate than the guaiac ol method. The method has been tried in the quantification of peroxidase activity in crude extracts of some medicinal plants.
Experimental Chemicals and reagents All chemicals used in the assay were of Analytical grade. PPDD and IDB were purchased from Sigma-Aldrich and Merck, Germany, respectively. Peroxidase (EC 1.11.1.7, 100 units/mg) was purchased from Himedia Laboratories, Mumbai, India. H2 O2 (30%) was purchased from E-Merck, Mumbai, India. Guaiacol was obtained from Loba Chemie, India. Double-distilled water was used throughout the experiment. PPDD (16.56 mM) solutions were prepared by dissolving requisite quantity in distilled water. IDB (51.2 mM) was initially dissolved in 5 µL of acetic acid and made up to 5 mL with distilled water. H 2 O2 stock solution (100 mM) was prepared daily and standardized by potassium permanganate method. Working standard solutions were prepared from the stock solution by dilution. Peroxidase stock solution was prepared by dissolving 2 mg in 10 mL of 100 mM potassium KH 2 PO4 / NaOH buffer at pH 6.0. Further dilution with the same buffer was made when required. Equipment All absorbance measurements were carried out with a JASCO model UVIDEC-610 ultraviolet–visible (UV–Vis) spectrophotometer with matched cuvettes of 1cm thickness. Water bath shaker (NSW 133, New Delhi, India) used to maintain constant temperature. EQ-614 pH meters (model, Equip-tronics, Mumbai, India) are used to adjust pH.
Chem Sci Rev Lett 2014, 3(12), 1068-1079
Article CS27204510
1069
Chemical Science Review and Letters
ISSN 2278-6783
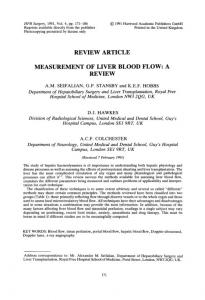
Plant crude extract preparation As a source of peroxidase, crude extracts were prepared using leaf or stem portion of Mimosapudica, Costus igneus, Yucca gloriosa or a Palm lilly, Ixora chinensis, Moringa oleifera, Aegle marmelos, Limonia acidissima and Syzygium cumini which were collected from the local gardens and transported at 4 °C to the laboratory and stored at -20 °C until used. The extracts were prepared by carefully observing enzyme activity in different buffer solutions. In the buffer solution of potassium dihydrogen phosphate/sodium hydroxide at pH 6.0 the crude extract showed more activity. Hence all plant extracts were prepared using the same buffer solutions. Samples (5 g) were washed with distilled water and homogenized in a blender using 50 mL of 100 mM buffer at pH 6.0. The extract was passed through cheese cloth and centrifuged at 12000 g for 15 min, and the supernatant was labeled as crude extract. Stock enzyme solutions were stored at 4°C and warmed to room temperature immediately prior to use. Recommended procedure for the assay of peroxidase activity The reaction mixture used contained 23 μM PPDD, 17.06 μM IDB, and 164 μM H 2 O2 in 100 mM dihydrogen orthophosphate/dipotassium hydrogen orthophosphate buffer of pH 7.0. Reaction was initiated by adding 100 μL of varying concentrations of peroxidase. Change in absorbance was continuously recorded against the corresponding control containing all reagents except peroxidase at 25 °C. The initial velocity was recorded by the absorbance-time curve. The linear relationship between the initial velocity and the concentration of enzyme from rate method was 0.379 to 6.064 nM. In the fixed time method, the reaction mixture was incubated for 5 min at 25 °C and the peroxidase was assayed in the concentration range of 0.076 to 1.516 nM. The linear relationships by the rate and fixed time methods are shown in Figure. 1.
Figure 1 Calibration graph for the quantification of horseradish peroxidase by rate method (■) and fixed time method (♦) Recommended procedure for quantification of H 2 O2 The concentration of H2 O2 was determined in 3 mL of the solution, which contained 23 μM PPDD, 17.06 μM IDB, and 6.064 nM peroxidase in 100 mM dihydrogen orthophosphate/dipotassium hydrogen orthophosphate acid buffer at pH 7.0. Reaction was initiated at 30 °C by adding 100 μL of different concentrations of H2 O2 within the linear range. The change in the absorbance was continuously recorded at 750 nm. The initial rate was plotted against the concentration of H2 O2 to get the calibration graph. The linearity of the graph lies between 3.5 and 164 μM H 2 O2 . The
Chem Sci Rev Lett 2014, 3(12), 1068-1079
Article CS27204510
1070
ISSN 2278-6783
Chemical Science Review and Letters
H 2 O2
calibration graph for the quantification of H 2 O2 is presented in Figure. 2. The value of K m (85 μM) was determined from kinetic model and V max (0.1916 min-1 ) for the H2 O2 from the plot of rate verses concentration of the substrate.
Figure 2 Calibration graph for the quantification of H 2 O2 by rate method Protein assay The total protein concentration was determined in triplicate by the Lowry [22] method, using bovine serum albumin as standard.
Results and discussion Effect of PPDD and IDB The effect of varying concentrations of PPDD and IDB showed that the rate increased on increasing the concentration of PPDD from 6 to 23 µM beyond which there was no considerable increase in the rate. Hence for all assays PPDD concentration of 23 µM was selected. Similarly, the effect of IDB concentration on the reaction rate was studied from 2.1 to 170.1 µM. The linearity prevailed up to 17.06 µM, above this concentration there was no effect on the rate. Hence 17.06 µM of IDB was selected as the optimized concentration for further analysis. Effect of temperature The stability and activity of the enzyme are influenced by the temperature. This can be clearly observed while studying enzyme thermal inactivation. Enzyme activity increases with temperature but enzyme stability decreases. These opposite trends make temperature a critical variable in any enzymatic process and demand the need for optimization. Temperature sensitivity and optimization were determined by pre-incubating the optimized concentration of reaction mixture for 5 min at varying temperatures (0 - 80 °C). The activity of the enzyme was registered as a function. of the absorbance of the colored solution. The maximum activity was observed at 30 °C. Effect of pH and concentration pH is known to alter the activity of enzymes as it affects ionization state of side chains of enzymatic proteins. The buffers of different concentrations studied for the assay include, citric acid/potassium citrate at pH 3.6-5.6,
Chem Sci Rev Lett 2014, 3(12), 1068-1079
Article CS27204510
1071
ISSN 2278-6783
Chemical Science Review and Letters
acetate/acetic acid at pH 3.6-5.6, potassium dihydrogen phosphate/sodium hydroxide at pH 6.0-8.0, and potassium dihydrogen orthophosphate/dipotassium hydrogen orthophosphate at pH 6.0-7.5. The activity of the enzyme was highest in 100 mM dihydrogen orthophosphate/dipotassium hydrogen orthophosphate buffer of pH 7.0. Hence, all studies were carried out at this pH. Effect of non targeting species The effect of various non-target species in the determination of HRP was investigated. Under the reaction conditions used for the coupling reaction, the suitability of the method for application in medicinal plant samples was studied by taking various cation, anions and other commonly accompanying amino acids in solutions containing 164 µM H 2 O2 . The result indicated that there was no interference by any of the ions tested. It can be seen that the method is highly selective and that some compounds except ascorbic acid, Cu2+, Fe3+, L- Tryptophan, L- Tyrosine, L- Cystine, Lcysteine, Fe 2+, Zn2+, L- serine, Citric acid and Uric Acid none of the other foreign species studied interfered in the quantification. The tolerance ratios are tabulated in Table 1. Table 1 Effect of diverse foreign ions on the spectrophotometric determination of peroxidase activity Foreign Species Ascorbic acid Cu2+ Fe3+, L- Tryptophan L- Tyrosine, L- Cystine, L- Cysteine Fe2+ Zn2+, L- serine, Citric acid, Uric Acid Oxalic acid, DL- Methionine FD- Asparagine, NO2 L- Histidine, Isoleucine DL- Threonine K, Cl NH4 + Urea Na+ SO2 -, Lactose Glycine Galactose Sucrose Glucose a
Tolerance ratio a 0.00065 0.15 0.35 0.95 1.21 1.82 6.21 8.60 10.11 15.23 48.23 50.23 65.25 85.78 70.45 100.55 210.14 200.50 500.21 1000.00
Tolerance ratio corresponds to ± 3 % error in the recovery
Reaction pathway for the enzyme activity response The enzymatic mechanism of peroxidase in the presence of H 2 O2 for PPDD and IDB is similar to that suggested by Ngo and Lenhoff [11] for HRP-catalyzed oxidative coupling of 3-methyl-2-benzothiazolinonehydrazone hydrochloride and aromatic amines with the formation of indamines dye. The mechanism for the peroxidase catalyzed reaction of PPDD and IDB is proposed in Scheme 1. The free radical is released by the oxidation of H 2 O2
Chem Sci Rev Lett 2014, 3(12), 1068-1079
Article CS27204510
1072
ISSN 2278-6783
Chemical Science Review and Letters
through a ferryl intermediate (Fe IV = O-porphyrin π-cation radical) of the peroxidase. 5 Under the reaction conditions examined, PPDD loses two electrons and two protons upon enzymatic oxidation in the presence of H 2 O2 , forming electrophillic 1, 4-diimine, which may be postulated as the oxidative coupling species.16 The 1, 4-diimine undergoes electrophillic substitution with IDB in the free para position to the N, N-dimethylamino group, forming an intense green-colored product showing strong absorption at 750 nm.
Scheme 1 Suggested reaction for the formation of green coloured product Mathematical representation of the determination of Michaelis constants, catalytic constants and substrate specificity The kinetic constants were studied and the peroxidase activity was measured under optimal buffer pH. The Michaelis constant (Km) and maximal velocity (Vmax) of the peroxidation of various hydrogen donors and H 2 O2 by the purified peroxidase were determined at various substrate concentration ranges. The saturation concentration for each substrate was first determined. The Km and Vmax of H2 O2 were calculated using the plot of reaction rate versus substrate concentration. Km values from the kinetic model and Michaelis Menten plot are found to be same. The catalytic constants of co-substrates were calculated by following the assay procedure and this can be carried out in three steps. Step 1: Concentration of H2 O2 was varied in the order, 3.4, 7.0, 14.0, 27.0, 55.0, 109.0 and 164.0 µM, with constant 0.017 mM IDB and 0.046 mM PPDD concentrations. Assuming that the initial rate of the reaction as V 0 and the initial concentration of H2 O2 , PPDD and IDB as H 0 , P 0 and I0 , respectively the general equation for the reaction is written as,
Chem Sci Rev Lett 2014, 3(12), 1068-1079
Article CS27204510
1073
Chemical Science Review and Letters
ISSN 2278-6783
H 0 P0 I 0 K H P0 I 0 P0 I 0 K I P0 K P M 0 H 0 V0 Vmax Vmax Vmax Vmax
(1)
By plotting the graph of H0 P 0 I0 /V0 verses the concentration of H 2 O2 we get, Y = 3.738x + 373.6
(2)
Step 2: Concentration of IDB was varied in the order: 2.1 µM, 4.3 µM, 8.5 µM, 17.0 µM and 34.0 µM with different H2 O2 concentrations by maintaining a constant 46.0 µM PPDD concentration. The general equation can be written as,
H 0 P0 I 0 K I H 0 P0 H 0 P0 K H P0 K P H 0 I0 V0 Vmax Vmax V max Vmax
(3)
The plot of H0 P 0 I0 /V0 verses the concentration of I0 gives, Y = 46.820x + 35.628
(4)
Step 3: Concentration of PPDD was varied in the order: 9.2 µM, 18.4 µM, 27.6 µM, and 36.8 µM with different H 2 O2 concentrations by keeping a constant 17.0 µM IDB concentration. The general equation can be written as,
H 0 P0 I 0 K P H 0 I 0 H 0 I 0 K H I 0 K I H 0 P0 V0 Vmax Vmax Vmax Vmax
(5)
The plot of H0 P 0 I0 /V0 verses the concentration of P 0 gives, Y = 13.783x + 58.936
(6)
The slope of equations 1, 3 and 5 is,
m1 m2 m3
P0 I 0 K I P0 K P I 0 Vm ax Vm ax Vm ax
(7)
H 0 P0 K H P0 K P H 0 . Vm ax Vm ax Vm ax
(8)
H0I0 K H I0 K I H0 Vm ax Vm ax Vm ax
(9)
The equations 7, 8 and 9 can be rearranged to give,
P I PI M 1 m1 0 0 K I 0 K P 0 . V max Vmax Vmax
(10)
P H H P M 2 m2 0 0 K H 0 K P 0 . Vmax Vmax Vmax
(11)
Chem Sci Rev Lett 2014, 3(12), 1068-1079
Article CS27204510
1074
ISSN 2278-6783
Chemical Science Review and Letters
I H H I M 3 m3 0 0 K H 0 K I 0 . Vmax V max Vmax
(12) From the above equations, let us consider the values for PPDD as A 1 , IDB as A2 and H2 O2 as B2 that is, P (13) A1 0 Vm ax
A2
I0 Vm ax
B1
H0 Vm ax
(14)
(15)
By calculating the values of A 1 , A2 and B1 , it can be expressed in the form of determinants as shown below,
M 1 A1 A2
0 A1 A 2
0M 1 A2
D A1 0 B1
D1 M 20 B1
D2 A1 M 2 B1
A 2 B1 0
M 3A2 0
A2 M 3 0
0 A1 M 1 D3 A1 0M 2 A2 B1 M 3
For H2 O2 the Michaelies – Menten constant can be determined by,
KH
KH
D1 D
B12 M 1 A1M 3 B1 A2 M 2 B1 2 A1 A2 B1
For IDB the KI value can be determined by,
KI
KI
D2 D
A2 M 1 B1 A2 A1M 3 A22 M 2 2 A1 A2 B1
For PPDD, KP value is determined by,
KP KP
D3 D
A12 M 3 A1 A2 M 2 M 1 A1 B1 2 A1 A2 B1
From the above equations the K H , KI and KP values for the substrate and co – substrates are 85 µM, 65.78 µM and 91.93 µM respectively.
Chem Sci Rev Lett 2014, 3(12), 1068-1079
Article CS27204510
1075
Chemical Science Review and Letters
ISSN 2278-6783
The plot of H0 P 0 I0 /V0 verses the concentration of H 2 O2; H0 P 0 I0 /V0 verses the concentration of I0 and H0 P 0 I0 /V0 verses the concentrations of P 0 are shown in the Figure. 3.
Figure 3 Kinetic behavior of two substrate reactions for the pure HRP (6.064 nM). (A) The plot of H 0 P0 I 0 H 0 P0 I 0 versus P0 versusI 0 V0 V0 And (B) Application to the crude medicinally valued plant tissues Extraction of peroxidase from crude plant extracts was carried out with the buffer to tissue ratio ranging from 3:1 to 12:1 ml g-1 . Highest specific activity however was observed at 9:1 ml g-1 ratio. Hence, the extraction was carried out at this ratio for a better performance of the system. Table 2 shows the peroxidase activity determined by the proposed and by guaiacol methods. The relative half-saturation point of the proposed method with reference to the guaiacol method is less than 1, indicating greater interaction between the active site, heme group of peroxidase, and PPDD –
Chem Sci Rev Lett 2014, 3(12), 1068-1079
Article CS27204510
1076
ISSN 2278-6783
Chemical Science Review and Letters
IDB co-substrates. The quantification results obtained by PPDD–IDB suggest that the sensitivity of the method is equal to that of guaiacol. The kinetic parameters like catalytic power, relative catalytic power and relative catalytic efficiency for the crude plant extracts are tabulated in Table 3. Table 2 Peroxidase activity of crude plant extracts as per the proposed and standard guaiacol methods Activity in Units a
Sample
a
Protein [mg]
K mPI K mG
Mimosapudica
PPDD - IDB 17.18 ± 1.1
Guaiacol 14.38 ± 1.3
280.02
0.9067
Costus igneus
59.01 ± 1.3
55.71 ± 1.5
119.25
0.0806
Yucca gloriosa
10.22 ± 1.0
33.5 ± 1.2
171.28
0.2806
Ixora chinensis
14.5 ± 1.7
15.2 ± 1.4
260.75
0.8383
Moringa oleifera
46.21 ± 1.9
41.54 ± 1.6
108.74
0.2402
Aegle marmelos
26.11 ± 2.01
24.31 ± 2.1
180.21
0.9371
Limonia acidissima
36.21 ± 1.85
30.21 ±1.8
200.21
0.1464
Syzygium cumini
19.85 ± 1.73
21.12 ± 1.93
190.21
0.7191
Mean (n = 3 replicate determinations) ± R.S.D. Table 3 Kinetic parameters for crude plant extracts from the PPDD – IDB and standard Guaiacol PPDD – IDB method Sample
K pow
Relative catalytic power
Guaiacol method x
K pow
x
Vm ax EU min-1
0.366 0.070 0.116 0.301 0.085 0.289
10 min-1 1.218 2.188 0.973 1.157 2.635 2.085
Km µM 331.3 401.9 427.0 310.2 192.1 286.2
0.022 0.028 0.034 0.021 0.065 0.112
10 min-1 6.851 7.040 7.984 6.864 8.654 5.562
58.0
0.158
3.124
396.2
0.056
6.965
169.5
0.563
2.266
235.7
0.356
8.102
Km µM
Vm ax EU min-1
Mimosapudica Costus igneus Yucca gloriosa Ixora chinensis Moringa oleifera Aegle marmelos Limonia acidissima
300.4 32.4 119.8 260.1 46.1 268.2
Syzygium cumini
-3
-5
PI K pow G K pow
17.8 31.08 12.19 16.86 30.45 37.49 44.85 27.97
Conclusions No work has been published so far on the coupling of PPDD with IDB for the quantification of peroxidase and hydrogen peroxide. These co-substrates are efficient, versatile, economical, having high catalytic power and the coupled product absorbs at a higher wavelength region. The kinetics of the system showed instantaneous color formation, the procedure requires only small quantities of colorimetric reagents. Optimization of the reaction conditions allowed the determination of H 2 O2 as low as 3.5 μM, which is more sensitive than our previous work [23, 24] and also unattainable by the guaiacol method. The linearity ranges for peroxidase assay by some of the reported
Chem Sci Rev Lett 2014, 3(12), 1068-1079
Article CS27204510
1077
ISSN 2278-6783
Chemical Science Review and Letters
analytical methods are 0.0227–1.136 nM for chemiluminescence [25], 5.4 ×10⁻⁴ nM to 0.1088 nM for electrochemical [26] method, these require more dilution of the crude extract which may lead to dilution effect. The HRP -catalyzed oxidative coupling of PPDD and IDB in the presence of peroxide allowed the determination of HRP a ssay achieved within the linearity range of 0.379 – 6.064 nM and 0.076 -1.516 nM from the kinetic and fixed time methods, respectively. This linear dependence between the concentration of peroxidase and the absorbance is also an important feature for the practical application of the assay procedure in minimizing the dilution effect. The broad range of linearity of the reference guaiacol method made the determination uncomfortable and caused bigger errors. Thus, the proposed method serves as an appropriate replacement to guaiacol method for the assay of peroxidase. The kinetic K IDB K H 2O2 K PPDD study shows that the Km values for m , m and m is 85, 92 and 69 µM respectively, which is lesser than K H 2O2 K H 2O2 guaiacol method and also our previous work DMA ( m - 301 µM) [27] and PPDD- NEDA ( m - 550 µM) 24 PI
method for the assay of peroxidase. The catalytic power (K pow = 2.251×10⁻³ min-1 ) was more than that of PPDDNEDA and DMA methods which have values of 3.38×10⁻⁴ min-1 and 4.59 × 10⁻⁴ min-1 respectively. Due to the low Michaelis–Menten constant value and higher catalytic power of the proposed method it is more efficient for the assay of peroxidase in crude plant extracts.
Acknowledgement One of the authors N. A. Chamaraja thanks the University of Mysore for providing facilities for the investigation.
References [1] [2] [3] [4] [5] [6] [7] [8] [9] [10]
[11] [12] [13] [14] [15] [16] [17] [18] [19] [20] [21] [22]
T. Ruzgas, J. Emnéus, L. Gorton, and G. Marko-Varga, Anal. Chim. Acta. 1995, 311, 245. T. Ruzgas, E. Csoregi, J. Emnéus, L. Gorton and G. Marko-Varga, Anal. Chim. Acta. 1996, 330, 123. S.S. Rosatto, L.T. Kubota and G. Oliveira Neto, Anal. Chim. Acta. 1999, 390, 65. P.J. O’Brien, Chem.–Biol. Interact. 2000, 129, 113. J.H. Marjon, V. Haandel, M.J.M. Claassens, N.V. Hout, G.M. Boersma, J. Vervoort, M.C.M.I. Rietjens, Biochim. Biophys. Acta., 1999, 1435, 22. A. Bodtke, W.D. Pfeiffer, N. Ahrensb and P. Langerc, Tetrahedron., 2005, 61, 1092. B. Tang, Y. Wang and L. Ma, Anal. Bioanal. Chem., 2004, 378, 523. M.A. Azevedo, C.V. Martins, M.F. DuartePrazeres, V. Vojinovic, M.S. Joaquim Cabral and P.L. Fonseca, Biotechnol. Annu. Rev., 2003, 9,199. C. Regalado1, B.E. Garc´ýa-Almend´arez and M.A. Duarte-V azquez, Phytochemistry Reviews, 2004, 3, 243. H.W. Krell, J. Lobarzewsky, H. Greppin, C. Penel, T. Gaspar (Eds.), 1991, Biochemical, Molecular and Physiological Aspects of Plant Peroxidases, University M. Curie/University of Geneva, Lublind Poland/Geneva, Switzerland, 469. A.J. Schutz, M. Winklmair, M.G. Weller and R. Neissner, SPIE., 1997, 3105, 332. J.A. Nicell, J.K. Bewtra, K.E. Taylor, N. Biswas and C. St. Pierre, Water Sci. Technol., 25 1992, 157. Q. Husain and U. Jan, J. Sci. Ind. Res. 2000, 59, 286. N. Duran and E. Esposito, Appl. Catal. B: Environ., 2000, 28, 83. T.S. Shaffiqu, J.J. Roy, R.A. Nair and T.E. Abraham, Appl. Biochem. Biotechnol., 2002, 102, 315. A. Bhunia, S. Durani and P.P. Wangikar, Biotechnol. Bioeng., 2001, 72, 562. M. Hamid, Khalil-ur-Rehman, Food Chem., 2009, 115, 1177. C. Rodrigo, M. Rodrigo, A. Alvarruiz and A. Frigola, J. Food Prot., 1997, 60, 961. A.C. Maehly, B. Chace, 1954, The Assay of Catalases and Peroxidases in Methods of Biochemical Analysis, Interscience Publishers, New York, 1357 Q. Huang and W.J. Weber, Environ. Sci. Technol., 2005, 39, 6029. S. Muthu and S. Renuga, Spectrochim. Acta A., 2013, 114, 1. O.H. Lowry, N.J. Rosebrough, A.L. Farr and Randall, R.J.J. Biol. Chem., 1951, 193, 265.
Chem Sci Rev Lett 2014, 3(12), 1068-1079
Article CS27204510
1078
ISSN 2278-6783
Chemical Science Review and Letters [23] [24] [25] [26] [27]
P. Nagaraja, A. Shivakumara and A.K. Shrestha, Anal. Sci., 2009, 25, 1243. A. Shivakumara, P. Nagaraja, N. Aradhana and K. Avinash,, 2010, 93, 1227. X. Yang, Y. Guo and Z. Mei, Anal. Biochem., 2009, 393, 56. K. Jiao and W. Sun, Microchem. J., 2002, 72, 123. H. Krishna, P. Nagaraja, A. Shivakumar, N.A. Chamaraja and N. Aradhana, Spectrochim. Acta A., 2013, 102, 75.
© 2014, by the Authors. The articles published from this journal are distributed to the public under “Creative Commons Attribution License ” (http://creativecommons.org/licenses/by/3.0/). Therefore, upon proper citation of the original work, all the articles can be used without any restriction or can be distributed in any medium in any form.
Chem Sci Rev Lett 2014, 3(12), 1068-1079
Publication Received Revised Accepted Online
History 27th Oct 2014 14th Nov 2014 20th Nov 2014 30th Nov 2014
Article CS27204510
1079