Revisiting Arguments for a Three Layered Data Warehousing Architecture in the Context of the Hadoop Platform Qishan Yang and Markus Helfert Insight Centre for Data Analytics, School of Computing, Dublin City University, Dublin, Ireland
[email protected],
[email protected]
Keywords:
Data Warehouse Architecture, Three Layers, Hadoop, Hive, HBase
Abstract:
Data warehousing has been accepted in many enterprises to arrange historical data, regularly provide reports, assist decision making, analyze data and mine potentially valuable information. Its architecture can be divided into several layers from operated databases to presentation interfaces. The data all around the world is being created and growing explosively, if storing data or building a data warehouse via conventional tools or platforms may be time-consuming and exorbitantly expensive. This paper will discuss a three-layered data warehousing architecture in a big data platform, in which the HDFS (Hadoop Distributed File System) and the MapReduce mechanisms have been being leveraged to store and manipulate data respectively.
1
INTRODUCTION
As the organizations’ data repository, the data warehouse was stated that it is a subject oriented, integrated, non-volatile and time-variant collection of data in support of management’s decision (Inmon et al., 2010). The hub-and-spoke model or the top down approach is used to build a data warehouse in which each data mart is built on a central data warehouse. According to Kimball (2002), “data warehouse is the conglomerate of all data marts within the company. Information is always stored in the dimensional model”. It is a bottom-up approach to develop a data warehouse. Conformed dimensional tables and data warehouse bus matrixes play vital roles to provide consistent dimensions for fact tables and guidelines for implementation of data marts independently and asynchronously. A data warehousing architecture can be assorted into three classifications: the single-layer data architecture, the two-layer data architecture and the three-layer data architecture (Devlin and Cote, 1996). The primary mechanism of the single-layer (realtime layer) is all data sets are stockpiled once only (Inmon, 1997). An operational system and a data warehousing system share the completely identical data resources. The two-layer data architecture adds a derived data layer which enables operational and informational requirements to be fulfilled separately.
This approach addresses the single-layer architecture problems, but it also has some limitations. It has low performance in inhomogeneous or large volumes of data resources (Devlin and Cote, 1996). The threelayer data architecture is comprised of a real-time data layer, a reconciled data layer and a derived data layer (IBM, 1993). It takes advantages of a reconciled data layer to clean data, solve inconsistent issues and prepare data. Data warehouses and OLAP (Online Analytical Processing) systems are decision-making support technologies to analyze large volumes of data online (Inmon, 1996). A traditional operational database may contain a few years’ real-time data. A data warehouse, however, comprises several decades’ datasets from heterogeneous resources. It is possible that a company has a petabyte sized data warehouse which may consist of structured data and unstructured data. Unstructured data is approximately four to five times as much as structured data (Inmon et al., 2010). In the age of big data, there are some challenges to store and operate the vast volume of information for data mining and analysis in an acceptable period of time. This situation forces people to build data warehouses on big data platforms. When reviewing the relative literature, there is some research which only developed few parts of DWH architectures on big data platforms. The motivation of this paper is to implement a system including all parts and
reconsider the argumentation of the three-layered warehousing architecture in the context of big data. The main contribution of this research is to provide a guideline to build a data warehousing system from data resources to OLAP in Hadoop and investigate the three layered DWH architecture still has many advantages within a big data framework. The structure of this paper is organized as follows. Section 2 illustrates the related work in this field. Section 3 describes the three-layered data warehousing architecture. Then the results description is demonstrated in section 4. The conclusion is provided in section 5.
2
RELATED WORK
2.1
The Three-layer Data Architecture
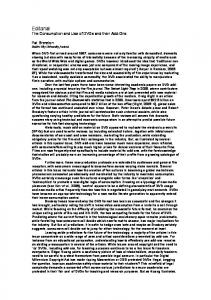
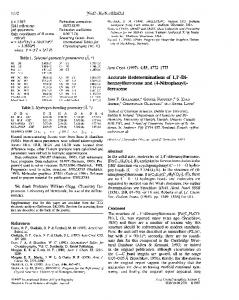
The three-layer data architecture comprises real-time data, reconciled data and derived data (Devlin and Cote, 1996). The outline of the architectural framework and its data flow are depicted in figure 1 below .
three-layered data architecture rather than the singlelayer or the two-layer data architecture.
2.2
Hadoop
Hadoop is a system to store and batch large quantities of data. It has high performance in ad hoc storage and analysis on petabyte of data (White, 2012). According to Apache Hadoop (2016), it is a highly throughput, parallel and fault-tolerant platform, and it has two critical frameworks, the HDFS and the MapReduce which play vital roles in storing and operating data. HDFS is the acronym of the Hadoop Distributed File System, which supplies highthroughput access to operated data; MapReduce is a programming system for parallel processing of large data sets and it provides two main functions (Mapper and Reducer) for users to manipulate this framework. These mechanisms are being widely used in corporations like Apple, eBay, LinkedIn, Yahoo and Facebook (Holmes, 2012).
2.3 Hive
Figure 1: The outline of a three-layer data warehouse architecture
Real-time data is generated by operated or production applications and it is stored in operational systems like DBMS or other data resources; Reconciled data is derived from real-time data and it is placed in data staging and data warehousing areas in which the data is cleansed and for further manipulations; Derived data is a repository of cleaned, integrated or even summarized data for analysis, decision-making, OLAP system etc. When data resources have physical distances mutually or have data inconsistent problems, data warehouse systems could get benefits from the
As a data warehouse tool, Hive promotes the performance of querying and managing large datasets in distributed storage. It has some significant characteristics listed below. It provides tools to facilitate ETL; It has a mechanism to conform data with diverse formats ; It has the ability to query data from HDFS and other data resources; Its jobs are divided and executed on the MapReduce framework. Hive offers a SQL-like language named HiveQL which enables users to query the data with SQL liked instructions. Moreover, it provides plug-in functionalities for programmers to create their own map and reduce to run more complicated analysis. This tool is good at batching jobs over large sets of append-only data (Apache Hive, 2016).
2.4 HBase Apache HBase is a distributed, scalable, big-data NoSQL database. The main principle of this database system is based on Google's Bigtable which takes advantage of a distributed file system named Google File System. HBase also leverages Bigtable-
like features on top of Hadoop and HDFS (Apache HBase, 2016).
2.5 Flume According to the Apache (2016), Flume provides a distributed service for efficiently collecting, aggregating and moving large amounts of data. It utilises data flow stream and recovery mechanisms. It can be considered as an extraction tool for online analytic applications.
2.6 HBaseIntegration HBaseIntegration has the capability to enable HiveQL statements to access HBase tables for both reading and writing. It supports Hive HBase Integration jars for communications between Hive and HBase. It also has the ability to join or union HBase tables and Hive tables (Apache HBaseIntegration, 2016).
2.7 Sqoop
3
THE THREE-LAYERED DWH ARCHITECTURE ON HADOOP
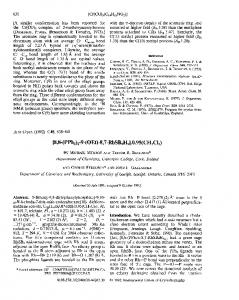
In this system, the DWH architecture, from data resources to OLAP, has been mainly established on a Hadoop framework and its subprojects. Its structure is divided as follows. The website logs could be considered as data resources and a collection tool named Flume sent data to HDFS, both of them constituted the real-time layer; HDFS, Hive and MySQL composed the reconciled data layer; the derived data layer comprised the data in HBase and RDBMS. This architecture was set up on virtual machines. To be more specific, two of them simulated data resource servers which offered realtime data generated by website log systems. Two of them could be considered as the corresponding data stage servers for each of the data resources. After the data stage servers, six virtual machines were employed in order to establish the Hadoop clusters, in which Hive, HBase and Sqoop have been installed, leveraged and run harmoniously. The detailed architecture is described in figure 2 below.
When transferring data between HDFS and external relational databases, Sqoop is a good choice to fulfil this job. It can import data from a RDBMS (relational database management system) into the HDFS or export the data back into a RDBMS. For instance, data can be migrated between HDFS and MySQL. It relies on the mechanism of the MapReduce to do these tasks, so it has the capability to process data flow in parallel (Apache Sqoop, 2016).
2.8
Relative Research
There are some papers to illustrate data warehouse architectures associated with big data platforms rather than an entire system. What is more, they have not described the bottom-up architecture of data warehouses. For instance, According to Abelló et al. proposal et al. (2011) research, they concentrated on building cubes with MapReduce, so it can be classified into derived data layer implementation. Thusoo et al. (2010) advocated using Scribe, Hadoop and Hive to build log collection, storage and analytics infrastructure at Facebook. Their paper only depicted the reconciled data layer and part of the real-time data layer. Arres et al. (2011) proposed building OLAP cubes on a cloud computing environment with MapReduce, which only referred to the derived data layer.
Figure 2: The architecture in the context of Hadoop
3.1
Real-time Data Layer
Real-time data can be considered as internal infrastructural information in an organization for transaction processing or external supplementary resources from the third-party vendors to strengthen business intelligent system. It is normally placed in the relative Relational Data Base Management System like Oracle, DB2, MySQL and other data management systems. In this system, real-time data was website log files. There were two virtual machines to act as website servers for generating web logs. The detailed data flow processing in real-time layer is presented below. When new logs were created, the data resource servers would send the data to their
relative data staging servers whose main job was to store log files temporarily. A Linux command named SCP was used in this step to copy data from resource servers to staging servers automatically every day. Before this step, the public keys and private keys for each server had been created to allow them to communicate mutually without passwords. These operations were indispensable, because Flume could not extract data from the data resource servers directly in order to avoid security issues. Then, Flume obtained data and delivered it to HDFS which acted as the real storage area in Hadoop clusters. The whole data flow processing and manipulations above were in the real-time data layer. After these, map and reduce approaches would be used to clear, format, integrate, normalize the data as well as solve quality issues.
analyzing the path of requested resources. For example, if the file path was /resource/pic/head.png in a record, it could be identified this was a picture query, so its corresponding record would be ignored by Mapper. However, if the file directory was /php/register.php, it could be considered as an effective page view, so its relative record would be manipulated by Mapper and then transferred to Reducer as valid data. After the processing of reading these records, Mapper was going to clean data like deleting special characters and reconciling formats. For example, each record’s columns were separated by ‘\t’ in order to fetch data easily through Hive. Finally the valuable records were delivered to the reduce method which wrote the records into files.
3.2
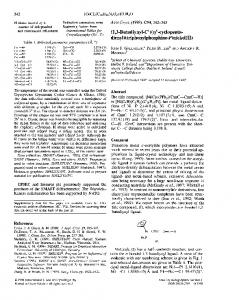
After real-time data was manipulated in MapReduce processing for cleaning and integrating, the preserved data would be grasped by Hive to build a data warehouse. While before this process, it was necessary to set up a data warehouse schema and corresponding tables in advance. The metadata of this schema was stored in the MySQL database which acted as an auxiliary metadata management system for Hive. In this system, the star schema based data warehouse was built straightforward and omitted other components like data marts. This schema is shown in figure 3 below.
Reconciled Data Layer
Nowadays it is common that a company has a variety of branches located in different places in a country or all around the world. There are some circumstances should be taken into account, when acquiring and integrating data from independent data resources which are operated and managed by an organization but with inconsistent data structure definitions, there may be some data quality issues must be overcome before using it. Otherwise the performance of decision-making systems or OLAP systems is not guaranteed. The Reconciled data layer is the primary area to integrate and clean data sets. After data has been integrated and cleaned, the data in this layer is read-only resources rather than the operational data sets which could be updated in daily transactions. The derived data layer is considered as the central historical information repository to store treated data sets.
3.2.1 Data Warehouse Schema
3.2.1 Data Preparation The predominant data quality issues in this data resources were data unformatted problems (the Common Log Format and the Extended Common Log Format) and errors made by clients’ side or website servers. Besides, there were some useless records needed to be deleted, for instance, picture query, css files or js files loading. In this experiment, the unprofitable records were ignored in the Mapper approach when cleaning data. More precisely, it filtered the status of the records started with 3, 4 and 5, which mean request redirected and some errors happened in client-side and server-side. It was also necessary to find out nonsignificant queries by
Figure 3: The star schema of a website log data warehouse
All the information required by the schema could be extracted from formatted records. For example, a treated log record likes the format below XXX.20.38.100 - - 18/11/2015 13:25:11 GET /php/register.php HTTP/1.1 200 1234 http://www.leiviel.com Mozilla/5.0 Windows U Windows NT 5.1 zh-CN rv_1.9b4
Gecko/2008030317 Firefox/3.0b4 According to this record, the client IP, the visited time, the request method, the request resource, the protocol, the request status, the agent etc. would be detached and loaded into this schema. After the data has been loaded into this central repository, the following job was how to analyze and exhibit the data in informational systems.
3.3
4
Derived Data Layer
The data in the derived data layer has been cleaned, formatted, aggregated or even summarized for presentation tools, decision-making applications, ad hoc query tools etc. The derived data layer in this system was formed by OLAP cubes in which endusers’ requirements would be responded instantaneously. An OLAP system obtains information from an underlying data warehouse. It is necessary to calculate results and put them into OLAP beforehand. Hence, in this experiment, the daily PV (page views) and UV (unique visitors) have been counted and stored in HBase and RDBMS in advance for different purposes. When evaluating the PV and the UV, join operations have been taken among the fact table and dimensional tables by HiveQL commands, in this process, identical IPs and pages were counted respectively. For instance, the page views counted in a certain day is demonstrated in table 1 below. Table 1: The sample of page views results
RID 137 138 141
PathID 1 2 5
Page index.php forum.php register.php
control. Therefore, when weekly or monthly even annual PV and UV statistical results were requested by end-users to estimate performance of a website, it was possible to get the results in a short period of time. Otherwise, the lraw data which was placed in HDFS would be calculated by Hive.
Count 1185 923 13
Time 18/11/2015 18/11/2015 18/11/2015
The first column was a record ID to identify each record. PathID was considered as the page identification number and the attribute of Page was the name of this page. The column of Count was calculated by grouping PathID. The last column stored the time of this operation happened. According to this table, the data analysis operations could be taken. For example, it can be seen that index.php has been visited 1185 times at that day. Majority of clients preferred to visit the forum.php page. What is more, not more than 13 people registered at this day. The results could be stored in the HBase via HBaseIntegration. Hence, it was convenient to load data into HBase only by using HiveQL commands. The results were alternatively transferred to external RDBMS via Sqoop. These jobs were invoked every day under shell commands
RESULTS DESCRIPTION
All frameworks and tools were working harmoniously in the operations of data transferring, data cleaning, data manipulating etc. The outline of processing occurred in each layer is described as follows. The website log files acted as real-time data which recorded clients’ actions. In real-time layer, Flume gathered log files from data stage servers and sent them to HDFS in parallel. The reconciled data layer was the key manufacturing site to gather data, clean data, integrate data and deal with data quality issues via Mapper and Reducer functions in Hadoop. Hive took a responsibility to establish data warehouse. The main purpose of the derived data layer was considered to display data or make preparation for data analysis. The OLAP cubes were stored in HBase and RDBMS for data presentation. Most of the operations and OLAP cubes constructing processing were invoked by shell commands automatically. Most of the data flow processing tasks were fulfilled in parallel, which meant serval nodes were running a same job but different parts at the same time. In addition, this system was a low-cost synthesized data warehouse architecture but with highly throughput and big data analysis capability. Most of platforms and tools were open-source, which could be conducive to reduce the start-up cost of deploying a data warehouse.
5
CONCLUSIONS
The emerging software and platforms like Hadoop and its subprojects have been exploited to achieve the goals in this experiment. Decades passed, technologies have been evolving all the time, the three layered architecture is still very beneficial to build a data warehouse within the big data context. From the perspective of this experiment, this system only has a simple warehousing schema and an OLAP system. The Hadoop platform worked on a computer in independent virtual machines which shared hardware. Therefore there are some aspects
can be ameliorated in this system. In the following work, the Hadoop platform would be established on physically independent commodities. It is necessary to design a stable and robust data warehousing schema in order to fulfill more sophisticated requests from end-users.
ACKNOWLEDGEMENTS This publication was supported by Science Foundation Ireland grant SFI/12/RC/2289 to InsightCentre for Data Analytics (www.insight-centre.org).
REFERENCES Devlin, B. and Cote, L.D., 1996. Data warehouse: from architecture to implementation. Addison-Wesley Longman Publishing Co., Inc.. Inmon, W.H., 1997. What is a data warehouse?. Prism Tech. Topic 1(1). IBM, 1993. Information Warehouse Architecture I. IBM Corporation. Inmon, W.H., Strauss, D. and Neushloss, G., 2010. DW 2.0: The architecture for the next generation of data warehousing: The architecture for the next generation of data warehousing. Morgan Kaufmann. Kimball, R. and Ross, M., 2002. The data warehouse toolkit: the complete guide to dimensional modelling. Nachdr.]. New York [ua]: Wiley. Inmon, W.H., 1996. Building the Data Warehouse. Wiley. New York, USA. Apache Hadoop, (2016) Welcome to Apache Hadoop. Available at: https://hadoop.apache.org/ [Accessed 18 February 2016]. Holmes, A., 2012. Hadoop in practice. Manning Publications Co.. Apache Hive, (2016) Apache Hive TM. Available at: https://hive.apache.org/ [Accessed 18 February 2016]. White, T., 2012. Hadoop: The definitive guide. " O'Reilly Media, Inc.". Apache HBase, (2016) Welcome to Apache HBase. Available at: https://hbase.apache.org/ [Accessed 18 February 2016]. Apache Flume, (2016) Welcome to Apache Flume. Available at: https://flume.apache.org/ [Accessed 18 February 2016]. Apache HBaseIntegration, (2016) Hive HBase Integration. Available at: https://cwiki.apache.org/confluence/display/Hive/HBa seIntegration#HBaseIntegrationHiveHBaseIntegration [Accessed 18 February 2016]. Apache Sqoop, (2016) Sqoop User Guide. Available at: https://sqoop.apache.org/docs/1.4.6/SqoopUserGuide. html#_introduction [Accessed 18 February 2016].
Thusoo, A., Shao, Z., Anthony, S., Borthakur, D., Jain, N., Sen Sarma, J., Murthy, R. and Liu, H., 2010, June. Data warehousing and analytics infrastructure at facebook. In Proceedings of the 2010 ACM SIGMOD International Conference on Management of data (pp. 1013-1020). ACM. Abelló, A., Ferrarons, J. and Romero, O., 2011, October. Building cubes with MapReduce. In Proceedings of the ACM 14th international workshop on Data Warehousing and OLAP (pp. 17-24). ACM. Arres, B., Kabbachi, N. and Boussaid, O., 2013, May. Building OLAP cubes on a Cloud Computing environment with MapReduce. In Computer Systems and Applications (AICCSA), 2013 ACS International Conference on (pp. 1-5). IEEE.