S17-4
RFID-BASED OCCUPANCY DETECTION SOLUTION FOR OPTIMIZING HVAC ENERGY CONSUMPTION Shuai Li*, Nan Li, Burcin Becerik-Gerber, and Gulben Calis Sonny Astani Department of Civil and Environmental Engineering, University of Southern California, Los Angeles, USA * Corresponding author (
[email protected]) ABSTRACT: Current building climate control systems often rely on predetermined maximum occupancy numbers coupled with temperature sensor data to regulate heating, ventilation, and air conditioning (HVAC). However, rooms and zones in a building are not always fully occupied. Real-time occupancy information can potentially be used to reduce energy consumption. The paper proposes an RFID-based occupancy detection solution to address the need for real-time in-building occupancy information. The proposed solution can track real-time location of tagged occupants, and report the occupancy at the zone level. A prototype was built and tested in a campus-dining hall with three zones. Occupants who were waiting in a queue, walking, or sitting were equipped with active RFID tags. The results demonstrated that the location of occupants could be estimated and 71% of the occupants could be detected at the right predefined zone. Based on the findings, detailed and operable strategies for optimizing HVAC-related building energy consumption by using occupancy information are proposed. Keywords: Occupancy Detection, RFID, Building Energy Consumption, Optimization, HVAC 1. INTRODUCTION
rely on gross generalizations to operate HVAC systems,
Few topics are more relevant in current times than energy
such as operating for the peak occupancy load as opposed
management. Global climate change, a growing population,
to the optimal, leading to more energy consumption than
decreasing
needed. A prime example is occupant congregations within
availability
of
fossil
fuels,
increasing
environmental and economic concerns regarding energy
a
use are driving forces towards more sustainable ways of
temperature control due to thermal heat gains. The
responding to the energy needs. In the U.S., 48% of energy
availability and integration of occupancy information in
consumption is from buildings, 35% of which is consumed
operations of HVAC systems bear significant promise in
by heating, ventilation, and air conditioning (HVAC)
reducing heating and cooling energy consumption.
systems [1]; therefore, they are prime targets for energy
Due to potential energy savings, the topic of occupancy
optimization.
that
driven HVAC operations has attracted considerable
improvements in operation and management of HVAC
attention in academic research. To lay the basis of
systems can save up to 50% of building’s energy
occupancy driven HVAC operations, different solutions
consumption [2,3]. Occupancy information is an important
were proposed to detect the existence of occupants [2-5].
variable to determine the heating and cooling loads, and it
With the occupancy information, timely adjustments to
affects how HVAC systems are adjusted to satisfy various
HVAC systems such as redirecting air flows and reducing
occupant
operations
system running time are made possible in response to
environmental
either real-time occupancy loads, or predicted loads based
uncertainties and dynamic occupancy load factors [4].
on historical data [3,6]. Energy savings were estimated
Previous
demands.
automatically
would
research
Ideally, respond
suggests
building to
However, current facility management practices usually
587
building
space
requiring
optimization
of
space
S17-4
through simulations, which varied between 10% and 60%
conditioning a room to a comfortable temperature defined
[2,7].
by American Society of Heating, Refrigerating and Air-
This study proposes an occupancy detection solution to be
conditioning Engineers (ASHRAE) standards only when
integrated with HVAC operations, and evaluates the
the room was predicted to be occupied for 10 minutes or
proposed solution’s technological feasibility by testing it in
longer. The research reported a saving of 20% in HVAC
a large open space. The rest of the paper is organized as
energy consumption. However, the occupant comfort was
follows: sections 2 review occupancy detection solutions
reduced, as the system tended to anticipate very low
for optimizing HVAC energy consumption; and section 3
occupancy in some areas and provided an insufficient
identifies research challenges and objectives; sections 4
service.
and 5 describe the research approach and findings for the proposed RFID-based occupancy detection solution;
3. RESEARCH MOTIVATION AND OBJECTIVES
section 6 outlines the framework to implement occupancy
The majority of the occupancy detection solutions in
information in optimizing the energy efficiency of HVAC
previous
systems; and section 7 concludes the paper.
optimization. For those occupancy detection solutions
research
were
not
intended
for
energy
aimed at occupancy driven HVAC operations, few were 2. LITERATURE REVIEW
fine-grained and validated in real-life scenarios. Previous
Previous research investigated the feasibility and value of
occupancy driven operation strategies were high level,
occupancy detection and implementation of occupancy
proposing to regulate the airflow volume and HVAC
driven HVAC operations. Warren and Harper [2] proposed
system running time without specifying how these
that CO2 concentration could be sensed and monitored as
parameters were actually regulated. Moreover, previous
an indication of high-level occupancy. Their research
research assumed that the energy savings were proportional
proposed to maintain a certain level of CO2 concentration
to the reduction of airflow volume and running time is
in a room by adjusting the airflow volume, and reported a
problematic, and therefore estimated the potential energy
saving of 53.3% in heating energy through simulation. Lee
savings based on the reduction in airflow volume and
et al. [5] provided an occupancy detection solution that
running time.
uses RFID sensors, but the system was coarse-grained and
Consequently, the first goal of this study is to propose an
could only detect occupants that passed doors or sat at
occupancy detection solution that can support occupancy
tables. Agarwal et al. [8] used passive infrared sensors to
driven HVAC operations by tracking multiple stationary
detect occupancy in each room, and proposed to maintain
and
the temperature of a room at a comfortable level only when
occupancy loads for each thermal zone in real time. The
an occupant was detected in the room. Tachwali et al. [3]
second goal of this study is to examine current HVAC work
addressed the second limitation by quantizing the cooling
procedures, identify and quantify major energy consumers,
air flow volume into three levels, and determined the
and propose detailed and operable strategies to realize
volume based on occupancy in each room. Simulations
occupancy driven HVAC operations and achieve energy
reported an energy saving of up to 50%, which, however,
savings.
mobile
targets
simultaneously,
and
reporting
was subject to external weather conditions. Varick et al. [7] used a digital camera based occupancy detection solution
4. RESEARCH APPROACH
to count occupants, which provided an accuracy of 80% in
4.1 Occupancy detection algorithm
occupancy detection. This occupancy detection system
This research uses a proximity based algorithm. It relies on
suffered from high costs and privacy issues. Occupancy
received signal strength indication (RSSI) values of
prediction based on logged occupancy information was
different tags, an indicator that is used to measure the
also examined [9]. The research simulated to start
strength of radio waves received by an antenna. The
588
S17-4
algorithm includes the following components: reference
occupants remained at the same locations. Figure 2
tags, tracking tags, and virtual tags. Reference tags are
illustrates the locations of twelve occupants.
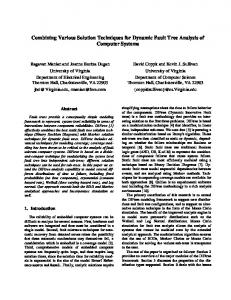
deployed in the sensing area as reference points. Virtual tags operate in the same way as reference tags except for that they are imaginary tags with estimated RSSI readings instead of actual measurement. Targets are located using locations of reference tags and virtual tags nearest to them. More details of the algorithm can be found in [10,11]. 4.2 Test description Tests were carried out in a campus dining hall at the University of Southern California. The test bed covered an area of 12.5 m wide, 24.3 m long, 3.5 m high, and hosted three food counters. The authors divided the test bed into three zones as shown in Figures 1 and 2. The rationale behind the space division is that each zone had different functions and are semi-separated by 1 m high partitions. Moreover, customization of isolated environments in an open space for localized climate control is proven to be possible [12], which provides more flexibility in space division so that it can be consistent with actual space geometry and usage. Zones 1 and 2 cover two individual food counters, where occupants stand in line for purchasing food and sit for having their meals. Zone 3 covers the area Figure 2: Test bed layout
where occupants wait in line for purchasing their coffee. The test bed area is an open space with no walls or 5. FINDINGS
columns.
5.1 Occupancy detection rate for each occupant type To evaluate the performance of RFID-based occupancy detection solution proposed in this research, the actual locations of all tagged occupants are compared with their estimated locations. Occupancy detection rate is defined as the percentage of both stationary and mobile occupants that were accurately estimated to be in the zones where they Figure 1: Photos of three zones
were actually located.
A total of 16 reference tags, 12 target tags (two types: 9
About 67% of all stationary occupants in all zones were
stationary tags and 3 mobile tags), 4 antennae and 2 readers
accurately located. All stationary targets in Zone 1 and
were deployed. Three different scenarios for occupant activities were tested. Three occupants kept walking as
Zone 3 were accurately located in their zones, while the
they were choosing where to sit. Five occupants waited in
detection rate in Zone 2 was only 40%. Target tag 6 was
line to get their food near the food counters.
Four
inaccurately located in Zone 1 and target tags 4 and 7 were
occupants were seated in the sitting area. Each mobile
inaccurately located in Zone 3. One explanation for the low
occupant moved to 5 different locations and the stationary
accuracy in Zone 2 is that there were more occupants in
589
S17-4
this area compared to the other two associated with a more
estimated mobile occupant route and stationary occupant
dynamic environment which could have caused a stronger
locations in zone 1 were shifted towards zone 2. If the
interference of the radio wave emitted by multiple active
occupants had been walking around or seated near the
RFID tags. Moreover, there were more students in zone 2
boundary between zone 1 and zone 2, they might well be
since food counter 2 is very popular which generated a
estimated inaccurately in zone 2.
higher environmental noise to decrease the detection
5.3 Occupancy detection rate for each occupant location
accuracy. [13] The surrounding disturbance from students’ movement could lead to significant changes in RSSI values
type Based on their locations, occupants can be divided into two
which will result in unexpected lower detection rate.
categories: boundary occupants that are next to the
As for the mobile occupants, two out of the three mobile
boundary of the sensing area, and central occupants that
occupants
are located at the center of the sensing area. Table 2
were
accurately
located
in
their
zones
throughout the test, and the overall accuracy detection rate
presents detection rates of occupants at different locations.
for the mobile occupants was 66.7%. The mobile occupants
Occupancy detection rate can be affected by where the
in zone 1 and 2 were accurately located throughout the
occupants are located, near the boundary or at the center of
tests with 100% detection rate. The detection rate for the
the sensing area. The boundary occupants were less
mobile tag in Zone 3 was only 20%, which meant that only
accurately located than central occupants with decrease of
one out of five locations was accurately estimated. The rest
29% in occupancy detection rate.
of the four locations were inaccurately estimated to be
mainly because those boundary occupants were not in the
either in Zone 2 or Zone 1. Compared with the stationary
complete coverage of the nearby reference tags.
occupants, the mobile occupants may fluctuate between
Table 2: Occupancy detection rate for occupants at
low and high points of radio wave phases with a large
different locations
spread which will generate a larger deviation in the detection rate [14]. 5.2 Occupancy detection rate for each zone
Boundary
The overall occupancy detection rate for all three zones
Occupants
was 71%. The occupancy detection rate for each zone is shown in Table 1.
The worse results were
Occupant
# of estimated
Average
IDs
locations
accuracy rate
16
62.5%
8
87.5%
T1 T2, T6, T7. T8, T9 M1, M3
Central
T3, T4,
Occupants
T5, M2
Table 1: The occupancy detection rate for three zones # of
# of
# of
Average
stationary
mobile
estimated
accuracy
occupants
occupants
locations
rate
Zone 1
2
1
7
100%
Zone 2
5
1
10
70%
Zone 3
2
1
7
44%
6. ENERGY SAVING IMPLICATIONS The test results indicate that the proposed occupancy detection solution can locate the majority of occupants at the zone level in real time. To identify and quantify potential sources of energy savings, the procedure of a typical HVAC system is examined. Chillers and heaters
The highest occupancy detection rate was achieved in zone
that serve one or multiple buildings generate chilled or
1, where all occupants were accurately located. As the
heated water. Air handler units (AHUs) that serve the
smallest zone on the boundary of sensing area, Zone 3
whole or part of a building take in outdoor air, mix it with
generated the worst occupancy detection rate. The
590
S17-4
air flows that return from all thermal zones, and cool or
2. Adjusting supply air temperature Tsa . Increasing Tsa will
heat the mixed air to a set point with chilled or heated
result in reduction in the chilled water production and
water. The conditioned air is then distributed by fans to all
distribution energy consumption Qcw . However, given a
thermal zones. The demand for the volume of conditioned
certain cooling or heating load, this strategy requires an
air of a thermal zone is determined by the difference
increase in supply air volume Vsa ;
between the zone’s actual temperature and the set point,
3. Adjusting the supply air volume Vsa . Reducing Vsa will
and is regulated by the VAV box that serves this zone.
result in reduction in both chilled water production energy
There are two major energy consumers in this procedure: the production and distribution of chilled and heated water
Qcw and supply air distribution energy consumption Q fan . However, given a certain cooling or
at the building level, and the distribution of conditioned air
heating load, this strategy requires a decrease in supply air
at the thermal zone level. To quantify the energy
temperature Tsa .
consumption, a simple model is established as follows:
The limitations and tradeoffs in implementing each of these
Suppose Vbz is the amount of outdoor air the AHU takes in
strategies are discussed. An integral strategy requires the
Tosa , and Vsa is the amount of air distributed to all thermal zones, Tz is the temperature of
input of all parameter values, which lays the basis of
mixed returning air from all thermal zones. The
calculations or simulations.
consumption
with temperature
quantifying the potential energy savings through theoretical
temperature of the mixed air is:
Tma (Vbz / Vsa )Tosa (1 (Vbz / Vsa ))Tz (1) The energy needed to generate chilled or heated water to
7. CONCLUSION The paper proposed an RFID-based occupancy detection
condition the mixed air is:
solution to measure the real-time in-building occupancy
Qcw 0.211.1 (Tma Tsa ) Vsa
information. The HVAC system control routine can be
(2)
potentially directed with the occupancy driven strategy to
where Tsa is the average indoor temperature.
optimize the energy consumption. Therefore, the energy
The energy consumption for distributing the air flow is;
Q fan 1.25 3.412 Vsa
consumption can be reduced in the areas where there are
(3)
few occupants. To test the feasibility of occupancy
The total energy consumption by the HVAC system is:
Qz Qcw Q fan
detection to support optimization of HVAC energy
(4)
efficiency, an RFID-based occupancy detection solution
Accordingly, if some thermal zones are detected to have no
was developed and deployed in a campus-dining hall.
or low occupancy and the heating and cooling loads are
The proposed RFID-based occupancy detection solution
therefore lower than the scheduled peak loads, the
demonstrated an overall detection rate of 71%. However,
following strategies can be taken into account to adjust the
the occupancy detection rate varied with different zones,
HVAC operations to reduce the energy consumption:
occupant types and locations of occupants in the sensing
1. Adjusting in-take air volume Vbz . Reducing Vbz will lead
area. Stationary occupants located in the center of the
to reduction in the temperature of mixed air Tma and hence
sensing area were estimated with a higher accuracy
the chilled water production and distribution energy consumption
Qcw .
compared with mobile occupants and boundary occupants.
However, to ensure the indoor air
Overall, the proposed RFID based occupancy detection
quality, the in-take air is subject to a minimum volume per
solution proved to be effective to detect most occupants
ASHARE standards;
and has the potential to provide occupancy driven
591
S17-4
strategies
for
additional
the
efforts
HVAC should
operations. be
Nevertheless,
devoted
to
[6] Newsham G.R., Birt B.J., "Building-level occupancy
further
data to improve ARIMA-based electricity use forecasts",
improvement on current occupancy detection rate. Possible
Association for Computing Machinery, pp. 13-18, 2010.
solutions include increasing the density of sensors,
[7] Erickson V.L., Lin Y., Kamthe A., Brahme R., A,
incorporating
Surana A.E. et al., "Energy efficient building environment
algorithm
calibration,
reducing
environmental effects and so on. With the availability of
control
zone
measurements", Association for Computing Machinery, pp.
level
occupancy
information,
major
energy
strategies
using
real-time
occupancy
consumers in current HVAC work procedure were
19-24, 2009.
recognized, and a model was established to quantify the
[8] Agarwal Y., Balaji B., Gupta R, et al., "Occupancy-
energy consumption. Potential energy savings were
driven energy management for smart building automation",
identified, and three strategies were proposed accordingly,
Association for Computing Machinery, pp. 1-6, 2010.
with their values, limitations, and tradeoffs discussed. Once
[9] Erickson V.L., Cerpa A.E., "Occupancy based demand
implemented, these strategies are expected to utilize the
response
occupancy information to save HVAC related energy
Computing Machinery, pp. 7-12, 2010.
consumption.
[10] Li N., Li S., Becerik-Gerber B., et al., "Design and
HVAC
control
strategy",
Association
for
Evaluation of Algorithm and Deployment Parameters for ACKNOWLEDGEMENTS
an RFID-Based Indoor Location Sensing Solution",
We greatly appreciate the support of Lygnsoe Systems, Inc,
Proceedings of 2011 ASCE International Workshop on
who funded and supported this research. Any opinion,
Computing in Civil Engineering, 2011.
findings, conclusions expressed in this paper are these of
[11] Li N., Li S., Becerik-Gerber B., et al., "Deployment
the authors and do not necessarily reflect the views of
Strategies and Performance Evaluation of a Virtual-Tag-
Lygnsoe Systems, Inc.
Enabled Indoor Location Sensing Approach", J.Comp.in Civ.Engrg, under review, 2011.
REFERENCES [1] US Department of Energy, Building Energy Data Book,
[12] Lo L.J., Novoselac A., "Localized air-conditioning
2011.
with occupancy control in an open office", Energy Build,
[2] Warren, B.F. and Harper. N.C., "Demand controlled
Vol. 42, pp. 1120-1128, 2010.
ventilation by room CO2 concentration. A comparison of
[13] Li S., Li N., Calis G., et al., "Effects of Environmental
simulated energy savings in an auditorium space", Energy
Factors on the Accuracy of RFID-Based Indoor Location
Build, Vol. 17, pp. 87-96, 1991.
Sensing Systems", Journal of Advanced Engineering
[3] Tachwali Y., Refai H., Fagan J.E., "Minimizing HVAC
Informatics, under review, 2011.
energy consumption using a wireless sensor network",
[14] Zhao Y., Liu Y., Ni L.M., "VIRE: active RFID-based
IEEE, Piscataway, pp. 439-44, 2007.
localization using virtual reference elimination", IEEE,
[4] Qin J., Li B., Salsbury T., "Identification and control
Piscataway, 2007.
for optimizing building energy demand", 2009. [5] Lee H., Jae S.C., Elmasri R., "A conflict resolution architecture for the comfort of occupants in intelligent office", IET, pp. 3-4, 2008.
592