Rhythm perception through different modalities Katri Kosonen1
Roope Raisamo2
U n i v e r s i t y o f Ta m p e r e
U n i v e r s i t y o f Ta m p e r e
ABSTRACT Rhythms are an everyday phenomenon. The most common source of rhythm is music. Rhythm perception studies in the past have mostly concentrated on the auditory and visual modalities. For example, loud music can also be felt as vibrations. Previous studies have showed that audio dominates rhythm perception. Our experiment was conducted to study rhythm perception through three different modalities. We had 12 subjects and 3 sessions with each. In each session there were rhythms through the auditory, tactile and visual modalities. Three different rhythm lengths were used: 4, 5 and 6 beats. In each category there were 14 rhythms. The tasks were to perceive and reproduce these rhythms as accurately as possible. The results showed that audio dominated the tactile and visual modalities. There were more correctly reproduced rhythms with the tactile modality than with the visual modality. K e y w o r d s : tactile, audio, visual, haptics, rhythm perception, rhythm reproduction 1
INTRODUCTION 1
Audio is the most natural way for people to hear music and rhythms. With rhythms and temporal patterns many kind of information can be provided to people. Rhythms and temporal patterns could be used more than they presently are. To make the use of the rhythms basic research is needed to uncover the capabilities and limitations of people in perceiving the rhythms. There are several comparative studies about perceiving rhythms given through audio and vision. These are not the only modalities that can be used use in rhythm perception. Haptics is a good possibility: rhythms can be also provided through vibrotactile rhythmic stimuli. The sound is based on similar waves as the vibrotactile effects. Thus, vibrotactile effects could be good means to provide the users with rhythmic information. Vibrotactile stimuli could benefit hearing impaired people by helping them to feel the rhythms. This would be essential, for example, when using messaging devices and other devices that can give information to the user about the different events and states of the machine. Also blind and visually impaired people could get help with this kind of extension to the information channels. Previously the only actively used information channel between computers and blind users has been the audio channel. Because of that the audio channel easily runs out of capacity. There are too many things to tell to the user so that all information could be given through audio. If the users could be provided with rhythmic vibrotactile stimuli, the audio channel could be used for the other kind of information and this way the pressure on the audio channel could be eased up. Vibrotactile rhythms can also be used to create tactons and for example vibrotactile tactons [3]. This way vibrotactile 1 2
e-mail:
[email protected] e-mail:
[email protected]
feedback could benefit the hearing impaired, visually impaired and possibly even people with no vision problems. The aim of our experiment was to find out how rhythms are perceived with other senses than hearing. A comparison was made between audio, tactile and visual stimuli to find out if the tactile and the visual modality could be used when delivering rhythmic information. There were several research questions in this experiment. 1. Are there more mistakes in the rhythm reproduction, when the rhythm example is given in tactile or visual manner? 2. Do the results change when more experience is gained? Are there fewer mistakes, with more experience? 3. Are the rhythms easier to reproduce, if the rhythms used in the test are regular rhythms instead of irregular rhythms? 4. Does the quality of the rhythm example affect the beat length the user uses while reproducing the rhythm? 5. How do the users react to different modalities in the rhythm perception and reproduction? The first research question was aimed to find out the overall rhythm perception capabilities through the modalities used. The second question was chosen to find out how learning affects to the results. Does experience in different modalities help in rhythm perception? What kind of rhythms should be used? Which are the most easily remembered regular rhythms and irregular ones? The goal of the fourth question was to find more precisely how the rhythms are perceived through different modalities. The fifth research question addressed the user’s opinion and experiences while perceiving the rhythms. Users’ opinions are very important. If there is too much work in perceiving the rhythms the users will not use that modality. The main goal of this experiment was to get basic knowledge of facts that affect rhythm perception. 2
PREVIOUS WORK
Vibrotactile rhythms have already been found to be an effective and very useful method in, for example, Tactons by Brown et al. [3]. Still, there are no earlier studies on the rhythm perception in user interfaces making use of the tactile modality. Most of the experiments have compared the auditory and visual modalities in rhythm perception. Based on these studies it can be said that audio dominates rhythm perception and the finest differences in rhythm are perceived through audio [9]. Other researchers have tried to find the factor that would explain the audio dominance over the visual modality, and they have found out that, for example, the loudness or the visual disturbance doesn’t affect the fact that audio dominates the cross-modal temporal coding [4]. There has also been a hypothesis that experience in audio rhythms would explain the difference, but that has been proven wrong [4]. It has also been studied if the rhythm reproductions methods used in the experiments would have explained the audio dominance. It was found that writing the rhythms with
letters ‘S’ for short rhythms and ‘L’ for long rhythms, or rhythm reproduction through a piano keyboard doesn’t affect the audio dominance [4]. While either of those methods was used audio dominated the visual modality in rhythm reproduction. It has been found that if the chunking of the beats is disturbed, there is very little difference between the auditory and visual modalities [5]. But when using rhythms usually it is not desirable to disturb the chunking effect, because it comes naturally from the rhythm structure. The natural temporal pattern of the rhythm would need to be altered. Modality effects decrease also if the beat durations increase to about 2000 ms and over that [5]. With longer beat durations it becomes too hard to remember the beat lengths. So the human’s memory capacity sets the limit in that aspect. There is also an upper limit to the interval between two stimulus markers. The comprehension of a rhythm as a unit structure is impossible if the longest interval between two stimulus markers transcends 600-800 ms [8]. The pattern of the rhythm also has a time limit. In order to comprehend a rhythm as a whole the pattern shouldn’t be longer than 3 or 4 seconds [8]. In previous research it has been noticed that learning has some effect on the performance in the visual condition when comparing the first and the second trials [4]. In the present experiment, one of the goals was to find out how learning would affect tactile rhythm perception and reproduction. A study also revealed that the optimal ration of the long to the short intervals for the perception and reproduction of the rhythm structures is about 2:1 [8]. 3
EXPERIMENT
The experiment was conducted in a usability laboratory. The users were asked some background questions concerning their previous experience with music and with the devices used in the experiment. During the tactile phase of the experiment white noise was played to the subjects and they were asked to wear hearing protectors to eliminate the influence of the sounds the tactile device makes when tactile effects are played. After each modality the users evaluated their performance with that modality. After all the modalities and tasks were done, the final questionnaire was filled in. The questionnaire contained questions on subjects’ opinions on the devices and their preferences of modalities. The software saved log files for the analysis. 3.1
3.2
Apparatus
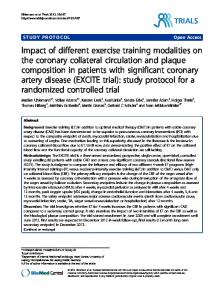
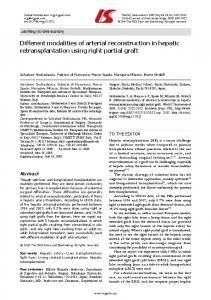
Logitech WingMan force feedback mouse shown in Figure 1 was used to create the rhythms. A java applet with the Immersion TouchSense SDK for Java [7] was used in this experiment. This experiment was designed for the sighted subjects so some instructions were given as text. The program included instructions as text and the rhythm played through three different modalities (Figure 2). A button was used to continue forward in the experiment.
Figure 1: The Logitech WingMan force feedback mouse
Auditory rhythms were played with loudspeakers to the user using simple tones. Tactile rhythms were created by vibrations with the Logitech WingMan mouse. Visual rhythms were shown to the user with a blinking object on the screen. This method was selected, because in this way the rhythms were presented in a similar manner as the auditory and tactile rhythms. The software recorded the rhythms based on mouse clicks when the user reproduced the rhythms. There wasn’t any feedback for the users while reproducing the rhythms.
Participants
In the experiment the subjects were 12 normally sighted university students. Six of the subjects were female and six were male. Their age ranged from 19 to 24. Two male and four female subjects had experience on rhythms based on a musical hobby. Almost all subjects had tried some tactile devices in games, mostly game pads or steering wheels. Three subjects said that they have never tried these devices and 2 subjects told to use some of them regularly. The subjects participated in three sessions in different days. One session included all three different modalities: auditory, tactile and visual. With each modality there were three different lengths of rhythms: 4, 5 and 6 beats. In the following sessions the subjects made the same test tasks in a different order. The order of modalities and lengths of the rhythms were counterbalanced between the subjects. In one session with all three modalities the order of the rhythm lengths was always the same. The order of rhythms was randomized in each round so that the learning effect wouldn’t affect the results. One round included 14 rhythms. Overall, there were 9*14=126 rhythms in one session.
Figure 2: The prototype used in the experiment
In the first phase of the experiment the test procedure was introduced to the subject and there were two examples of each modality used in the test: auditory, tactile and visual. After this practice session the actual tests were done through each modality. The audio test played rhythms to the user through the loudspeakers. The tactile test produced the rhythms to the user through the rhythmic vibrations, and the visual test through the blinking visual object on the screen. After the user had heard or felt or seen the rhythm he or she was asked to reproduce it by clicking the mouse button according to the rhythm in the piano keyboard. The reproduced rhythm was recorded and the forward button was shown to the user. When the user was ready he or she could continue to the next rhythm. The prototype informed the user when the modality or the rhythm length was changed so that the user had a chance to focus on a new task.
3.3
Tasks
In the rhythm, the duration of pauses between the beats was constant (300 ms) and the duration of the beats was varied between short (300 ms) and long (600 ms). The lengths of beats were chosen so that the long beat was twice as long as the short beat. The interval between the beats was chosen to be constant in the whole experiment so that it would not make the task too difficult. There were two kinds of rhythms in this experiment, irregular and regular rhythms. In irregular rhythms the order of the long and short beats can vary randomly. Regular rhythms used in this experiment follow the rule that short beats always appear in pairs. These are the most common and simplest rhythms that occur in the music: those easy rhythms taught in a musical playschool. There is an example of the graphical presentation of these kinds of rhythms in Figure 3.
The program saved the information on the times spent in the reproduction of the rhythms and the lengths of the individual beats in each rhythm. From the beat times it was calculated if the beat was interpreted as a short or a long beat. The software looked for the shortest and the longest beat in each rhythm and counted the median of beat times. Each beat was then compared to this threshold value if the beat was longer or shorter than the median beat length. If the beat was shorter than median length it was marked as a short beat and if the beat was longer than the median it was marked as a long beat. The software counted which beats in each rhythm were wrong. Information was also collected with a questionnaire. Some background information was asked: gender, age, experience in music and experience in using tactile devices. During the test the subjects were also asked to fill in a workload test of each modality. In the end the user were asked to tell their opinions about the modalities and to choose their preferred modality. 4
RESULTS
4.1 Figure 3: Graphical presentation of simple regular rhythms.
It is interesting to find out how very simple rhythms are understood. Usually the simplest rhythms follow the rule of quavers always appearing in pairs. It was hoped that with this division of rhythms it could be found if the regular rhythms are easier to reproduce than rhythms with an irregular order of long and short beats. With both kinds of rhythms the rhythm length was also varied. The number of beats in one rhythm varied between 4, 5 and 6. Previous research has proven that it is more difficult to reproduce longer rhythms. It was hoped that these longer rhythms would help to reveal if there is a real difference in the reproduction between regular and irregular rhythms. The rhythms were selected so that they were as different from each other as possible. All the selected rhythms can be seen in Table 1. In the group of regular 4-beat rhythms there weren’t enough different rhythms so two of the rhythms were repeated twice to match the number of rhythms in the other groups. The letter ‘S’ means a short beat and the letter ‘L’ means a long beat.
Overall difference between the modalities
There were more mistakes with the tactile and visual channel than with the auditory channel. A one-way ANOVA revealed that proportion of wrongly reproduced rhythms differed significantly as a function of different modalities (F(2, 4533) = 31.22, p < 0.00001). The Tukey post-hoc test revealed that differences between every modality were significant (p < 0.05). When rhythms were presented to the user through audio, 7.9% of the rhythms were reproduced incorrectly, while with the tactile channel the equivalent number was 14.0% and with the visual channel 17.5%.
17,5
20,0 14,0
15,0 % 10,0
7,9
5,0 0,0 audio
tactile
visual
modality
Figure 4: Proportion of wrongly reproduced rhythms Table 1: The rhythms used in the experiment
4.2 Irregular rhythms 4 beats 5 beats 6 beats LLLS LSLLL LLLLSL LLSL LLLLS LSLLLS LSLL SLLSL SLLSSL LSLS LLSLS LLSSSL SLSL LSSLS LSLSSL SLSS SSLLS LSSSLS SSLS SSSLS SSSSLS
3.4
Regular rhythms 4 beats 5 beats 6 beats SSSS LSSSS LLSSLL LLSS SSLSS SSLLLL LSSL SSSSL LLLSSL SSLL LLLSS LLSSSS LLLL LLSSL SSLLSS LLSS LSSLL LSSSSL LSSL SSLLL SSLSSL
Collected information
The main goal of the experiment was to find out whether the users were able to perceive the rhythms or not. In this experiment it was decided to reproduce the rhythms by using a mouse button as a piano key. This method was chosen so that the durations of the beats reproduced could be timed. These times were needed for finding out if the reproduced beat times varied depending on the rhythm modality used.
The effect of learning in rhythm reproduction
Differences between the modalities were the largest during the first time of using them. The one-way ANOVA revealed that the proportion of wrongly reproduced rhythms differed significantly as a function of different modalities (F(2, 1509) = 17.88, p < 0.00001). The Tukey post-hoc test revealed that differences between every modality were significant (p < 0.05). When rhythms were presented to the user using audio 12.3% of the reproduced rhythms were incorrect, while with the tactile channel the equivalent number was 21.0% and with the visual channel 27.2%. During the second time of use the proportion of incorrectly reproduced rhythms reduced remarkably. The proportion of errors in reproduced rhythms differed significantly as a function of the different modalities (ANOVA F(2, 1509) = 10.97, p < 0.00005). The difference between the auditory and the tactile modality and the difference between the auditory and the visual modality were significant (Tukey
post-hoc test p < 0.005). The difference between the tactile and the visual modality was not significant (p = 0.346). When the rhythms were presented to the user using audio, 6.3% of the reproduced rhythms were incorrect, while with the tactile channel the equivalent number was 12.7% and with the visual channel 15.5%. During the third time of use the differences in the proportion of errors were really small between the modalities. Proportions of error differed significantly (ANOVA F(2, 1509) = 3.87, p < 0.05). The difference between the auditory and the visual modality was significant (Tukey post-hoc test p < 0.05), but the differences between the tactile and the visual modality (p = 0.687) and between the auditory and the tactile modality were not significant (p = 0.142). When rhythms were presented to the user using audio, 5.2% of the reproduced rhythms were incorrect, while with the tactile channel the equivalent number was 8.3% and with the visual channel 9.7%. Figure 5 represents the learning of perceiving and reproducing the rhythms through the three different modalities during the three times of use. Learning is statistically significant between the first and the second time of use in all the modalities (p < 0.05). There is statistically significant learning between the second and the third time of use only in the visual modality (ANOVA F(2, 1509) = 28.68, p < 0.00001, the Tukey post-hoc (p < 0.05)). In the learning curves it can be seen that the visual and tactile modalities approach each other when more experience is collected. The auditory modality is still the best of the modalities in spite of the learning effect.
the modalities but they were balanced a little bit when the experiment proceeded. In the third time of use, audio got 5.9 and tactile got 4.5 points. The difference between the auditory and tactile modalities was really small. The difference from the result of the visual modality was noticeable. Although the tactile and visual modalities had just 8.3% and 9.7% difference in incorrectly reproduced rhythms (Figure 5), there was a big 4.5 vs. 0.3 difference (Figure 6) in the average of subjective preferences. So the users strongly preferred tactile over the visual modality. Several subjects commented that they kind of “heard” the vibrating rhythm in their heads even though they could not actually hear the sound of the vibrating mouse. One subject even said that the vibrating rhythms were easy to remember because of the muscle memory. It was easy to reproduce the rhythm with the hand when you felt the rhythm with the hand. 10,0 6,2
5,7
5,0
5,9
5,0 3,4
3,1
4,5 2,6 0,3
0,0
audio tactile
avg.
-1,5
-5,0
2 -0,4
1
3
visual
-4,5
-10,0 time of use
Figure 6: Subjective preference of modalities
30,0
27,2
25,0
5
21,0
20,0
15,5
% 15,0
12,3
10,0
12,7 6,3
5,0
9,7 8,3
tactile visual
5,2
0,0 1st
2nd
3rd
time of use
Figure 5: Learning effect in rhythm reproduction between the three modalities
4.3
Differences in reproduction between irregular and regular rhythms
Results of an independent samples t test for means calculated for the proportion of wrongly reproduced rhythms showed that the regular rhythms were significantly easier to reproduce (t=7.2, p