RIM-ONE: An Open Retinal Image Database for Optic Nerve Evaluation F. Fumero1, S. Alayon1, J.L. Sanchez1, J. Sigut1, M. Gonzalez-Hernandez2 1 Dept. of Systems Engineering, University of La Laguna 2 Dept. of Ophthalmology, Hospital Universitario de Canarias
[email protected]
Abstract Automated diagnosis of glaucoma disease has been studied for years. A great amount of research work in this field has been focused on the analysis of retinal fundus images to localize, detect and evaluate the optic disc. An open fundus image database with accurate gold standards of the optic nerve head has been implemented. A variability measurement by zones of the optic disc is also proposed. The relevance of this work is to provide accurate ONH segmentations and a segmentation assessment procedure to allow the design of computerized methods for glaucoma detection.
1. Introduction A retinograph is a retinal photograph useful for the precise tracking of any retinal pathology, especially the glaucoma. Glaucoma refers to a group of diseases that affect the optic nerve and involves a loss of retinal ganglion cells in a characteristic pattern, and frequently associated to an increase of intraocular pressure. If left untreated, glaucoma leads to irreversible damage of the optic nerve and to a loss of the visual field that could originate partial or total blindness. One of the best prevention methods to delay its evolution and avoid vision loss is the regular monitoring of the optic nerve head (ONH) and the visual field to prescribe appropriate treatment. The morphological state of the optic nerve is controlled through direct observation, confocal laser scanning or stereoscopic fundus images (retinographs). However, due to the high number of patients, all these procedures are costly and need high qualified staff. The design of computerized methods for detecting this pathology in its first stages could reduce the cost of the process and the number of required specialists. In the field of medical image processing, accurate ONH segmentations are essential to achieve this aim, and
therefore, several research works have been oriented to this problem [1,2,3]. One of the obstacles within this field is the lack of reference image datasets freely available for groups and/or individual users, in order to evaluate their new methods and applications. In the last years some efforts have been made in this direction and some reference image databases have been proposed for several medical fields: lung nodules images [4], cancer images [5], cardiovascular images [6], Magnetic Resonance images (MRI) [7], among others. In the ophthalmic field reference image databases are scarce and mainly oriented to education more than to the performance evaluation of the segmentation algorithms [8,9]. Few attempts to create reference image database for glaucoma diagnosis have been recently presented [10,11,12]. The main purpose of this work is to offer an ophthalmic reference image database, RIM-ONE, specifically designed for glaucoma diagnosis, not only for medical educational purposes, but also as an evaluation tool for designers of segmentation algorithms. RIM-ONE allows the free download of different fundus images (healthy eyes and eyes with different glaucoma levels), contains gold standards for each image and proposes a common methodology for comparing segmentation results with the gold standard. This reference image database for glaucoma is part of a research project developed in collaboration with three Spanish hospitals: Hospital Universitario de Canarias [13], Hospital Clínico San Carlos [14] and Hospital Universitario Miguel Servet [15]. The aim of the project is the design of an automated software system for supporting glaucoma diagnosis. All the procedures need to start with the automatic delimitation of the ONH and the differentiation of superimposed structures (arteries, vessels, and so on). The creation of this reference image database in collaboration with domain experts of all these hospitals (section 3) and the proposal of an evaluation procedure for every possible ONH segmentation algorithm (section 4) constitute the core of this paper.
2. Related work
3. Glaucoma Image Database
Some databases of retinal fundus images are available online. Two commonly used are STARE project’s [16] and DRIVE database [17]. The first one provides a set of retinal fundus images that have been used in many studies of the retina, e.g. localization and detection of the optic disc or vessels detection. The second one is specialized in vessel extraction and publishes two sets of images, one for training, showing the segmentation of their corresponding vessels network, and one for testing purposes, in which two segmentations of retinal vessels can be observed. Both of them have been referenced in numerous studies [18,19]. ReviewDB [20], from the Retinal Image Analysis Group, is another public database for retinal vessels width estimation. The ONHSD [12], from the same group, is a dataset that contains 100 retinal fundus images and four ONH edges delimited by four clinicians. These images have low resolution and the used segmentation algorithm is part of an automated system for analysis of diabetic retinopathy. Diaretdb0 [21] and diaretdb1 [22] are also related to the development of algorithms for diabetic retinopathies, and they contain some elliptical optic disc segmentations. One database that is explicitly related to glaucoma analysis and research is ORIGA-light [10], containing 650 retinal fundus images, annotated with grading information for diagnosis of glaucoma and with their respective cup and disc manual segmentations, but its web interface does not seem to be publicly available, so requesting author’s permission for downloading the database is necessary. DRIONS-DB [11] is a database that specifically deals with the segmentation of the optic nerve head in retinal fundus images. It has a set of 110 images and 2 ground truths for each one, carried out by 2 medical experts. Regarding the variability measures to compare algorithms for optic disc segmentation, the ratio between the intersection and the union areas of the gold standard and the result of the segmentation is normally used [10,19] as expressed in equation (1).
An online database with retinal fundus images has been developed in order to be a reference for the design of optic nerve head segmentation algorithms. The main differences among all the databases cited in the previous section and the proposed RIM-ONE are the following: RIM-ONE is exclusively focused on ONH segmentation, it has a relatively large amount of high-resolution images (169) and manual reference segmentations of each one (5). This enables the creation of reliable gold standards, thus decreasing the variability among expert segmentations, and the development of high accurate segmentation algorithms. This database is available online at rimone.isaatc.ull.es and it can be used for research and educational purposes, without requesting permission to the authors. It is a reference place for anyone interested in using its images with their own optic disc detection algorithms. Section 3.1 describes the dataset and the provided gold standard, and section 3.2 describes the organization of the database.
Where is the gold standard and the segmentation.
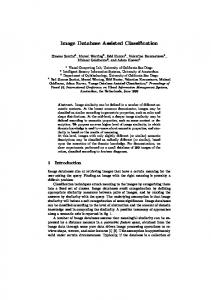
3.1. Dataset and gold standard The designed database is composed of 169 ONH images obtained from 169 full fundus images of different subjects. These retinographs have been captured in the three hospitals cited before which are located in different Spanish regions. Compiling images from different medical sources guarantee the acquisition of a representative and heterogeneous image set. All the retinographs are non mydriatic retinal photographs captured with specific flash intensities, avoiding saturation. The images are classified in different subsets, as domain experts have indicated: • Normal eye (non-glaucomatous): 118 images. • Early glaucoma: 12 images. • Moderate glaucoma: 14 images. • Deep glaucoma: 14 images. • Ocular hypertension (OHT): 11 images. Some images of this database are shown in figure 1.
is the result of
Figure 1. ONH images of RIMONE. Left: normal eye. Right: deep glaucoma
This image set was designed in collaboration with 5 glaucoma domain experts of these hospitals: 4 ophthalmologists and 1 optometrist. They selected the patients (for glaucoma samples) and the volunteers (for healthy eyes samples), the final image set and the associated diagnosis. The study was performed in accordance with the ethical standards laid down in the 1964 Declaration of Helsinki. Approval by the Ethics Committee was obtained and the patients were informed about the study objectives. Additionally, each expert developed manual ONH segmentation in each image (see figure 2). These manual segmentations were subsequently used for establishing the gold standard.
Figure 2. ONH manual segmentations (one different color for each domain expert) The gold standard designed in this work is obtained for each image following these steps: 1. 2. 3.
4.
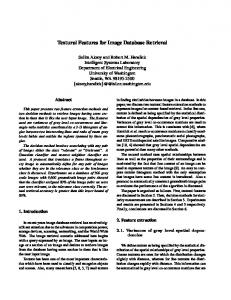
The average centroid of all the contours is computed and established as “reference point”. Axes in directions 1-8 are located from the reference point (see figure 3A). Contour-axis intersections are searched in every direction for the five manual contours. Distances between these intersections and the reference point are computed (in figure 3B, d1 – d5). The average of these five distances in each direction is the “average radius” (in figure 3C, AR1 – AR8). The final gold standard is composed of the reference point and the eight average radii.
The average radii are ordered as follows, regardless of whether it is a right or left eye: superior (AR1), nasal-superior (AR2), nasal (AR3), nasal-inferior (AR4), inferior (AR5), temporal-inferior (AR6), temporal (AR7) and temporal-superior (AR8). Figure 3. Gold standard elaboration: A) reference point and directional axes 18, B) distances measurements, C) gold standard: average radii AR1AR8 and reference point.
3.2. Database organization 1. The database is stored in a zip file, divided in 5 directories, according to the 5 diagnostic categories in which images are classified. These directories are: Normal, Early, Moderate, Deep and OHT. An image belonging to a particular category is placed within the corresponding directory, with its 5 segmentations and a file using comma-separated values, containing the data of its gold standard. Every segmentation is represented by a binary image, i.e. a mask that delimits the ONH according to each expert’s criterion. The CSV files contain the centroid of each gold standard, in pixel coordinates, and the average distance of each radius obtained from the 5 segmentations, as described in the previous section. The name of each image contains a unique number in the whole database, avoiding the appearance of repeated names in distinct categories. Thereby, the names of the ONH images are of the form ImM.bmp, where M goes from 001 to 169. The names of the binary masks corresponding to each image are of the form ImM-expN.bmp, where N means the segmentation of the image M made by the N expert and, thus, goes from 1 to 5. Finally, the name of the CSV file is ImM-gs.csv and that file contains the gold standard data of the image M. The information in a gold standard file is organized in lines. The format of this type of files is: centroid_x, centroid_y AR1 AR2 … AR8
The first line contains the pixel coordinates of the centroid of the gold standard (the “reference point”), where centroid_x is the horizontal coordinate and centroid_y is the vertical coordinate. The average distances of the eight radii, from AR1 to AR8, are stored from the line 2 to the line 9.
4. The proposed evaluation measurement In this section, a variability measurement procedure by zones of the optic disc is proposed. It allows algorithm designers to assess in which parts of the optic disc the algorithm performs well and in which ones it performs badly. As opposed to the usual measure described in section 2, more detailed information is provided. Any user can evaluate the variability between his segmentation results and the proposed gold standard following these instructions:
2.
3. 4.
5.
Locate the reference point of the gold standard in the image that contains the segmentation result to validate. Consider the same eight directional axes. These axes cover regularly the most important zones of the ONH image. Find the intersection points between the segmented border and the eight axes. Calculate the distances between the reference point and these intersection points. These distances are the radii corresponding to the segmentation result to evaluate (R1-R8). Apply equation 2 for obtaining the variability percentage (VP) for each direction between the segmentation result and the gold standard.
The Matlab code for computing this evaluation is available in the RIM-ONE website for free download.
5. Results and discussion The RIM-ONE database contains 169 optic nerve head images. Each image has 5 manual segmentations from ophthalmic experts. A gold standard for each image was created from its corresponding segmentations. The entire database can be downloaded through the web interface at rimone.isaatc.ull.es for research and educational purposes. An evaluation measurement has been proposed to assess the variability between segmentation results and the gold standard of an ONH image. A variability study of the manual segmentations of this database has been made using this equation. Expert manual segmentations were compared with the gold standard for each image. The average results in percentage for each expert are shown in table 1. Table 1. Variability percentage between expert segmentations and gold standards. Expert 1 2 3 4 5 Mean
2.5
4.1
4.3
4.4
3.3
SD
2.4
3.8
2.9
4.8
3.0
Table 2. Average variability percentage for each radius. Radius R1 R2 R3 R4 R5 R6 R7 R8 Mean
3.5
3.7
4.2
3.8
3.8
3.7
4.0
3.3
SD
2.9
3.4
3.8
3.4
3.5
4.0
4.2
3.3
Table 2 shows the mean variability in each radius for all the experts. The smaller variability was found in the upper radii (R1, R2 and R8) and lower radii (R4, R5 and R6). The nasal and temporal zones (R3 and R7) showed the maximum variability, probably because in these zones peripapillary atrophies, areas of pigmentation, etc., that complicate edge detection, appear more frequently.
6. Future Work The authors plan to increase the number of images in the database and the number of manual segmentations. In order to facilitate this task, an online tool for developing manual segmentations in the database will be developed. The collaboration with experts from different countries using this application could also be allowed. Another extension of the website will be the inclusion of a section for recording evaluation results of different ONH segmentation algorithms, using the proposed measurement of the variability. Authors interested in publishing their own results can also upload them to this section.
7. Acknowledgements This research work has been partially financiated by the projects: SolSubC200801000097 of the Agencia Canaria de Investigación, Innovación y Sociedad de la Información and PI09/0601 of the Fondo de Investigación Sanitaria Instituto Carlos III; both with FEDER funds. The authors thank the medical experts from Hospital Universitario de Canarias [13], Hospital Clínico San Carlos [14] and Hospital Universitario Miguel Servet [15] for their invaluable effort in doing the manual segmentations and categorization of the images.
8. References [1] Lowell J., Hunter A., Steel D., Basu A., Ryder R., Fletcher E., Kennedy L., “Optic Nerve Head Segmentation”, IEEE Transactions on Medical Imaging, Vol. 23, No. 2, 2004, pp. 256-264. [2] Chrástek R, Wolf M, Donath K, Niemann H, Paulus D, Hothorn T, Lausen B, Lämmer R, Mardin CY, Michelson G., “Automated segmentation of the optic nerve head for diagnosis of glaucoma”, Med Image Anal., 9(4), 2005, pp. 297-314.
[3] Merickel, M.B., Abràmoff, M.D., Sonka, M., Wu, X., “Segmentation of the Optic Nerve Head Combining Pixel Classification and Graph Search”, Proc. SPIE 6512, 651215 (2007); doi:10.1117/12.710588 [4] Fenimore, C., Armato, S., Aberle, D., Brown, M., Henschke, C., McNitt-Gray, M., MacMahon, H., McLennan, G., Meyer, C.R., Reeves, A.P., Yankelevitz, D.F., “The Lung Image Database Consortium (LIDC) and Image Database Resource Initiative (IDRI): A Completed Reference Database of Lung Nodules on CT Scans”, Medical Physics, Vol. 38, Issue 2, 2011, pp. 915 – 931. [5] Cancer Image Reference Database, http://cir.ncc.go.jp/en/index.html [6] Medical Image Reference Center – Cardiovascular, http://subaru.medirec.ncvc.go.jp/ [7] MedPix – Medical Image Database, http://rad.usuhs.edu/medpix/medpix.html?mode=default [8] EyeText – Global Ophtalmic Community, http://www.eyetext.net [9] Health Education Assets Library, http://www.healcentral.org/ [10] Zhang Z., Yin F.S., Liu J., Wong W.K., Tan N.M., Lee B.H., Cheng J., Wong T.Y., “ORIGA -light : An Online Retinal Fundus Image Database for Glaucoma Analysis and Research”, 32nd Annual International Conference of the IEEE EMBS, 2010. [11] E.J. Carmona, M. Rincón, J. García-Feijoo and J. M. Martínez-de-la-Casa, “Identification of the optic nerve head with genetic algorithms”, Artificial Intelligence in Medicine, Vol. 43(3), 2008, pp. 243-259. [12] Lowell, J., Hunter, A., Steel, D., Ryder, B., Fletcher, E. "Optic Nerve Head Segmentation", IEEE Transactions on Medical Imaging, vol. 23 (2), February 2004, pp. 256-264. [13] Hospital Universitario de Canarias, Tenerife, Spain, http://www.huc.es [14] Hospital Clínico San Carlos, Madrid, Spain, http://www.madrid.org/cs/Satellite?pagename=HospitalClini coSanCarlos/Page/HCLN_home [15] Hospital Universitario Miguel Servet, Zaragoza, Spain, http://sectorzaragozados.salud.aragon.es/index.php/mod.men us/mem.opcionesMenuNivel4/relmenu.93 [16] A. Hoover and M. Goldbaum, “Locating the Optic Nerve in a Retinal Image Using the Fuzzy Convergence of the Blood Vessels”, IEEE Transactions on Medical Imaging, vol. 22, 2003, pp. 951 -958. [17] J. Staal, M.D. Abràmoff, M. Niemeijer, M.A. Viergever, and B. Van Ginneken, “Ridge-based vessel segmentation in
color images of the retina”, IEEE Transactions on Medical Imaging, vol. 23, 2004, pp. 501-509. [18] M. Usman Akram, Aftab Khan, Khalid Iqbal, Wasi Butt, “Retinal Images: Optic Disk Localization and Detection”, Image Analysis and Recognition, vol. 6112, 2010, pp. 40-49. [19] C.A. Lupascu, D. Tegolo, and L.D. Rosa, “Automated Detection of Optic Disc Location in Retinal Images,” 21st IEEE International Symposium on Computer-Based Medical Systems, 2008, pp. 17-22. [20] B. Al-Diri, A. Hunter, D. Steel, M. Habib, T. Hudaib, and S. Berry, “REVIEW - a reference data set for retinal
vessel profiles”, Conference Proceedings of the International Conference of IEEE Engineering in Medicine and Biology Society, vol. 2008, 2008, pp. 2262-2265. [21] Kauppi, T., Kalesnykiene, V., Kamarainen, J.-K., Lensu, L., Sorri, I., Uusitalo, H., Kälviäinen, H., Pietilä, J., “DIARETDB0: Evaluation Database and Methodology for Diabetic Retinopathy Algorithms”, Technical report, 2006. [22] Kauppi, T., Kalesnykiene, V., Kamarainen, J.-K., Lensu, L., Sorri, I., Raninen A., Voutilainen R., Uusitalo, H., Kälviäinen, H., Pietilä, J., “DIARETDB1 diabetic retinopathy database and evaluation protocol”, Technical report, 2007.