Abdel-Kader, M. and Kuang, Y. (2007), Risk-adjusted performance, selectivity, timing ability and performance persistence of Hong Kong mutual funds, Journal of Asia-Pacific Business, Vol. 8, No. 2, pp. 25-58. ISSN: 1059-9231. doi:10.1300/J098v08n02_03. Definitive version available online at: https://www.haworthpress.com/store/product.asp?sid=T7RL7GD2WE3F9N14LBP4UJER6E9N2W9D&sku=J098
Risk-Adjusted Performance, Selectivity, Timing Ability and Performance Persistence of Hong Kong Mutual Funds Magdy Abdel-Kader Brunel Business School, Brunel University, Uxbridge, Middlesex, UB8 3PH, UK (Corresponding author) Email:
[email protected] Kuang Yuan Qing RM 402, Building 1, Street 2, Shatou, Xi'nan, Shanshui, Foshan, Guangdong 528100, PR China
ABSTRACT. This paper examines the performance of thirty Hong Kong mutual funds during the period from August 1995 to July 2005. The issues of risk-adjusted performance, selectivity, timing ability and performance persistence are addressed. We employ the signal-factor model, three-factor models and the measurements of Jensen’s alpha and Treynor ratio to evaluate the weekly returns on the sample funds relative to the performance of the Hong Kong market benchmark. Treynor and Mazuy (1966)’s quadratic model is used for assessing selectivity and timing ability of fund managers. Performance persistence of Hong Kong mutual funds is assessed at successive two-year intervals based on their ranking according to both Jensen measure and Treynor measure. Evidence of underperformance of Hong Kong mutual funds relative to the market is found. No significant selectivity and timing ability are shown in the results of the actively managed mutual funds. Persistence is identified for the performance of both winners and losers in the short run. KEYWORDS. Mutual Fund, Hong Kong, Performance persistence, Risk-adjusted performance.
INTRODUCTION Mutual fund is an investment intermediary that is defined as “pools of money that are managed by an investment company” (Harvey, 1997). It embodies the simple idea of portfolio diversification and has been a huge success since it was first introduced to the financial market. Just as Gruber (1996) concluded, investors keep “pouring money” into mutual fund investment, desiring to enjoy the benefits of “shareholder services, low transaction cost, portfolio diversification and professional management” provided by investment companies. In Hong Kong, the net asset value of authorized unit trusts and mutual funds has been grown up to US$550 billion at the end of 2004 (Hong Kong Securities and Futures Commission, 2004). As one of the most important financial investment centers in
Asia, Hong Kong aims to create quality environment for global fund managers and investors. Since Jensen (1968) the research in mutual fund performance has increased significantly during the last 30 years. There are overwhelming studies that have addressed the issues of mutual fund performance relative to the market portfolio, selection and timing abilities of fund managers and performance persistence in the US and the UK. Furthermore, similar studies on mutual fund performance have been conducted in European countries (e.g., Dermine & Röller (1992) in France, Wittrock & Steiner (1995) in Germany, Ter Horst et al. (1998) in Netherlands, Dahlquist et al. (2000) in Switzerland, Casarin et al (2001) in Italy, and Christensen (2003) in Danmark) and Cai et al (1997) in Japan. Generally, the literature has come to the consensus that managed mutual funds exhibit underperformance relative to the market or the passive index mutual funds. Although evidence of fund managers’ superior skills has been found in some cases, the value added by these skills hardly outweighs the fund expenses and fees. In other words, the evidence indicates that most of the markets addressed in previous research are considered to be efficient and accordingly both professional and non-professional investors are informationally equal. In Hong Kong, despite the dramatic increase in market value of the mutual fund industry, there have only been limited analyses of mutual fund performance and most of them are undertaken by the mutual funds themselves or by the Hong Kong Investment Funds Association. The aim of this study is to provide independent insights and analysis of Hong Kong mutual fund performance in term of the risk-adjusted performance relative to the benchmarks, selectivity and timing ability and performance persistence. The sample of this study includes 30 funds grouped into money market funds, fixed income funds, balanced funds, growth funds and index funds during the period from August 1995 to July 2005. This paper aims to evaluate the risk-adjusted performance of the sample funds relative to the Hong Kong market benchmarks like Hang Kong Hang Seng Index based on the Capital Asset Pricing Model (CAPM) and Fama and French’s (1992) three-factor model, estimating the asset selection skills which is reflected by the excess returns of the underlying portfolios and the timing skills which is captured by the coefficient of the quadratic term in Treynor and Mazuy (1966)’s model. In additional, the performance of the sample funds is evaluated on a historical basis to assess its performance persistence. The reminder of this paper is organized in five sections. The next section illustrates the development of Hong Kong mutual fund industry. This is followed by literature review for mutual fund performance measurement. The explanation of research methods and methodology is in the fourth section. Empirical results are shown in the fifth section. The final section sets out some conclusions MUTUAL FUND INDUSTRY IN HONG KONG The original idea of investment diversification was fulfilled as the first official mutual fund was created by three Boston securities executives who pooled their money together for investment purpose in 1924. Since then the mutual fund investment activities have become 1
one of the most heated issues in the financial framework. At the same time, the mutual fund industry has experienced a massive boom during the last 80 years around the world. According to Khorana, Servaes and Tufano’s (2005) study, the mutual fund industry holds 17% of 56 countries’ primary financial assets on average which worth US$11.7 trillion up to 2001. For example, Bogle (2003) concluded that the mutual funds are “far bigger, more varied, and more numerous” in the US, UK, France, Luxembourg, Ireland, Japan, Canada, Hong Kong, Singapore and many other countries and regions. Luxembourg and Ireland were found to have the largest fund industries relative to the size of their economies as a result of the stringent bank secrecy laws and the favourable tax treatment of fund management companies respectively. Also, demand-side, supply-side, and legal and regulatory factors were found to contribute to the development of the industry in different countries. The size of the equity fund industry was reported to be positively related to the enforcement of insider trading laws, the domestic per capita GDP and investors’ wealth and education. On the other hand, barriers to entry and higher trading costs were found to have negative effect on the growth of fund industry. Development of the Mutual Fund Industry in Hong Kong In 1969, the Overseas Investment Fund was offered by a British merchant bank to the public as the first mutual fund in Hong Kong. As the asset management companies from the US and Japan entered the market in the 1970s and 1980s, the Hong Kong mutual fund market was established and flourished. The demand of investment advice and professional service increased rapidly as the result of the booming macro-economic environment and the improvement of regulations in the 1990s. Then the Mandatory Provident Fund (MPF) scheme which delivers the obligation of establishing provident funds for their staff to the employers was introduced in 2000. It significantly increases the population of investors of unit trusts/mutual funds and low risk capital preservation products in Hong Kong. With the 8th world’s largest capitalization in the equity market, Hong Kong is, following Japan, the second largest fund management centre in Asia and the place where gathers the largest number of fund managers. It is reported by the Hong Kong Investment Funds Association in 2005 that the gross sales for the fund industry in 2004 has reached US$20,337 million with registered inflows of US$2,640.02 million. The total fund assets in the Hong Kong market has raised from US$342,134 million in 2002 to US$534,288 million in 2003 with the increase rate of 56.16%. The industry, see Tables 2 and 3, has experienced remarkable growth in the last decade and shown significant resilience and buoyancy during the Asian regional economics crisis in 1998. Yet, it is also reported that the dramatic rise by 58% in authorized funds in 1999 is followed by the falls of 16%, 17% and 17.4% from 2000 to 2002 respectively. However, the total number and value of authorized mutual funds still increased in a row. The Hong Kong mutual fund industry is highly market-driven compared with other Asian countries. The government hardly engages in the fund business except for the establishment of regulations. Being known for its transparency of information, freedom of cash flows, high
2
liquidity, and mature regulations, Hong Kong has been ranked as the world’s freest economy for the 12th consecutive year by the Heritage Foundation1. Its mutual fund industry, therefore, is dominated by international firms which have relatively limited potential for growth in their own countries and are eager to look elsewhere for growth. A survey2 from the Securities and Futures Commission (SFC) shows that 63% of the Hong Kong fund industry was sourced from outside Hong Kong and 77% of the assets were invested outside Hong Kong at the end of 2003. Legislation of Mutual Fund Market in Hong Kong Hong Kong market is known for its mature regulatory environment with international fund managers and investors. Its mutual fund market follows the British customs and regulations in general. The Hong Kong government, aiming to protect the interests of domestic and overseas fund managers and individual investors, has published a series of regulations and rules about fund market operation. According to Hong Kong Investment Funds Association (see Xiaorong, no date): 1) Securities Ordinance creates Securities and Futures Commission, the authorized supervisor of the fund market in Hong Kong. The Unit Trust Fund Committee, which is the sub-committee of the Commission, manages the market on behalf of the Commission. 2) Hong Kong's Unit Trust Association, working as a fund trade organization, is in charge of the supervision of the fund market daily operation. The Unit Trust Fund Association Code, as self regulatory rules, plays a role of self regulation. 3) The Unit Trust and Mutual Fund Code regulates the fund's inner structure, the duty of subject and operation of the market which leads to the direction for the funds to be recognized by the Commission. 4) Trustee Ordinance establishes the operational requirement for fund trustees. 5) Protection of Investors Ordinance arranges the requirement for funds' propaganda and expansion. In addition, funds, as a kind of securities, shall obey security-related regulations in Hong Kong. Hong Kong's mutual funds are allowed to invest in stock markets, bond markets, foreign currency markets, futures markets and futures option markets, currency markets and expensive metal markets. As to risk controlling, there are some limitations on investment proportion of general funds (such as equity and money market funds) and special funds (such as umbrella fund, the fund among funds) in Hong Kong. Mutual Fund Management in Hong Kong A fund manager makes investment decisions on behalf of investors who finance the portfolio, and thus, plays a crucial role in the performance of the portfolio (Harrison, 2003). 2006 Index of Economic Freedom, http://www.heritage.org/research/features/index/downloads.cfm, Accessed on 16 February 2006 2 Profiles of Hong Kong Major Service Industries: Fund Management, 2005. 1
3
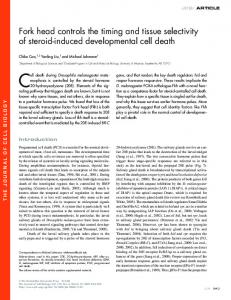
Generally, mutual fund management in Hong Kong is characterized by its international and offshore nature. According to a research (Harrison, 2003) from the Hong Kong Exchange in 2002, Hong Kong is attractive to global fund managers due to its “quality of communications, supporting infrastructure and business, legal and accounting services, low tax rates and a clear tax regime”. At the same time, the competition among fund managers is inevitably fierce since most of the fund managers registered in the Hong Kong market are international, competitive, skillful and experienced. It is reported that 41% of its fund managers were domiciled in Hong Kong, 24% in the UK, 10% in Luxembourg, 10% in the US, and 6% in Ireland. Many top overseas asset management company such as Oppenheimer Funds, Inc. choose Hong Kong as their first overseas office. More than 80 international fund houses from the US, UK, Japan, Singapore, Switzerland, France and other countries and regions have operations in Hong Kong1 As a small region with the population of seven million, Hong Kong illustrates strong potential in investment management with the assets under management of US$190 billion up to 2001 (Fig. 1). The Hong Kong Securities and Futures Commission reported that this figure surged 80% from 2002 to 2003. In 2005, it is reported that the value of assets under management in Hong Kong has grown up to US$400 billion. Meanwhile, Hong Kong fund managers have focused their attention on the mainland China market since it will open up its entire fund business in the near future according to the agreement with the World Trade Organization (WTO). Due to the geographical advantages, developed expertise and superior management skills, the Hong Kong fund management will, undoubtedly, becomes the major backup of mainland’s fund industry in future. Therefore, it will be a golden opportunity for the flourish of the Hong Kong's fund industry as the investing enthusiasm from the mainland market is realized. On the other hand, it was announced in 2004 by the "Temporary Measures on Overseas Use of Foreign Exchange Insurance Funds" that qualified Mainland insurance companies were allowed to invest 80% of their remaining foreign exchange insurance funds in the previous year. Mutual fund is also the most common investment instrument for insurance funds due to its diversification and professional management. In other words, the insurance industry in mainland China, with the total assets exceeded RMB 1,000 billion in 2004, will create an extraordinary opportunity for the Hong Kong fund management industry. It is commented by Mr. Frederick Ma, the Secretary for Hong Kong Financial Services and the Treasury, that In recent years, Mainland's economy has been growing rapidly which results in the 1
Fund Management Activities Survey 2003 conducted by the Securities and Futures Commission (SFC) (“Investment Fund Management” 2004, http://www.lowtax.net/lowtax/html/hongkong/jhkinv.html.
4
keen demand for investment products and talents in the financial sector. On top of this, the Mainland Government has started to introduce policies with a view to seeking investment opportunities overseas, these all add up to bring unprecedented opportunities to Hong Kong's development as Mainland's preferred asset management and capital formation centre. (Speech by SFST, February 23, 2005, Press Release) Mutual Fund Income, Tax and Fees in Hong Kong Investors are expected to gain income including share dividend, interest, and capital appreciation when they invest in mutual funds. Basically, the expenses involved in mutual fund investment include annual management and distribution fee and sales fees consisting of initial and deferred fees. They play an important role in the sales and performance of mutual funds. There is some literature that has found good performance of mutual funds compared with the market but not after fees. This theoretically implies that the value added by the profession management is insignificant if the abnormal returns fail to cover the fund fees. In Hong Kong, it is regulated that “investors shall pay 5% of the value of the fund invested as initial fee when they apply for purchasing funds; and they shall pay 1% of their investment value to the manager as managerial fee”1. These ratios are slightly different across funds in different sectors. Investors do not pay trading fee when they sell fund units. In addition, since the long term investment of mutual funds contributes to the stabilization of the financial market, it is usually free from taxation in most countries. Therefore, there is no trading tax or revenue stamp on Hong Kong mutual fund investment. In general, the Hong Kong mutual fund market is widely evaluated as a developed mutual fund centre with sound legal and economic framework, efficient financial supervision, quality suppliers and attractive opportunities. These external and internal advantages have made the Hong Kong fund market a good choice for performance measurement with a variety of observable and testable parameters. LITERATURE REVIEW The choice of an appropriate measurement model for the evaluation of mutual funds performance has been a controversial issue during the last 50 years. The basic performance measurement techniques including the Jensen (1968)’s Alpha, the Sharp (1966) Ratio, the Tracking Error, the Treynor (1966) Ratio and the Treynor-Black (1973) Ratio have been widely applied and examined in terms of their statistical significance, interpretational fitness and sensitivity. Based on these measurement techniques, various advanced models have been developed to pursue more precise estimation of mutual fund performance. The contribution of studies in the US market is remarkable in terms of its generalization and applicability. Basically, the models can be classified into unconditional models, which do not take into account the rearrangement of the fund composition and conditional models, which reflect the time-varying characteristics of the fund performance.
Fund Investment: Your Questions Answered by Hong Kong Investment Funds Association. (http://www.hkifa.org.hk/eng/index.aspx). 1
5
Empirical studies on mutual fund performance have made remarkable and inspirational contributions to our understanding of this particular investment sector. The profitability of mutual funds, which are characterized by the professional management, is of interest for both proponents and opponents of the market efficiency theory, which assumes that both rational and irrational traders are unable to make abnormal profits consistently by using the same information in an efficient market. Derived from this hypothesis, the literature mainly focuses on some controversial issues of fund performance such as whether mutual funds outperform the market, whether fund managers have superior timing and selecting abilities, whether active management adds value, whether mutual funds perform persistently and whether actively managed funds outperform the index funds. Empirical Studies and Results in the US US Empirical studies initially concentrate on the fund performance relative to that of the market portfolio which is unbeatable according to the Efficient Market Hypothesis (EMH)1. Jensen used the signal-factor CAPM and Jensen’s Alpha to assess the performance of 115 US mutual funds during 1945 to 1964 and reported negative Jensen’s alpha which showed that the underlying sample of funds underperformed the market on average in his study in 1968. This result backed the findings of Treynor (1965) and Sharpe (1966) with supporting evidence of the notion of informational equality and the theory of market efficiency. Generally, literature has come to a conclusion that mutual funds under-perform the market on average. However, this conclusion was challenged by some researchers in the 1990s when contrary evidence was found. Ippolito (1993) identified expense-adjusted abnormal returns from mutual funds relative to the market index which implies fund managers might have access to useful private information. This result has been confirmed by Wermers (2000) who suggested the existence of timing and selection abilities of fund managers. Moreover, Grinblatt and Titman (1992) and Goetzmann and Ibbotson (1994) further provide unfavorable evidence of the EMH by presenting empirical evidence of positive performance persistence among mutual funds. However, other researchers, like Elton, Gruber, Das and Hlavka (1993), Malkiel (1995) and Carhart (1997), managed to provide new evidence to back up the original conclusions drawn by Jensen (1968). More recently, with the rapid development of index funds which are constructed in proportion of the market portfolio and aim to track the performance of some benchmarks, the discussion has been extended to the comparison between actively managed funds and index funds. It is argued that active management adds value only if the funds under such management outperform the index funds on average. Generally, the value of active management is found unfavorable in most of the empirical studies. For example, Gruber (1996) found that the average mutual fund underperforms passive market indexes by about 65 basis points per year during 1985 to1994. Carhart (1997) presented a negative relation 1
Fama (1970) defines an informationally efficient stock market as one where share prices fully and instantaneously reflect the available information. 6
between net returns and expense levels which are generally much higher for actively managed funds. He also found that the fund’s benchmark-adjusted net return decreased as the number of trades conducted by fund managers increases. Basically, these studies suggested that investors are more possible to profit by buying index funds than actively managed funds. But different conclusion was drawn by Wermers (2000) who found higher net returns on actively managed funds than on the Vanguard 500 Index Fund. Additionally, researchers have reached contradictory conclusions regarding whether mutual funds could consistently outperform the market under the professional management from fund managers. This is still an open issue which can generate very different results in different markets under different circumstances. Researchers are also interested in the factors that could contribute to the performance of mutual funds in various empirical studies. Sharpe (1966) identified a negative relation between fund expenses and its performance respectively. While Ippolito (1989), on the other hand, suggested no significant relationship between the expenses-adjusted fund performance and their turnovers and investment fees. Friend, Blume and Crockett (1970) illustrated that the portfolio turnover was positively related to its performance. But Malkiel (1993, 1995) and Carhart (1997) argued that fund returns are negatively impacted by its turnover and total expenses. Finally, Wermers (2000) decomposed the mutual fund performance into stock-picking talent, style, transactions costs, and expenses by employing the characteristic selectivity measure, the characteristic timing measure, the average style measure, and the Carhart (1997) Measure. Furthermore, the renovation of performance measurement for mutual funds has motivated researchers to emphasise the minimization of estimation errors in terms of eliminating survivorship bias and choosing the appropriate benchmark. By removing the survivorship bias and correcting the misspecification of benchmark, Malkiel (1995) argued that the results of prior studies suggesting performance persistency are biased. He found evidence of performance persistence during the 1970s, but not in the 1980s. Grinblatt and Titman (1994) and Elton, Gruber and Blake (1996) also examined the survivorship issue in previous studies and found the overstatement of performance persistence as well. Elton et al (1993), on the other hand, challenged Ippolito’s (1993) findings by identifying the benchmark error. Then similar errors have been identified and clarified in the studies of Lehman and Modest (1987), Grinblatt and Titman (1989), Malkiel (1995), Carhart (1997) in succession. Empirical Studies and Results in the UK In comparison with the overwhelming US literature of mutual fund performance, the UK empirical studies are less developed, less numerous and relatively limited. Although relevant UK empirical studies started only in the late 1990s, they have, benefited from the existing US findings, witnessed improvements in terms of research samples and periods, comprehensiveness of related issues and accuracy of results. The performance of fund managers is also mostly evaluated by relating the fund returns to the market portfolio in UK empirical studies. Quigley and Sinquefield (1999) employed the 7
bid/offer spread and Fama and French’s three-factor model to examine 752 funds of growth stocks, income stocks, general equity and smaller companies and found poor performance of –0.09 basis points per month relative to the FTA All Share Index. Another comprehensive research is done by Blake and Timmerman (1998) who used a sample of 973 dead and 1,402 surviving funds including domestic and international equities, bonds, property and commodities and reported underperformance of about 0.15 basis points per month for the average risk-adjusted returns on UK equity funds. These results are basically consistent with the major findings in the US. Performance persistence of mutual funds is one of the most studied issues in the UK studies. It is first addressed by Fletcher (1997) who examined the performance of a random sample of 101 UK unit trusts and employed the strategy that was based on the past fund performance. Eventually, no significant abnormal returns were made and it was concluded that no evidence of performance persistence was identified. While Blake and Timmerman (1998) employed a large sample of 2375 unit trusts and presented slight evidence of performance persistence among both top performers and bottom performers. Quigley and Sinquefield (1999) found supporting evidence of persistence merely for poor performers who had invested in smaller companies. WM Company (1999) also examined the performance persistence of active and passive funds and concluded that good performance did not repeat in the top 25% funds. Rhodes (2000) illustrated that growth and income funds did not perform persistently in the long term. In general, it is argued that managed funds in the UK under-perform the market. The evidence of performance persistence among top performers is small and slight while that among bottom performers is stronger and clear. It is implicated that investors are empirically supported to avoid some poor performers rather than to select some top performers. This paper focuses on the issues of risk-adjusted performance, selectivity and timing ability of fund managers and the performance persistence. We are interested in the returns on Hong Kong mutual funds relative to the market portfolio, the existence of superior investment skills of fund managers and predictive power of the historical performance. Jensen’s (1968) method of evaluating mutual fund performance, Treynor and Mazuy’s (1966) model of assessing selectivity and timing ability and Goetzmann and Ibbotson’s (1994) methodology for performance persistence estimation are employed in this paper. METHODS AND MATERIALS In this paper we apply both Jensen’s alpha and Fama and French’s three-factor model to assess the risk-adjusted performance, the selectivity and market timing and the performance persistence of Hong Kong mutual funds. Measure and Model Jensen’s (1968) employs the single-index CAPM which relates the return on the portfolio to its risk indicated by the beta factor for the risk-adjusted performance measurement. The estimation of the intercept explains the forecasting abilities while the beta factor capture the systematic risk involved. It is the classic model for performance measurement in modern 8
portfolio management theory. Its theoretical value has been proved in various empirical studies over time. In this study, we apply it as the basic measuring model and state it as1: Rit – Rft = αi1 + βi01 (Rmt – Rft) + εit
(1)
where Rit is the return of the underlying portfolio in week t, Rft is Hong Kong one-week domestic interest rate, and Rmt is the total return of the Hong Kong Hang Seng Index in week t. However, according to Drew and Veeraraghavan’s (2001) study on asset pricing in Asian regions, evidence is found that small stocks generate higher returns than big stocks and equity stocks with high book-to-market value generate higher returns than those with low book-to-market value in the Hong Kong market. It is implied that the risk premia associated with these aspects is missing from the CAPM and ought to be captured by Fama and French (1993)’s three-factor model which takes into account the size effect and the book-to-market value effect. Therefore, we will also employ Fama and French’s three-factor unconditional model to evaluate the performance of the sample of Hong Kong mutual funds. It is stated as: Rit – Rft = αi3 + βi03 (Rmt – Rft) + βi13 SMBt + βi23 HMLt + εit
(2)
where SMBt denotes the size factor which reflects the difference between the returns on small stocks and the returns on big stocks. It is calculated, in this case, by the weekly return of the Hong Kong Small Cap Index minus the weekly return of the Hong Kong Large Cap Index. HMLt is a book-to-market-value factor which measures the difference between the returns on stocks with high book-to-market ratios and stocks with low book-to-market ratios. It is calculated by the weekly return of the top 30% of stocks ranked by book-to-market minus the bottom 30% of stocks ranked by book-to-market ratio. It should be noted that all indices in (1) and (2) are formed as portfolios with zero investment. It implies that the time series regression of a random portfolio in the sample against the indices should yield zero intercept. As to the basic performance measure techniques, Friend and Blume (1970) argue that Jensen’s alpha and Treynor ratio have an obvious merit compared to the Sharpe ratio which is that they are applicable to both efficient2 and inefficient portfolios while the Sharpe ratio fails to explain inefficient portfolios. Furthermore, it is appropriate to apply Jensen’s alpha and Treynor ratio to the measure of mutual fund performance because mutual fund portfolios are well diversified whose risk approximates to the systematic risk. Christensen (2003) provides the reasons why Jensen’s alpha is considered to be superior 1
Equation (1) is a single-period model whose estimations should be obtained under the hypothesis of heterogeneous investment horizons of investors. Furthermore, the return observations are assumed to be independently and identically distributed over time and jointly normally distributed. 2 An Efficient portfolio is the one whose combination of return and risk falls on the efficient frontier, providing the greatest expected return for a given level of standard deviation, or equivalently, the lowest risk for a given expected return. 9
to the Sharpe measure and the Treynor measure in his empirical research. First, Jensen’s alpha is based on linear regression technique, which furthermore provides us with estimation of statistical significance. Second, being different from the Sharpe and Treynor measures, Jensen’s alpha is a risk-adjusted excess return expressed in percentage points rather than ratio and thus makes better sense in the interpretation of the results. Third, a benchmark is involved in the Jensen’s measure, enhancing the explanation power. Finally, risk-free rate is time-varying in the Jensen measure but constant in the other two. Therefore, we employ Jensen’ alpha and Treynor ratio to assess the risk-adjusted performance of the underlying portfolios in this paper. Based on the CAPM, the traditional measure, Jensen’ Alpha, is represented as: αi1= Rit – Rft – βi1 (Rmt – Rft)
(3)
And the Treynor ratio, which is also based on the liner regression technique, is stated as follow: T = ( Ri – Rf ) / β
(4)
where β is the coefficient of the excess return on the market portfolio. As can be seen from the results in the next section, the three-factor model does a better job in describing the data statistically in this case and thus we will base our conclusions on the multi-factor estimations. However, the performance measure in this paper is unavoidably subject to the limitations of Jensen and Treynor measures. Data The data sample used in this study is mainly obtained from the database supplied by Morningstar Asia Ltd. and Datastream systems, Inc. We compared the samples of Hong Kong mutual funds from the two databases and selected the funds whose static and dynamic materials are consistent and matched. A thirty-fund sample is finally formed including 4 money market funds, 5 income funds, 3 balanced funds, 8 growth funds and 10 index funds. For each fund, the databases supply the daily, weekly, monthly and annually price index, total return index and fund age. In order to improve the exactitude of the findings, we employ the weekly returns to examine the risk-adjusted performance of these mutual funds from August 1995 to July 2005 with 518 observations. The mutual funds are grouped according to their investment objective. Panel A of Table 3 gives an overview of mutual funds in the sample listed by category. In order to reflect contributions of Hong Kong mutual funds from different sectors, we form an equal-weighted portfolio using the sample funds to detect their gross performance. The closing bid price of each component fund is used to compute the returns as follow according to explanation from the database:
(5) 10
where RIt denotes the return index on day t; RIt-1 is the return index on previous day; PIt is the price index on day t; PIt-1 is the price index on previous day; DYt denotes the dividend yield % on day t; N is the number of working days in the year (taken to be 260). Descriptive Statistics of the time series of mutual fund returns are presented in Panel B of Table 3. The time series of balanced funds and index funds are found slightly biased at the 5% level of significance while those of others and the all-fund returns are statistically unbiased. In this paper, we employ the Hong Kong Hang Seng Index, which represents about 70% of capitalization of the Hong Kong Stock Exchange, as the benchmark for the evaluation of mutual fund performance. The dynamic nature and cross correlations of the benchmark returns are shown in Panel C of Table 3. The market returns are negatively correlated with the size factor with the cross correlations of -0.0832 and positively correlated with the high-minus-low book-to-market value factor with a higher cross correlations of 0.1765. Basically, the cross correlations of the three benchmarks are not obvious in the Hong Kong market. Methodology We are interested in the risk-adjusted performance of mutual funds of different categories relative to the Hong Kong market and mutual fund managers’ timing and selection abilities which would be more obvious, if exist, for actively managed funds. The former can be evaluated by equation (1) and (6) and measured by Jensen’s Alpha and the Treynor ratio of the equal-weighted portfolio formed by the sample funds during the sample period based on the dynamic time series observed. Mutual fund mangers’ timing and selection abilities will be evaluated simultaneously by employing the regression technique proposed by Treynor and Mazuy (1966). They suggested that the timing ability should be evaluated by coefficient of the quadratic term of excess return on the market portfolio because good market timing should be especially reflected by positive performance when prices are extremely high or low. Here we will focus on the actively managed funds in the sample to specifically assess the value of the so-called professional management of fund managers in Hong Kong, which is embodied by their selectivity and timing ability. According to the original quadratic model, we regress the weekly returns on the equal-weighted portfolio of the actively managed mutual funds on the excess returns of the market portfolio and the squared excess returns on the market portfolio as: Rit – Rft = αi* + βi0* (Rmt – Rft) + βi1* (Rmt – Rft) 2 + εit
(6)
The intercept of the quadratic regression αi* captures the selection ability of fund managers, indicating the abnormal return earned by the portfolio under the management while the coefficient of the squared term βi1 * captures the timing ability of the fund managers which should be positive when the superior market timing exists. In addition, we perform the evaluation of performance persistence for Hong Kong mutual 11
funds according to Goetzmann and Ibbotson (1994)’s methodology in their study on persistence in performance of US mutual funds. We use both Jensen’s Alpha and Treynor ratio to assess the performance of each sample fund over successive two-year intervals from 2002 to 2005 and rank them according to their performance during each period. Then we define the winners as the top 50% of the sample funds and the losers as the bottom 50% of the sample funds and obtain the number of persistent winners and losers. The methodology is based on the short-term performance measurement and aims to give some insights of the value of the ranking provided by various investment advisers. EMPIRICAL EVIDENCE As stated earlier both the Risk-adjusted Performance of the sample portfolios and evaluation of selectivity and timing ability of fund managers are reported on the basis of the regression technique but associated with linear and quadratic models respectively. The examination of persistence in performance is interpreted by the ranking and justified in a relative rather than absolute manner. Risk-adjusted Performance of Hong Kong Mutual Funds Modern portfolio theory suggests that investment choices are made on the basis of expected return and risk of the underlying portfolio. The risk-adjusted performance measurement of mutual funds gives a straightforward insight of the investment outcomes involved in mutual funds. The test of risk-adjusted performance is performed employing the historical observations of returns and variations. In this study, we run the single-factor model for six different portfolios that are formed by mutual funds from different categories and use the Jensen’s alpha and the Treynor ratio to detect their risk-adjusted performance. As can be seen from the statistical results in Panel A of Table 4, significant negative Jensen’s alphas are found for the money market funds, fixed income funds, balanced funds and growth funds, implicating the actively managed funds under-perform the market in general. The intercept of the regression of excess return of index funds on that of the benchmark is not significantly different from zero, implying that the sample index funds did a good job in tracking the performance of the benchmark. Finally, underperformance of the all-fund portfolio is found to be significant with the Jensen’ alpha of -0.0159 and explanatory power of about 73%. This implicates that the sample funds generally yield lower returns than the market. This shows that the mutual funds that initially aim to provide capital appreciation with better reward than the market generally fail to keep their promise. The finding is consistent with the conclusion drawn by Jensen (1968), Malkiel (1995), Gruber (1996) and Carhart (1997) who have also identified underperformance of mutual funds relative to the market portfolios. In order to reduce the estimation biases caused by the sampling, we further perform the risk-adjusted measure of return based on systematic risk which is embodied by the Treynor ratio. The results shown in Panel B of Table 4 indicate that positive reward for risk is found for balanced funds, growth funds and index funds during the sample period. Index funds performed best with the highest Treynor ratio of 0.0039 while the money market funds are found to provide the worst performance in all of the categories of mutual funds which the 12
lowest Treynor ratio of -0.0417. Fama and French (1993), based on the CAPM, find that two more variables – the stock’s size and the ratio of the book value to market value of the equity – capture much of the cross-section of average stock returns. The three-factor model is then formed for the performance measurement of managed portfolios which is stated as Equation (2). To reinforce the explanation power of the measure, we further look into the results generated by the Fama and French (1993)’s three-factor model in Panel C. Larger alphas are identified by the model for all categories, implying that the performance of the mutual funds are underestimated by the CAPM. However, the conclusion of underperformance of sample funds relative to the benchmarks is confirmed by this three-factor regression. The excess returns of the all-fund portfolio are found to be significantly related to the SMB benchmark at both 5% and 10% levels of significance. The performance of SMB benchmark also positively contributes to the performance of the money market funds, balanced funds, growth funds and index funds. On the other hand, the performance of the HML benchmark only found to have significant negative relations with the performance of the balanced funds, growth funds and index funds. As can be seen from the fit of the model for the sample funds, the three-factor model does a better job than the CAPM to explain the mutual fund performance in Hong Kong. Selectivity and Timing Ability of Fund Managers Estimated by the Quadratic Model Selectivity is the ability of fund manager to detect the assets whose value is underestimated by the market and act accordingly. Market timing is a form of active management performed by the fund manager who holds a portfolio with a relatively high beta during a market rise and a relatively low beta during market decline. Superior timing ability helps to generate abnormal returns when the market price deviates from its true value. Treynor and Mazuy (1966) are among those who first decompose the total performance of mutual funds into market timing and selectivity. They point out that the linear regression of the excess returns on the mutual fund on the excess returns on market portfolio holds true only if the beta factor is constant over time. In other words, the linear relationship is inappropriate for describing the performance of portfolio which is managed according to the time-vary systematic information. They propose the quadratic model stated as Equation (6) to further separate the timing ability and selectivity. If fund managers are good at market timing, the fund will outperform benchmark for extreme market returns and near the market for market returns that are close to zero. Therefore, the coefficient of the squared excess return on the benchmark captures the timing ability of fund managers while the alpha of the quadratic regression captures the selectivity shown by fund managers when they make use of the security-specific information. Since the timing abilities and selectivity are only expected for actively managed mutual funds which aim to generate higher returns than the market portfolio, we focus on the non-index funds only in this evaluation. In other words, only money market funds, fixed Income funds, balanced funds and growth funds are considered here. 13
As can be seen from Table 5, the Treynor and Mazuy model does a good job in explaining the selectivity and timing ability of fund managers for money market funds, fixed income funds and balanced funds with reasonable t-statistics. The results support the conclusion that, on average, active managers have limited stock selection abilities with negative intercept of -0.0164. It is also true for the portfolios classified by investment objective. Further ability of market timing for the sample funds under active management is shown by the following estimated equation1: Rit – Rft = – 0.0164 + 0.5285 (Rmt – Rft) – 0.3794 (Rmt – Rft) 2 + eit
(7)
Poor timing ability is also identified in the results. The fund managers fail to earn abnormal returns by adopting the marketing timing strategy and selecting the under priced securities in general. These finding are consistent with most of the empirical studies which reject the superior selection and timing ability for fund managers and support the validity of the Efficient Market Theory. Moreover, the alpha coefficients reported in Table 5 are unnecessarily greater than the coefficients obtained from the single-factor model shown in Table 4. Therefore the downward bias when market timing effects are ignored suggested by Grant (1977) is not found in this study. Performance Persistence of Hong Kong Mutual Funds When a mutual fund performs persistently, then investors are encouraged to make their decisions based on the historical performance of that fund. The rejection of performance persistence will lower the predictive power of the empirical conclusions on the risk-adjusted performance. On the other hand, the existence of performance persistence is also considered as a test of fund managers’ skills since poor fund managers can beat the market by luck but only skilled fund managers can become winners most of the time. If the persistence in performance is found to last more than one year, then winners require less rebalancing in the nest interval. Supporting evidence of the persistence in mutual funds performance has been found by Carlson (1970), Grinblatt and Titman (1992), Goetzmann and Ibbotson (1994) in the US and by Allen and Tan (1999), Quigley and Sinquefield (1999), Heffernan(2001) and Tonks (2002). In this study, we examine the short-term performance persistence of Hong Kong mutual funds using the method employed by Goetzmann and Ibbotson (1994). The performance of each sample fund is measured by the Jensen’s Alpha and ranked for the periods from 2002 to 2003, from 2003 to 2004 and from 2004 to 2005. Winners are the sample funds that out-perform the median performance level and losers are those that under-perform the median.
1
The estimated coefficient of the intercept is – 0.0164 with the p-value of 0.000; the estimated coefficient of the excess market return is 0.5285 with the p-value of 0.000; the estimated coefficient of the quadratic term is – 0.0164 with the p-value of 0.0104. 14
Panel A of Table 6 reports the number of persistent winners and losers during the sample intervals. It is shown that 10 out of 30 managed to remain in the winner sector over the first interval while 8 out of 30 exhibit poor performance in a row. In the second interval, 11 persistent winners and 8 persistent losers are identified. Panel B gives a better understanding of the persistence in the performance in terms of percentage of picking a winner based on historical performance of Hong Kong mutual funds by combining the results over two intervals. Persistent performance is found for initial good performers and initial poor performance. It is implied that investors are advised to pick past winners and avoid picking past losers. These results are consistent of the evidence provided by Heffernan (2001) who suggested persistence in short-term performance for UK unit trusts. However, Hendricks, Patel and Zeckhauser (1993) pointed out that the results of the evaluation of mutual fund performance persistence are biased by the choice of measure. He further illustrated that the persistence in good performance is contributed partially by the Jensen measure. In order to examine whether it holds true in this case, we rank the performance of the sample funds again employing the Treynor measure which takes into account the effect of the beta factor. Panel C illustrates the relative results using the Treynor measure. By comparing the outputs in Panel A and Panel C, we still identify performance persistent for both winners and losers in general. It is implied that the results are not sensitive to the choice of measurement in this case. Therefore, we further confirm that mutual funds perform persistently in the short run in Hong Kong. The ratio of picking repeat-winners is reported in Panel D which is slightly different from the one that is shown in Panel B. Although the sample funds are found to perform persistently in general, the factors that contribute to the persistence are controversial in the literature. Jegadeesh and Titman (1993) attribute the performance persistence to the momentum effect which indicates that stocks that perform the best (worst) over a 3 to 12 month period tend to continue to perform well (poorly) over the subsequent 3 to 12 months. Carhart (1997) employs the four-factor model to take into account the one-year momentum effect and rejects the existence of superior skills of fund managers since persistence is only found for worst-return performers. These findings are confirmed by Bollen and Busse (2004). The evidence of performance persistence in this study is sufficient for the conclusion that the sample funds do not merely perform by luck but is insufficient for the conclusion that they perform by skills. However, it does manage to support the idea of avoiding past losers from the point of view of an investor. CONCLUSIONS This paper examines the performance of the Hong Kong mutual funds which are recognized as the most growing investment intermediaries in modern portfolio investment business. We mainly focus on the risk-adjusted performance, selectivity and market timing ability and performance persistence of a sample of 30 mutual funds in the Hong Kong market. The risk-adjusted performance gives some insights of the Hong Kong mutual fund performance relative to the market portfolio. In other words, it shows the profitability of 15
purchasing professional service and management. The selectivity and timing ability of fund managers are evaluated in order to explain whether superior skills exist when portfolios are under professional management. Significant superior selectivity would bring abnormal returns to investors while significant market timing generates capital appreciation for investors when the prices of the holding assets fluctuate unconventionally. Meanwhile, the Efficient Market Hypothesis is logically challenged when superior selectivity and timing ability are found since individuals are not informationally equal when some information can be used to make abnormal returns more than one time. The performance persistence is crucial for the predictive function of the empirical investigations on the ranking of performers. However, it does not necessarily mean that investors are able to make abnormal returns based on the historical ranking when evidence is found to support performance persistence for mutual funds. Such evidence does a better job in helping investors to avoid losing in their investment activities. Based on the empirical findings reported in this paper, the following are the main conclusions: Firstly, Hong Kong mutual funds, on average, under-perform the market. This conclusion holds true for money market funds, fixed income funds, balanced funds and growth funds. The equal-weighted portfolios formed by all sample funds and by each sector of funds fail to generate abnormal returns during the ten-year period from 1995 to 2005 according to the evaluation by weekly observations. This result is consistent with Jensen (1968)’s findings and does not reject the Efficient Market Hypothesis. It also can be considered as the supporting evidence for the high level of development of the Hong Kong financial market. Secondly, the three-factor model which takes into account the size effect and value effect is more favorable than the single-factor model with higher explanatory power when evaluating managed portfolio performance in the Hong Kong market. It confirms the findings of Drew and Veeraraghavan (2001)’s study on asset pricing in Asian regions which suggests that small stocks outperform big stocks and high book-to-market stocks generate higher returns than low book-to-market stocks in the Hong Kong market. The small-minus-big size factor is found to significantly contribution to the performance of money market funds, fixed income funds, growth funds and index funds. While significant negative relation as found between the high-minus-low book-to-market value factor and the performance of money market funds, balanced funds, growth funds and index funds. Thirdly, the Jensen’s alpha and the Treynor Measure provide the same conclusion in terms of risk-adjusted performance in this case. Fourthly, little superior selectivity and timing ability are supported in this paper when the quadratic model is employed. The only exception is identified for the managers of money market funds in term of timing ability. However, since the fit of model is pretty low for the money market funds, it is unreasonable for us to attribute this finding to any statistic understandings. Finally, performance persistence is found for good and poor performers when the successive two-year intervals are used to define the short-term sample periods. The evidence supports this persistence in both the Jensen’ alpha and Treynor ratio versions and thus fails to tell whether the evaluation of persistence in mutual fund performance is sensitive to the choice of measure. 16
Due to the limited availability of Hong Kong mutual fund data and the roughness of the data edition provided by the database, the findings of this paper are subject to statistical restrictions. The sample employed in this paper is small to fully explain the whole story of the Hong Kong mutual fund industry and the horizon of the time series is not long enough to capture the real characteristics of the observations. However, as an independent empirical study on the performance of Hong Kong mutual funds, it provides some specific insights of the fund management market which are attractive to international investors but lacks spontaneity for analysis from independent sectors. Future research could explore the sensitivity of the performance measure to a broader choice of models and benchmarks, the superior separation of selectivity of market timing and the real causes of the performance persistence.
REFERENCES Bollen N. and Busse J., (2004), Short-Term Persistence in Mutual Fund Performance. The Review of Financial Studies, 18(2), pp. 569-597. Cai, J., Chan, K.C., Yamada, T., (1997), The Performance of Japanese Mutual Funds. The Review of Financial Studies, 10, pp. 237-273. Carhart, M. (1997), On Persistence in Mutual Fund Performance. Journal of Finance, 52(1), pp. 57-82. Carlson, RS, (1970), Aggregate Performance of Mutual Fund: 1948-1967. Journal of Financial and Quantitative Analysis, 5, pp. 1-31. Casarin, R., Pelizzon, L. and Piva, A., (2001), Italian Equity Funds: Efficiency and Performance Persistence. European Financial Management Association (EFMA) Meetings. Christensen, M., (2003), Evaluating Danish mutual fund performance, Aarhus School of Business. Dahlquist, M., Engstrom, S., Soderlind, P., (2000), Performance and Characteristics of Swedish Mutual Funds. Journal of Financial and Quantitative Analysis, 35, pp. 409-423. Dermine, J., Röller, L.H., (1992), Economies of Scale and Scope in French Mutual Funds. Journal of Financial Intermediation, 2, pp. 83-90. Drew, M. and Veeraraghavan, M., (2001), Asset Pricing in the Asian Region. Discussion Paper No 94. Technical Report, School of Economics and Finance, Queensland University of Technology. Elton, E. and Gruber, M., (1991), Differential Information and Timing Ability. Journal of Banking and Finance, 15, pp.117-131. Elton, E. and Gruber, M., (1999), Common Factors in Active and Passive Portfolios. European Finance Review, 3, pp. 53-78. Elton, E., Gruber, M., Das, S and Hlavka, M., (1993), Efficiency with Costly Information: A Reinterpretation of Evidence from Managed Portfolios. Review of Financial Studies, 6, pp. 1-22. Elton, E., Gruber, M., and C. R. Blake, (1996), Survivorship Bias and Mutual Fund Performance, The Review of Financial Studies, 9(4), pp. 1097-1120.
17
Fama, E.F., (1972), Components of Investment Performance. Journal of Finance, 27, pp.551-567. Fama, E.F. and French, K.R., (1993), Common Risk Factors in the Returns on Stocks and Bonds. Journal of Financial Economics, 33, pp. 3-56. Fletcher, J., (1997), The Evaluation of the Performance of UK American Unit Trusts. International Review of Economics and Finance, 8, pp.455-466. Friend, I. and Blume, M.E. (1970), Measurement of Portfolio Performance Under Uncertainty. American Economic Review, 60(4), pp. 561–575. Goetzmann, W.N. and Ibbotson, R.G., (1994), Do Winners Repeat? Journal of Portfolio Management, 20(2), pp.9-18 Grant, D., (1977), Portfolio Performance and the Cost of Timing Decisions. Journal of Finance, 32, pp. 837-846. Grinblatt, M. and Titman, S., (1989), Mutual Fund Performance: An Analysis of Quarterly Portfolio Holdings. Journal of Business, 62, pp. 393-416. Grinblatt, M. and Titman, S., (1992), The Persistence of Mutual Fund Performance. Journal of Finance, 47, pp. 1977-1984. Grinblatt, M. and Titman, S., (1993), Performance Measurement without Benchmarks: An Examination of Mutual Fund Returns. Journal of Business, 66, pp. 47-68. Grinblatt, M., Titman, S. and Wermers, R., (1995), Momentum Investment Strategies, Portfolio Performance, and Herding: A Study of Mutual Fund Behavior. American Economic Review, 85 (5), pp. 1088-1105. Gruber, M. (1996), Another Puzzle: the Growth in Actively Managed Mutual Funds. Journal of Finance, 51, pp. 783-810. Harrison, M., (2003), Fund Management in Hong Kong and Singapore. Hong Kong Exchanges and Clearing (HKEx). Harvey, C. R., (1997), Financial Glossary, http://biz.yahoo.com/glossary/bfglosm.html. Accessed on 16 February 2006. Hong Kong Securities and Futures Commission, (2004), Investment Fund Management, http://www.lowtax.net/lowtax/html/hongkong/jhkinv.html, Accessed on 16 February 2006. Ippolito, (1989), Efficiency with Costly Information:A Study of Mutual Fund Performance, 1965-1984. The Quarterly Journal of Economic, 104, pp. 1-23 Ippolito, R.A., (1993), On Studies of Mutual Fund Performance, 1962-1991, Financial Analysts Journal, 49, pp. 42-50. Jegadeesh, N. and Titman, S., (1993), Returns to Buying Winners and Selling Losers: Implications for Stock Market Efficiency. Journal of Finance, 48(1), pp. 56-91. Jensen, M., (1968), The Performance of Mutual Funds in the Period 1945-1964. Journal of Finance, 23, pp. 389-416. Bogle, J. C., (2003), The Mutual Fund Industry 60 Years Later: For Better or Worse?, http://www.vanguard.com/bogle_site/sp20050102.htm, Accessed on 16 February 2006. Khorana, A., Servaes, H. and Tufano, P., (2005), Explaining the Size of the Mutual Fund Industry around the World. Journal of Financial Economics, 78(1), pp. 145-186. Kon, S. and Jen, F., (1979), The Investment Performance of Mutual Funds: An Empirical Investigation of Timing, Selectivity, and Market Efficiency. Journal of Business, 52, pp. 263-289. 18
Kon, S., (1982), The Market Timing Performance of Mutual Fund Managers. Journal of Business, 56, pp. 323-347. Malkiel, B.G., (1995), Returns from Investing in Equity Mutual Funds 1971-1991. Journal of Finance, pp. 549-572. Quigley, G. and Sinquefield, R.A., (2000), Performance of UK Equity Unit Trusts. Journal of Asset Management, 1(1), pp. 72-92. Sharpe, W. F., (1966), Mutual Fund Performance. Journal of Business, Vol. 39, No. 1, Part 2: Supplement on Security Prices, pp. 119-138 Ter Horst, J.R., Nijman T. and de Roon, F., (1998), Style Analysis and Performance Evaluation of Dutch Mutual Funds. Journal of Financial Research. 18. 415-430. Treynor, J. L. and Mazuy, K., (1966), Can Mutual Funds Outguess the Market? Harvard Business Review 44, pp. 131-136. Wermers, R., (2000), Mutual Fund Performance : An Empirical Decomposition into Stock Picking Talent, Style, Transactions Costs, and Expenses. Journal of Finance, 55(4), pp. 1655-1703. Wittrock, C. and Steiner, M, (1995), Performance-Messung ohne Ruckgriff auf Kapitalmarkttheoretische Renditeerwatungsmodelle. Kredit und Kapital, 1-45. Xiaorong, G. (no date), A Comparative Study of Security Systems of Shanghai, Shenzhen, and Hong Kong, Section 5 (Securities Investment Trust (Investment Fund) Legal System)), http://www.rjmacau.com/english/rjm1996n3/security/section5.html, Accessed on 16 February 2006.
19
TABLE 1. Number of Authorized Unit Trusts and Mutual Funds As at
Bond
Equity
Diversified
End
Money
Fund of
Market
Funds
Warrant
Index*
Guaranteed**
Other Specialized***
Umbrella Structures
Number of Authorized Funds
3/1996
170
634
66
185
21
16
n.a.
n.a.
32
95
1,219
3/1997
190
713
75
186
24
16
n.a.
n.a.
39
113
1,356
3/1998
210
829
93
189
29
15
n.a.
n.a.
31
130
1,526
3/1999
261
905
84
157
40
8
n.a.
n.a.
20
133
1,608
3/2000
277
957
105
90
32
7
n.a.
n.a.
14
131
1,613
3/2001
307
1,118
128
74
77
4
n.a.
n.a.
22
140
1,870
3/2002
290
1,063
121
61
82
4
38
73
8
150
1,890
3/2003
311
1,030
124
65
63
n.a.
21
181
4
162
1,961
3/2004
294
891
110
58
76
n.a.
22
244
6
161
1,862
3/2005
303
884
111
56
76
n.a.
19
309
7
164
1,929
* Figures prior to March 2002 are included in Bond Funds and Equity Funds ** Figures prior to March 2002 are included in Other Specialized *** Includes Futures & Options Funds and Leveraged Funds (Guaranteed Funds up to March 2001) Remark: Figures prior to 1996 are available from the SFC Quarterly Bulletin, 2003 Winter Issue (Issue No.54, Unit Trusts and Mutual Funds) Source: Securities and Futures Commission (http://www.sfc.hk/sfc/doc/TC/research/stat/d02.doc)
20
TABLE 2. Net Asset Value of Authorized Unit Trusts and Mutual Funds by Type (US$ million) As at End
Bond
Equity
Diversified
Money
Fund of
Market
Funds
Warrant
Index*
Guaranteed**
Other
Total
Specialised***
12/1996
10,404
71,186
7,469
5,887
515
279
n.a.
n.a.
1,854
97,594
12/1997
12,718
100,503
9,586
7,078
591
277
n.a.
n.a.
1,629
132,383
12/1998
28,891
124,840
14,266
12,676
1,036
306
n.a.
n.a.
1,078
183,092
12/1999
31,383
226,861
26,296
11,193
1,227
419
n.a.
n.a.
1,501
298,879
12/2000
44,544
219,934
26,869
15,788
2,529
22
n.a.
n.a.
1,765
311,449
12/2001
48,499
181,547
26,123
12,222
2,283
1.3
5,210
5,780
3,545
285,210
12/2002
77,703
143,290
28,842
69,739
2,375
n.a.
7,870
11,734
421
341,974
12/2003
112,048
270,582
41,095
81,472
3,863
n.a.
8,139
15,999
685
533,883
12/2004
112486
272962
38433
94540
4813
n.a.
7362
18403
1046
550,045
* Figures prior to 2002 are included in Bond Funds and Equity Funds ** Figures prior to 2002 are included in Other Specialised *** Includes Futures & Options Funds and Leveraged Funds (Guaranteed Funds up to 2001) Remarks: Figures may not add up to totals due to rounding Figures prior to 1996 are available from the SFC Quarterly Bulletin, 2003 Winter Issue (Issue No.54, Unit Trusts and Mutual Funds) Source: Securities and Futures Commission(http://www.sfc.hk/sfc/doc/TC/research/stat/d02.doc)
21
TABLE 3. Summary Statistics of Mutual Fund Database Panel A: Overview of the Sample by Category Fund size is the total net assets of the underlying portfolio. Money market fund is a type of mutual fund that invests in short term money market instruments. Balanced fund is the mutual fund with collective investment schemes to seek long-term capital gain. Income fund is the one that primarily seeks current income rather than growth of capital with low-risk investment priority. Growth fund is a type of mutual fund that aims to provide capital appreciation that are higher return than dividend payment by investing assets with potential growth. Index funds are those that aim to track the performance of some benchmarks such as S&P 500, Russell 2000, Lehman-Brothers Aggregate Bond and NASDAQ 100. Fund size represents the total net asset value of the sample funds. Group
Sample Number
Percentage
Fund Size 29-07-25 (HK$ mil)
All Funds
30
29,901
100%
4 5 3 8 10
3,030 1,148 4,354 7,768 13,601
10.13% 3.84% 14.56% 25.98% 45.49%
By fund category Money Market Fixed Income Balanced Growth Index
Panel B: Mutual Fund Returns Descriptive Statistics
Money Market
Fixed Income
Balanced
Growth
Fixed Index
All Fund
Mean Median Maximum Minimum Std.Dev Skewness Kurtosis
0.0011 0.0010 0.0191 -0.0166 0.0022 -0.5036 22.8008
0.0015 0.0024 0.0175 -0.0160 0.0060 -0.5163 3.7412
0.0006 0.0013 0.0393 -0.0471 0.0155 -0.2326 3.0481
0.0016 0.0036 0.1602 -0.2926 0.0364 -1.1883 14.1087
0.0351 0.0057 0.0572 -0.0521 0.0209 -0.4678 3.3670
0.0012 0.0025 0.0807 -0.1457 0.0185 -1.1391 13.0666
Jarque-Bera Probability
8271.211 0.0000
6.8671 0.0323
2.2869 0.3187
2785.342 0.0000
4.2931 0.1169
2299.198 0.0000
Panel C: Benchmark Returns Benchmark
Mean Return
Standard Deviation
Cross Correlation HKHSI
SMB
HML
HKHSI SMB
0.0018 -0.0017
0.0402 0.0235
1.0000 -0.0832
— 1.0000
— —
HML
-0.0059
0.0622
0.1765
-0.1549
1.0000
22
TABLE 4. Risk-adjusted Performance of Hong Kong Mutual Funds The following outputs are yielded from the CAPM estimation by running the regression Rit – Rft = αi1 + βi01 (Rmt – Rft) + εit. The t-Statistic is a measure of how extreme a statistical estimate is. The alpha (α) is the intercept of the regression. The coefficient of determination represented by R2 indicates the explanatory power of the estimations. The probability illustrates the statistical proportion of an event in a large population. Panel A: Mutual Fund Performance Measurement — Jensen’s Alpha (Observations: 518) Fund Type All Funds Money Market Fixed Income Balanced Growth Index
1
Alpha (αi )
t-Statistic*
R-Squared**
P-value
-0.0159 -0.0271 -0.0048 -0.0057 -0.0046 -0.0006
-17.3418 -22.4015 -4.9617 -6.9202 -4.5051 -0.6706
0.7271 0.4480 0.4707 0.7731 0.8294 0.8485
0.0000 0.0000 0.0000 0.0000 0.0000 0.5040
* Coefficients are not significantly different from zero if the absolute t-Statistic on estimated coefficients are less than 1.69, which represents 95% confidence in two-tail test. ** R-Squared is a statistical measure of how well a regression line approximates real data points. It indicates the fit of the model and is defined as: R(X,Y) = [ Cov(X,Y) ] / [ StdDev(X) * StdDev(Y) ] Panel B: Mutual Fund Performance Measurement — Treynor Measure (Observations: 518) The numerator of the Treynor ratio is the difference between the average return of observations on the underlying portfolio and the average return of the risk-free rate. The denominator is the beta factor of the regression. Fund Type All Funds Money Market Fixed Income Balanced Growth Index
Excess Return on Mutual
Beta
Treynor Ratio
Fund Portfolio (Rp – Rf)
(β)
(Rp– Rf ) / β
-0.0020 -0.0366 -0.0058 0.0002 0.0001 0.0036
0.5782 0.2646 0.2496 0.6508 0.8779 0.9249
-0.0035 -0.1383 -0.0232 0.0003 0.0001 0.0039
23
Panel C: Results from the Three-factor Model — Coefficients (Observations: 518) 2
Fund Type
Alpha
Market
SMB
HML
R
All Funds P-value
-0.0155
0.5784
0.3043
-0.016
0.7804
0.0000
0.0000
0.0000
0.1284
—
Money Market
-0.0269
0.2644
0.1658
-0.0077
0.4745
P-value
0.0000
0.0000
0.0000
0.6182
—
Fixed Income
-0.0044
0.2755
-0.0131
-0.0827
0.4904
P-value
0.0000
0.0000
0.8449
0.1086
—
Balanced P-value
-0.0056
0.6786
0.0867
-0.1349
0.7945
0.0000
0.0000
0.0242
0.0001
—
Growth
-0.0040
0.8779
0.4288
-0.023
0.884
P-value
0.0000
0.0000
0.0000
0.0378
—
Index
-0.0005
0.9441
0.2104
-0.1709
0.8817
P-value
0.5755
0.0000
0.0003
0.0002
—
TABLE 5. Timing Abilities and Selectivity of Fund Managers (Observations: 518) The selectivity is captured by the intercept of the quadratic model Rit – Rft = αi* + βi0* (Rmt – Rft) + βi1* (Rmt – Rft) 2 + εi.. The timing ability is evaluated by the coefficient of the squared term in the model. Group
Selectivity
Timing Ability
*
*
(αi ) All Actively Managed Funds Money Market Fixed Income Balanced Growth
(βi1 )
2
R
-0.0164
-17.825
-0.3794
-2.5711
0.7289
-0.0271 -0.0034 -0.0055 -0.0055
-22.1135 -2.7673 -6.3865 -5.3779
0.0272 -2.4332 -0.5345 -0.8564
0.1386 -1.6758 -1.0674 -5.2578
0.4481 0.4908 0.7741 0.8381
24
TABLE 6. Winners and Losers over Successive Two-year Intervals Panel A: Results of Two Periods Mutual Fund Returns Measured by Jensen’s Alpha 2003-2004 2002-2003
2004-2005
Winners
Losers
Winners
10
6
Losers
6
8
2003-2004
Winners
Losers
Winners
11
5
Losers
6
8
Panel B: Combined Results of Two Periods — Jensen Measure Combined Results Successive Period Winners
Losers
Initial Winners
21 (65.62%)
11 (34.38%)
Initial Losers
12 (42.86%)
16 (57.14%)
Panel C: Results of Two Periods Mutual Fund Returns Measured by Treynor Ratio 2003-2004 2002-2003
2004-2005
Winners
Losers
Winners
9
6
Losers
6
9
2003-2004
Winners
Losers
Winners
9
6
Losers
6
9
Panel D: Combined Results of Two Periods — Treynor Ratio Combined Results Successive Period Winners
Losers
Initial Winners
18 (60.00%)
12 (40.00%)
Initial Losers
12 (40.00%)
18 (60.00%)
25
FIGURE 1. Assets Under Management in Selected fund Management Centres 3000 2500
2461
2363 2058
2000 US$ Bil
1500 1000 458
500
339
190
166
Hong Kong
Singapore
0 London
New York
Tokyo
Paris
Australia
Source: Hong Kong - Fund Management Activities Survey 2001, SFC; Singapore – 2001 Survey of the Singapore Asset Management Industry; Australia – Australian Bureau of Statistics; London, New York, Tokyo, Paris – LSE website (www.londonstockexchange.com/international/sld003.asp) As cited in Harrison (2003).
26
APPENDICES APPENDIX 1. List of Sample of Hong Kong Mutual Funds Name
Currency
Category
Total Net
Annual
Sales
Assets
Expense
Fees
0.75%
5%
(000's) AXA.INV.MGRS.HK.LQY.
US$
Growth
54,292
CM FIRST STATE CHIN.GW. II
US$
Growth
145,800
1.50%
0
DRESDNER RCM CHOICE BAL.
HK$
Balanced
1,744,173
0.80%
5.00%
US$
Growth
284,000
1.50%
5.25%
HK$
Index
338,962
1.00%
3.00%
HK$
Index
80,497
1.00%
3.00%
HK$
Index
73,203
1.50%
4.00%
HANG SENG CONT.ER.IDX.
US$
Index
331,005
1.00%
3.00%
HANG SENG HK BD.AC.
HK$
39,511
1.50%
4.00%
128,219
1.00%
3.00%
13,135
1.00%
0.25%
FIDELITY GREATER CHINA FD.SHS HANG SENG CHIN.H SHS. IDX.AC. HANG SENG CHIN.IDX.AC. HANG SENG CHINA H SHARE IDX LEVERAGED 150
HANG SENG HK MID CAP IDX.AC.
HK$
Fixed Income Index Money
HANG SENG HKD MM
HK$
HANG SENG JAP.IDX.
US$
Index
207,614
1.00%
3.00%
HANG SENG LEVERAGED 150
HK$
Index
117,144
1.00%
4.00%
HANG SENG PAC.IDX.
US$
Index
89,146
1.00%
3.00%
66,325
1.50%
4.00%
98918
1.00%
0.25%
HANG SENG PROPERTY EQ. ACC
HK$
Market
Fixed Income Money
HANG SENG USD MM
US$
HS AMERICAN INDEX
US$
Index
243,340
1.00%
3.00%
HS GLOBAL BALANCED
US$
Balanced
59,438
1.00%
4.00%
HS GLOBAL BOND ACC
US$
16,936
1.00%
4.00%
HS GLOBAL CONSERVATIVE
US$
14,473
1.00%
4.00%
HS GLOBAL HIGH GW.
US$
51,897
1.00%
4.00%
HS GLOBAL HIGH YIELD ACC
US$
102,618
1.50%
4.00%
HS HK BALANCED
HK$
Balanced
2,147,270
1.50%
5.50%
HS UK INDEX
US$
Index
783,530
1.00%
3.00%
Market
Fixed Income Fixed Income Growth Fixed Income
27
(Continued) HSBC GLB.MONEY FD.HK.
HK$
J F INDO.FD.
HK$
JF.MONEY FD.
HK$
PANURGY LTD.COLONIAL SEC HONG KONG SCHRODER INV.MT.HK.SM.CO SCHRODER SISF HONG KONG EQ.B ACC
Money Market Growth Money Market
1,802,046
0.25%
0
339,000
1.50%
5%
445900
0.0025
0
US$
Growth
1,921
2.00%
5%
HK$
Growth
2,350,157
0.63%
5%
HK$
Growth
897,266
1.50%
5%
28
APPENDIX II. Performance Persistence of Hong Kong Mutual Funds Ranked by Jensen’s Alpha Mutual Fund
2002-2003
2003-2004
2004-2005
AXA INV.MGRS.HK U$ LQY.
Loser
Loser
Winner
CMG FIRST STATE CHIN.GW. II
Loser
Loser
Loser
Winner
Winner
Winner
FIDELITY GREATER CHINA FD.SHS
Loser
Winner
Winner
HANG SENG CHIN.H SHS. IDX.AC.
Winner
Loser
Winner
HANG SENG CHIN.IDX.AC.
Winner
Loser
Winner
Winner
Winner
Winner
Winner
Winner
Winner
Loser
Loser
Loser
Winner
Winner
Winner
HANG SENG HKD MM
Loser
Loser
Loser
HANG SENG JAP.IDX.
Winner
Loser
Winner
HANG SENG LEVERAGED 150
Winner
Winner
Winner
HANG SENG PAC.IDX.
Winner
Winner
Winner
DRESDNER RCM CHOICE BAL.
HANG SENG CHINA H SHARE IDX LEVERAGED 150 HANG SENG CONT.ER.IDX. HANG SENG HK BD.AC. HANG SENG HK MID CAP IDX.AC.
HANG SENG PROPERTY EQ. ACC HANG SENG USD MM HS AMERICAN INDEX HS GLOBAL BALANCED
USD USD
HS GLOBAL BOND A ACC USD HS GLOBAL CONSERVATIVE
USD
HS GLOBAL HIGH GW.A USD HS GLOBAL HIGH YIELD ACC
USD
HS HK BALANCED HS UK INDEX A USD HSBC GLB.MONEY FD.HK.
Loser
Winner
Loser
Winner
Winner
Winner
Loser
Winner
Loser
Winner
Loser
Winner
Loser
Winner
Loser
Loser
Winner
Loser
Winner
Loser
Loser
Loser
Winner
Loser
Loser
Loser
Loser
Winner
Loser
Loser
Loser
Loser
Loser
Winner
Winner
Winner
Loser
Loser
Loser
PANURGY LTD.COLONIAL SEC HONG KON
Winner
Winner
Winner
SCHRODER INV.MT.HK.SM.CO
Winner
Winner
Winner
Loser
Loser
Loser
J F INDO.FD.K$ JF.MONEY FD.HK$
SCHRODER SISF HONG KONG EQ.B ACC
29
APPENDIX III. Performance Persistence of Hong Kong Mutual Funds Ranked by Treynor Ratio Mutual Fund
2002-2003
2003-2004
2004-2005
Loser
Loser
Loser
CMG FIRST STATE CHIN.GW. II
Winner
Loser
Loser
DRESDNER RCM CHOICE BAL.
Winner
Winner
Loser
FIDELITY GREATER CHINA FD.SHS
Loser
Winner
Winner
HANG SENG CHIN.H SHS. IDX.AC.
Winner
Winner
Winner
HANG SENG CHIN.IDX.AC.
Winner
Winner
Winner
Loser
Loser
Winner
Loser
Winner
Winner
Winner
Winner
Loser
Loser
Loser
Winner
HANG SENG HKD MM
Winner
Loser
Loser
HANG SENG JAP.IDX.
Loser
Loser
Winner
HANG SENG LEVERAGED 150
Loser
Winner
Winner
Winner
Winner
Winner
AXA INV.MGRS.HK U$ LQY.
HANG SENG CHINA H SHARE IDX LEVERAGED 150 HANG SENG CONT.ER.IDX. HANG SENG HK BD.AC. HANG SENG HK MID CAP IDX.AC.
HANG SENG PAC.IDX. HANG SENG PROPERTY EQ. ACC
Loser
Winner
Winner
Winner
Winner
Loser
Loser
Winner
Loser
USD
Loser
Loser
Loser
HS GLOBAL BOND A ACC USD
Loser
Loser
Loser
Loser
Loser
Winner
Winner
Winner
Loser
Winner
Loser
Winner
HS HK BALANCED
Loser
Loser
Loser
HS UK INDEX A USD
Loser
Loser
Loser
Winner
Loser
Winner
Loser
Winner
Loser
JF.MONEY FD.HK$
Winner
Loser
Loser
PANURGY LTD.COLONIAL SEC HONG KON
Winner
Winner
Winner
SCHRODER INV.MT.HK.SM.CO
Winner
Winner
Winner
SCHRODER SISF HONG KONG EQ.B ACC
Winner
Loser
Loser
HANG SENG USD MM HS AMERICAN INDEX HS GLOBAL BALANCED
USD
HS GLOBAL CONSERVATIVE
USD
HS GLOBAL HIGH GW.A USD HS GLOBAL HIGH YIELD ACC
USD
HSBC GLB.MONEY FD.HK. J F INDO.FD.K$
30