represented by several variables most relevant to the Navy mine hunting forces, i.e. height proud or percentage of ... compared with the diver measured data.
Sixth International Symposium on Technology and the Mine Problem May 9 – 13, 2004, Naval Postgraduate School, Monterey, CA
Abelev, Valent, Barbu
Risk assessment and implementation of impact burial prediction algorithms for detection of bottom sea mines By Abelev, A.V.1, Valent, P.J.1, and Barbu, C.2 1
Naval Research Lab, Stennis Space Center, MS 39529 2 Tulane University, New Orleans LA 70118
Abstract This paper presents a probabilistic approach to predicting the risk of encountering mines impact buried in mud seafloors. This approach is based on a stochastic interpretation of the sets of both the input and the output parameters used by the existing predictive software. The input parameters describe the variability in the environmental parameters of the layered sediments, as well as the dynamic parameters of the mine impacting the mudline. The output parameters are represented by several variables most relevant to the Navy mine hunting forces, i.e. height proud or percentage of surface area proud. Both sets of input parameters are described using their Gaussian distributions, derived from experimental observations. The stochastic output of the predictive impact burial model is evaluated using a Monte-Carlo simulation technique and compared with the diver measured data. The model displays a somewhat better performance, in statistical terms, as opposed to the deterministic evaluations. Previously observed tendencies to overestimate the height protruding, the final pitch in mud and to underestimate the surface area exposed are confirmed but with the added information from comparing the probability distributions. The model evaluated produces a somewhat more meaningful result for the decision making process of the MCM forces if exercised in the suggested Monte Carlo framework. Reference probability charts are developed providing a more accurate and easier to interpret model output that could be effectively utilized by the Navy Mine Counter-Measures (MCM) forces.
Introduction and background The main objectives of this study is to systematically analyze the performance of the current state-of-the-art mine impact burial model. This analysis includes a stochastic representation of the input parameters, describing the natural variability of the sediment properties of a typical soft cohesive marine deposit and a stochastic evaluation of the output results. The model evaluated includes only the sediment component of the prediction package and utilizes the experimentally measured behavior of a free-falling cylinder at contact with the mudline [1]. The input parameters used in predicting the penetration of a cylindrical mine into the seafloor sediments are thus divided into two groups – dynamic and environmental. The dynamic
1
Monday, March 06, 2006 (4).max
Sixth International Symposium on Technology and the Mine Problem May 9 – 13, 2004, Naval Postgraduate School, Monterey, CA
Abelev, Valent, Barbu
parameters include the conditions of the cylinder at the initial contact with the mudline and the beginning of the sediment penetration phase. Since the currently existing predictive software utilizes a simplified two-dimensional approach, the dynamic variables include only the following four components – vertical velocity, horizontal velocity in the vertical plane of the mine (a plane formed by the mine long axis and the vertical), pitch angle at impact, and angular rotation rate (in the same plane). These dynamic components are stochastic in nature as they result from the entire history of motion through the water column, from the initial release at or above the water surface and until the initial contact with the sea bottom. The statistics of these parameters have been studied and published earlier [1]. The environmental components include a discretized set of layers, of variable thickness, each described by the density and the bearing strength parameters. These values were obtained from the laboratory tests on gravity cores from two locations in the Northern Gulf of Mexico. Experimentally measured burial data were also available from these sites for comparing with the model predictions. These data were obtained during two series of free-fall deployments of a full-scale, instrumented, mine-like cylinder. The internal instrumentation recorded and stored the dynamic variables allowing for a subsequent numerical regeneration of a complete dynamic time history of the cylinder, free-falling through the air and water and penetrating into the sediment. The high variability in all the dynamic parameters of the free-falling mine, as was experimentally observed in [1] suggests the following approach. It appears beneficial to separate the randomness of the mine moving through one media, the water, from that of the sediment, that possesses a set of significantly different characteristics and behaviors, during a typical penetration event. This separation would then allow for a better treatment and incorporation of the media-specific stochastic descriptions into the overall impact mine burial prediction package. This would also allow for more meaningful evaluation of the overall model performance, based on probability distributions, rather than on single point estimates, thus providing the decision making Navy Mine Counter-Measures (MCM) personnel with a better means of estimating the threat and deciding upon a specific approach to the target area. Evaluation of the deterministic performance of the sediment component of the current mine burial prediction model has been presented in [2] by comparing two sets of results of an experimental deployment of a full-size instrumented cylinder (at Corpus Christi, TX and Cocodrie, LA) with model predictions. It was observed that the model performs marginally, at best, with a potential of over- or under-predicting the amount of mine burial by as much as a factor of 3, or more. This model may nevertheless be found to be able to provide a set of more useful predictions, if used in a stochastic framework, providing added information on the amounts of burial in the form of statistical distributions. This paper presents the results of this study. First, a brief description of the experimental setup and procedures is presented. Then, the stochastic evaluation framework is described and the results of a series of Monte Carlo simulations are presented. Discussion and conclusions, then, conclude the presentation.
Experimental setup equipment, and procedures Instrumented cylinder and data acquisition The instrumented cylinder measures 0.53 m in diameter and 2.40 m long, yielding a length to diameter ratio of 4.5. Its weight in air is approximately 10 kN (2250 lbf) and its weight in 2
Sixth International Symposium on Technology and the Mine Problem May 9 – 13, 2004, Naval Postgraduate School, Monterey, CA
Abelev, Valent, Barbu
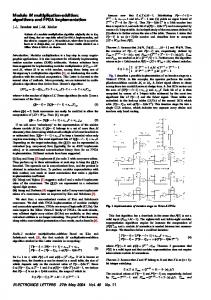
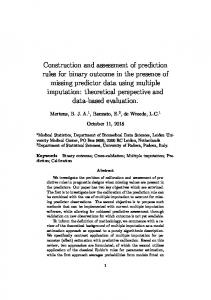
water (seawater) is about 4.9 kN. Most bottom mines of the type considered here are slightly nose heavy, and so the instrumented cylinder designed for this study had the distance between the center of mass (CM) and the center of volume (CV) of 0.104 m, with the CM located forward of the CV. Three different and interchangeable nose shapes were manufactured: blunt, hemispherical, and chamfered, again representing a variety of operational mines. Fig. 1 depicts the instrumented cylindrical shape, strapped to a cradle and with the blunt nose mounted. The internal instrumentation, placed in the sealed container inside the cylinder, included a set of accelerometers measuring along three orthogonal axes. These accelerometers had three different ranges: 2.5g, 4g, and 10g. Additionally, a tri-axial fiber-optic gyro (FOG) measured the angular rotation rate about three orthogonal axes, collinear with the axes of the accelerometer. A tri-axial magnetometer was also placed inside the instrumentation chamber. Interpretation of its measurements, however, was not implemented due to the difficulties in calibration. The internal instrumentation also included a power source, a signal acquisition and conditioning unit, and a fast access memory storage device. An upgraded and expanded version of the data processing software, originally reported in [3], was developed. The raw device data, which included variations of the components of local (cylinder’s coordinate system) accelerations and angular rotation rates with time was analyzed. First, the transformation was performed from the local (cylinder) coordinate system to the fixed global system, using the Euler aerospace rotation sequence. The effects of gravity were then removed and the resulting values of accelerations and angular rotation rates were integrated to obtain a set of global (in addition to local) velocities, displacements, and angular changes as functions of elapsed time. Processing from its initial state, with the cylinder suspended from the ship’s winch, forward proved somewhat ambiguous and was replaced with the reversed integration from the cylinder’s final position at rest, embedded in the sediment, backwards. The advantage of this approach was in the fact that the conditions at rest are easier and more accurately defined than those at the time of release. Comparisons between the forward and reverse integration schemes showed only minor errors in the overall calculated displacements, accumulated over the entire trajectory. The data post-processing routines resulted in a set of data that allows analysis of many individual components of the process of free fall and penetration into the sediment. Fig. 2 (a) represents an example of a typical visualization of the calculated trajectory of the cylinder during free fall. Fig. 2 (b) shows the sediment penetration phase of the trajectory only, starting at the initial contact with the seafloor and until the cylinder comes to a complete stop, embedded in the sediment. Accurate and detailed analysis of various components of acceleration also allowed for estimating the initial point of contact of the cylinder with the sediment floor. This point was typically characterized by a sharp spike in one or more components of the acceleration and angular rotation rates. The details of this determination are presented below. Accurate separation between the trajectory in the water and penetration into the sediment is essential for appropriate comparisons with predicted data. Testing procedures The data reported in this study was obtained during two cruises. These cruises included the January 2002 cruise on board R/V Pelican, in the vicinity of Cocodrie, LA and the May 2002 cruise on board R/V Gyre, in the vicinity of Corpus Christi, TX.
3
Sixth International Symposium on Technology and the Mine Problem May 9 – 13, 2004, Naval Postgraduate School, Monterey, CA
Abelev, Valent, Barbu
Each of the two trips included a series of drops with varying cylinder nose configurations and initial conditions. Only one nose configuration was used during the Cocodrie trip, while the cylinder with all three noses was tested during the Corpus Christi trip. Release medium was also varied with some of the cylinder deployments performed from the air, usually only a small height above the water surface, and some others released from the fully submerged position of just below the water surface. Additionally, the initial inclination (pitch) was changed by using different strapping. Two configurations were tested: horizontal and at 31 degrees nose down. Table 1 summarizes this information, showing the test name designations, and the release conditions. Test numbers, referred to hereafter, follow the sequential numbering order, given in the first column of the table. The testing sequence proceeded according to the following order. First the internal instrumentation of the cylinder resting in its cradle was initialized. The cylinder was then suspended by either the harness or from the bomb release (as shown in Fig. 1(b)), brought to the desired elevation above or below the water surface and released. A ¼” line was attached to the cylinder and trailed it to the bottom. This line was necessary for the subsequent location and recovery of the cylinder due to almost zero visibility encountered in both deployment areas. The divers then followed this line to the cylinder; located it on the bottom; and recorded its final orientation, including the resting angle, and the elevation above the mudline. Additionally, cylinder heading was recorded by the divers using a small compass with storage memory. In order to confirm the calculated trajectory of the cylinder, including the lateral travel from the point of release to its resting position on the seafloor, a small tethered metal weight (“stake”) was also released just prior to the cylinder deployment. The divers then located the stake on the bottom and measured the distance from the stake to the cylinder and the compass heading of this direction to produce a complete set of data that allowed for the computation of the overall lateral travel of the cylinder. The ambient current profile was also measured using ADCP. Analysis of this data showed only minor lateral flows that were considered too small to influence the trajectory of the massive cylinder to any significant degree. Comparison of the diver measured and instrumentation processed data showed good agreement in all those deployments where reliable diver measurements were available. The accurate determination of the dynamic parameters of the falling cylinder at the point of contact with the sediment was required for implementation of the predictive algorithm describing penetration into the mudfloor. The parameters required for input included two components of linear velocity, vertical and horizontal, pitch, and angular velocity in the vertical plane (plane of the mine) at the instant of initial contact with the sediment. Experimental impact determination Results of the analysis presented here are sensitive to the accurate determination of the actual initial contact of the mine body with the sediment. Selection of this point of impact can be done using two different methods. One is based on the diver observed elevation of the mine at rest, embedded in the sediment, and the other is based solely on the observed variations of various dynamic parameters of the mine as it is falling through the water and penetrating into the mud. The first method utilizes the measurements of the maximum amount of mine exposed above the mean sediment floor level and incorporates the value of the orientation angle from the accelerometers. Accelerometers provide a very reliable measure of the inclination angles when stationary. We estimate that these measurements are more reliable than the diver measured 4
Sixth International Symposium on Technology and the Mine Problem May 9 – 13, 2004, Naval Postgraduate School, Monterey, CA
Abelev, Valent, Barbu
pitch (at rest) taken using a hand-held inclinometer device (used in Cocodrie 2002 and Corpus Christi 2002 cruises). Knowing the final orientation and position of the cylinder embedded in the sediment, the initial point of contact of the body with the sediment floor can be back-calculated using the recorded values of local accelerations and angular rotation rates. The second method of calculating the apparent initial contact of the falling cylinder with the sea floor is based solely on observation of the change in various quantities with time. The quantities of interest include the three components of linear acceleration (in either local or global coordinate system), total vector of global acceleration, or the angular rotation rates. One could plot the variation of these quantities with time and attempt to find the location of the sudden change in the rates of change of these variables as the cylinder comes in contact with the mud floor. This contact causes sudden deceleration and is also often associated with a sudden change in the variation of the angular rotation rates, as the mine body pivots about its nose as the translational movement is slowed, and if the penetration depth is such that a significant portion of the cylinder length is still protruding above the sediment floor. Cylinders tested here were noseheavy, forcing the initial point of contact to occur in the frontal section. There is a complication, however, associated with the choice of this initial contact point, when the second approach is used. The behavior of the cylinder, moving through the water, includes a “trapped water” effect, when a certain amount of fluid, immediately adjacent to the body, is participating in the motions of the cylinder. This volume of water generates a pressure front traveling in front of the body that “senses” the sediment before the actual contact with any part of the cylinder. The extent of this trapped water effect depends on the current orientation of the cylinder, velocity, and rotation rates, as well as the geometry of the mine body. It was observed [1] that various nose shapes had an effect on the trajectory of the body. Blunt nose (in this nose heavy configuration) creates the largest pressure front, extending the farthest distance away from the mine, and the hemispherical one – the lowest. This trapped water effect sometimes complicates the manual determination of the initial contact with the sediment, as the rate of change of variables at certain orientations can be slow with no pronounced discontinuities. Penetration into softer sediments further complicates the problem, as the softer medium generates smaller resistance to the penetrating body, thus producing smaller changes in all the dynamic variables. A certain amount of engineering judgment had to be applied in these cases to determine the apparent instant of the initial contact of the cylinder with the mudfloor. It was decided to utilize the first method, relying on the diver measured elevations to pick the time of contact of the cylinder with the seafloor. This method appears to the authors to be more selfconsistent producing more reliable results especially in softer soil deposits.
Stochastic descriptions of input and output parameters The variability in the two sets of parameters (dynamic and environmental) was modeled by using a random sampling technique, drawing values from a set of probability density functions built from the experimental data. The input data included vertical and horizontal velocities (in the plane formed by the mine long axis and the vertical), the impact angle, and the angular rotation rate. These parameters were taken at the point of sediment contact from the two experimental sets of data under consideration. The environmental parameters included 13 sediment layers, each characterized by its density and bearing strength. All parameters were assumed to be Gaussian for the purpose of this study and were thus represented by their means and variances,
5
Sixth International Symposium on Technology and the Mine Problem May 9 – 13, 2004, Naval Postgraduate School, Monterey, CA
Abelev, Valent, Barbu
averaging over entire site considered, i.e. Corpus Christi or Cocodrie. Distributions were assembled for each one of these parameters using 50,000-point approximations. It is recognized that the sets of data used in this study are rather limited, giving only 10 and 11 data points for calculating the statistics, respectively, for the two sites. Additional larger set of data is in the works now, having a potential of improving the validity of the assumptions used here. A Monte Carlo simulation technique was used to propagate the uncertainty from the input to the output parameters, describing the probability of a certain percent of mine height, surface area, or volume remaining above the mudline (proud). These output parameters are typically used by the Navy Mine Counter-Measures (MCM) forces to assess the risks of hunting, sweeping, or avoiding an area where bottom mines are suspected to have been deployed. An example of the output distributions of the percentage of the surface area of a mine proud is shown in Fig. 3, each representing 1,000 model runs. The 1,000-point realizations were a result of a sensitivity study, showing good repeatability. Further proof of this is presented in Fig. 7 and will be addressed later in the text. In order to compare the output distributions with the experimental data, the latter was represented with its Gaussian approximation, as was the input data. Limitations on the number of data points available to construct a distribution are known and will need to be addressed in the future by using a larger data set in works now. It is also viewed that the current data, albeit limited, results in important conclusions and cannot be overlooked. Moreover, the use of these data for developing the stochastic evaluation technique should not be underestimated. The diver measured final position of a cylinder after impact was measured and combined with the data from the DMU (Dynamic Measuring Unit). Thus, experimentally determined height protruding above the mudline, final pitch in mud, and percent area exposed are plotted as probability distributions in Fig. 4. Lack of data for the subsequent choice of the Gaussian probability distribution is rather obvious. This approximation, however, is adequate for a general model evaluation scheme, presented herein.
Simulation results and performance of the predictive model Results of one of the realizations are presented in Fig. 5. The figure shows two probability distributions in each one of the charts. One describes the Gaussian distribution, based on the experimentally measured data, and the other is the outcome of the model realization, represented by 1,000 runs. The left column presents results for the Corpus Christi, TX, location, designated ‘G06’, and the right one – for the Cocodrie, LA site, designated ‘P02’. The results show that the height protruding is overestimated somewhat for those mines that penetrated deeper, with the maximum height exposed of about 0.3m and also for those that penetrated far less, with the maximum height exposed in excess of 1m. The model seems to under-predict the height exposed for the intermediate range of penetrations depths. This is particularly evident for the Cocodrie location. The final pitch in the mud, as predicted by the model, is similar in its behavior to that of the height exposed. Here, the assumption of a Gaussian distribution for the experimentally measured data may be the least accurate, as the tail of the distribution extends well into the negative values, which is not supported by actual observations nor predicted by the model. Refinement in this regard is needed. Nevertheless, the current evaluation shows that the predicted distribution overestimates the final pitch for values in excess of 40 - 50 deg. and under-
6
Sixth International Symposium on Technology and the Mine Problem May 9 – 13, 2004, Naval Postgraduate School, Monterey, CA
Abelev, Valent, Barbu
estimates it for pitch between 10-20 and 40-50 deg. Since the overall prediction, judged by the narrowness of the distribution of the final pitch, is more accurate for the Cocodrie site, the ranges noted above are smaller here. Finally, the percent of area exposed is presented in Fig. 5 (c). The overall prediction appears better in the case of Corpus Christi, where the two distributions, experimental and simulated, are symmetric and collocated. In both sites the predicted distributions are narrower than those constructed from the experimentally measured data, thus under-predicting the area exposed for small and large values and over-predicting for the intermediate values. Of course, the values outside of [0,100%] range are meaningless and are a result of our choice of the assumed distribution model. An interesting observation can be made if the actual distribution of the measured values (not it’s Gaussian representation) is compared with the model output. Fig. 6 shows this comparison for the height protruding for the two locations. It appears that the output distributions, skewed to the right with its longer tail, represents the actual measured values better than they do the Gaussian representation of the measured data. This is only an estimate since very few data points are available and any further interpretation needs to be reserved for the future, when the larger experimental data set becomes available.
Risk assessment and reference probability charts One of the main difficulties in interpreting the model output, when exercised in this Monte Carlo framework, is its practical applicability and ease of use by its ultimate customer, the MCM force decision making personnel. These decision making bodies need a comprehensive, informative, yet simple representation of the analytical results that will assist them in their difficult task of estimating risks involved in hunting or sweeping for mines, or avoiding the threat area altogether. The risk reference probability charts, of the type presented in Fig. 7, could assist the MCM commanders in this regard. The charts present a relationship between the critical detection limits, currently available to the MCM force and the actual site-specific predictions, based on the Monte Carlo simulations of the parameter of interest, i.e. percent surface area buried in this example. These cumulative distribution curves describe the probability of not detecting mines that are buried more than the critical detection limit. For example, assume that the current hardware and software capability of the MCM force allows it to detect mines reliably if they are buried to no more than 50% by area. In the case of the Cocodrie location (P02), then, the probability or risk of not detecting any mines would be a very low 0.04. This is indicated by a solid line with error bars. The dashed line represent the cumulative probability form the actually measured values and is 0.1 in this case. The other case, Corpus Christi, shows that given the same detection capability, however, the result is significantly riskier, at about 0.74 that there will be mines in the area that the force cannot detect. The experimental values (0.4) in this case, differ significantly from the predicted ones, showing a poorer performance of the model and significantly overestimating the risks. The error bars plotted for the solid lines of the predicted data demonstrate the variability between 4 different realizations (1,000 runs each) in the prediction routine. The fact that these error bars are very small indicates that the number of runs was chosen appropriately, without introducing additional errors in the final predictions. Overall, the predictions for Cocodrie appear
7
Sixth International Symposium on Technology and the Mine Problem May 9 – 13, 2004, Naval Postgraduate School, Monterey, CA
Abelev, Valent, Barbu
to be better than those for Corpus Christi, as was also evident judging from the narrowness of the model and experimental distributions, described previousely.
Discussion and conclusions This paper presented results of numerical study, employing the Monte Carlo algorithm of the amount of impact burial of a large instrumented cylinder and compared it to the experimentally observed values. A statistical framework for analyzing the model results and comparison with the experimental data was described. It was observed that the model performs somewhat better in this stochastic framework than it does in the deterministic sense, where it is able to severely under- or over-estimate the amount of mine buried upon impact. Additional information can be inferred from the predictions because of the stochastic nature of representations. The significance of the proposed stochastic approach in the evaluation of buried threats is underlined and discussed in relation to the present capabilities available to a MCM force. Validity of the approach and the critical values of detectable parameters (e.g. height or surface area buried) are discussed in conjunction with the actual site-specific simulated probabilities of finding mines buried to a certain extent. The risk of not detecting a certain percentage of mines deployed, based on the relative location of an output histogram with respect to the available critical detection limit with respect to the corresponding variable, is evaluated using a reference probability chart. This chart expresses the local environmental conditions and the inherent variability of the dynamic parameters of the mines that are expected to have been deployed. These charts represent a direct correlation between the currently available detection capabilities of an MCM force and the actual risks of not detecting a certain percentage of mines deployed. It is argued that the creation of these types of charts will significantly improve the risk assessment abilities of the MCM forces for each specific location and task at hand. The proposed technique is viewed as a significant improvement in providing a better tool in the risk assessment procedures than the more often employed deterministic or averaged approach.
Acknowledgments This work is supported by the NRL Base Program, Project # BE-782-001, managed by Dr. Michael Richardson, Program Element No. 62435N. The Corpus Christi experiment was supported by the Office of Naval Research Mine Burial Program, formerly managed by Dr. Roy Wilkens, now managed by Drs. Tom Drake and Brian Almquist, under PE# 62435N. As any experimental study performed at sea, the success of this research would not be possible without the contributions of many people, including but not limited to C. Kennedy, C. King, C. Vaughn, G. Bower, M. Richardson, K. Briggs, R. Ray (all NRL), the captains and crews of R/V Pelican (Cocodrie) and R/V Gyre (Corpus Christi), and many others.
8
Sixth International Symposium on Technology and the Mine Problem May 9 – 13, 2004, Naval Postgraduate School, Monterey, CA
Abelev, Valent, Barbu
References 1.
Abelev, A.V., Valent, P.J, Plant, N.G., and Holland, K.T. (2003). “Evaluation and Quantification of Randomness in Free-fall Trajectories of Instrumented Cylinders.” Proceedings, Oceans 2003 marine technology and ocean science conference, San Diego, CA, September 22-26 (DVD-ROM).
2.
Abelev, A.V., Valent, P.J (2004). “Dynamics of bottom mine burial in soft sediments: experimental evidence and predictions.” Proceedings, Mine Countermeasures & Demining Conference, Asia-Pacific Issues & MCM in Wet Environments, 9-11 February 2004, Australian Defence Force Academy, Canberra, Australia, CDROM.
3.
Theophanis, S., 2002. “Accelerometer and Fiber Optic Gyro measurements of an Instrumented Cylinder used to study Impact Burial.” Proceedings of Oceans 2002 MTS/IEEE conference, Biloxi, MS, October 29-31.
9
Sixth International Symposium on Technology and the Mine Problem May 9 – 13, 2004, Naval Postgraduate School, Monterey, CA
Abelev, Valent, Barbu
Table 1. Cylinder configurations and initial conditions
#
Test name
Nose shape
Release medium
Height above water, m
Pitch at release, deg
Corpus Christi, TX, May 2002 1 G06md02 hemi water -0.5 horiz 2 G06md03 blunt water -0.6 horiz 3 G06md04 blunt water -1.5 31 4 G06md05 blunt air 0.5 horiz 5 G06md06 blunt water -0.8 horiz 6 G06md07 blunt water -0.8 horiz 7 G06md08 chamf water -0.6 horiz 8 G06md09 chamf water -0.8 horiz 9 G06md10 chamf water -0.6 horiz 10 G06md11 chamf water -0.6 horiz Cocdrie, LA, January 2002 11 P02md01 hemi water -0.5 horiz 12 P02md02 hemi water -0.5 horiz 13 P02md03 hemi water -0.5 31 14 P02md04 hemi air 1 31 15 P02md05 hemi air 0.5 31 16 P02md06 hemi air 1 horiz 17 P02md07 hemi air 0.2 horiz 18 P02md08 hemi water -0.5 horiz 19 P02md09 hemi water -0.5 31 20 P02md10 hemi water -0.5 31 21 P02md11 hemi air 0.2 31 Notes: Pitch of 0 deg: long axis horizontal Positive angles are nose down Chamfered noses – released with chamf-up
10
Sixth International Symposium on Technology and the Mine Problem May 9 - 13, 2004, Naval Postgraduate School, Monterey, CA
(a)
(b)
Fig. 1. General view of the instrumented cylinder with the blunt nose attached in the cradle (a) and before release (b)
(a)
(b)
Fig. 2. A typical calculated trajectory of the instrumented cylinder in free-fall (a), and a sediment penetration portion only (b). The cylinder is outfitted with the chamfered nose.
11
Sixth International Symposium on Technology and the Mine Problem May 9 - 13, 2004, Naval Postgraduate School, Monterey, CA
Fig. 3. Four realizations of the relative histograms (1,000 runs) showing the predicted percent of surface area buried for the average conditions at Cocodrie, LA.
12
Sixth International Symposium on Technology and the Mine Problem May 9 - 13, 2004, Naval Postgraduate School, Monterey, CA
(a)
(b)
(c) Fig. 4. Experimental data and its Gaussian representation of the height protruding, (a), final pitch in mud, (b), and percent area exposed, (c), for Corpus Christi (G06) and Cocodrie (P02) experiments
13
Sixth International Symposium on Technology and the Mine Problem May 9 - 13, 2004, Naval Postgraduate School, Monterey, CA
(a)
(b)
(c) Fig. 5. Distributions of the height proud, (a), final pitch in mud, (b), and percent area exposed, (c), measured by divers (representative distribution) and predicted for Corpus Christi (G06) and Cocodrie (P02)
14
Sixth International Symposium on Technology and the Mine Problem May 9 - 13, 2004, Naval Postgraduate School, Monterey, CA
Fig. 6. Comparisons of distributions of measured and predicted height proud for Corpus Christi (G06) and Cocodrie (P02)
Fig. 7. Reference probability charts, based on simulated (solid) and experimentally measured (dashed) percentage of surface area buried, for Corpus Christi (G06) and Cocodrie (P02)
15