high schools to investigate issues related to Indigenous and non-Indigenous students at risk of .... stomach-aches (Gresham, Lane, MacMillan, & Bocian, 1999).
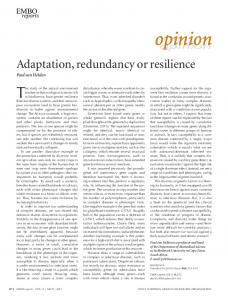
Risk or Resilience? What Makes a Difference? Helen J Boon James Cook University
Abstract Dropping out of school has been associated with a student’s ethnicity, socioeconomic status, challenging behaviours and low academic achievement. This paper describes research conducted with 1050 students aged 12-15, in three North Queensland urban high schools to investigate issues related to Indigenous and non-Indigenous students at risk of dropping out of school before gaining adequate qualifications. A path-analytic model was developed to assess the influence of socio-demographic, structural family and behavioural factors upon low academic achievement, the strongest predictor of dropping out of school. The specific hypothesis tested was that challenging behaviour, indexed by suspensions, predicts low academic achievement or at-risk status, more strongly than SES or family structure variables. Results indicate that for both Indigenous and non-Indigenous students, suspensions are a stronger predictor of low achievement than socioeconomic or family factors. Moreover, a model testing low achievement as a precursor to suspensions was not supported. Suggestions for future practice and research are proposed.
Introduction Headlines in Brisbane’s Courier-Mail on November 17th 2003 (Odgers, 2003) reported that 30 students are permanently excluded from Queensland government schools every week. This approximates to 1200 exclusions per year. Exclusions are strong indicators of a student at risk of dropping out of school (Batten & Russell, 1995). This paper reports results from an investigation into some of the factors associated with dropping out of school in two secondary school populations, Indigenous and nonIndigenous students. Students who drop out of school before completing their secondary education have been a cause for ongoing concern among educators, parents and the community at The Australian Educational Researcher, Volume 35, Number 1, April 2008
•81
HELEN J. BOON large for a considerable time. Students might fail to complete their secondary education because they are disaffected with school. This disaffection has a number of manifestations including, absenteeism, disruptive classroom behaviour, and exclusions or suspensions from school. Students who leave school early have been shown to have an overall poorer quality of life, evidenced by a range of marginalised employment opportunities (McMillan & Marks, 2003), delinquent activities (Lane, 1999; Hinshaw, 1992; Rutter, Giller, & Hagell, 1998), and psychological, social and financial adjustment issues (Chamberlain & MacKenzie, 1996). A student perceived to be disaffected is said to be at-risk (Batten & Russell, 1995). The urgency of the issue is reflected in the number of students at risk of dropping out. This number is estimated by looking at apparent retention rates. These rates report the total number of students who stay on at school from Year 8 through to Year 12. Students at-risk, those who did not complete Year 12, are then estimated from these figures. Rothman (2004) summarized Australian retention trends: In 1967, the apparent retention rate in Australian schools was 22.7 percent. Over the next eight years, this rate grew to 34.1 percent, and then remained close to that point until 1982, when it began to increase again. Over the following ten years, the rate more than doubled, growing from 36.3 percent in 1982 to 77.1 percent in 1992. The rate peaked in 1992, and has remained above 72 percent into the 2000s. In 2002, the Year 7-12 apparent retention rate was 75.1 percent. (p. 113) The overall retention rate in Australia was 75.7 percent in 2004, while for Indigenous students it was only 39.5 percent, an increase from the 1993 Indigenous retention level of 25 percent (ABS, 2004). Although these rates show improvement, in a context where the compulsory phase of schooling in Australia determines that from 2006 an adolescent must complete Year 10, or remain in school until the age of 16, they are not good enough (Hill, Dawes, Boon & Hillman, 2005). We need to find ways to transform risk to resilience. To do that we need to know what renders students atrisk, and what characterises resilience. Neither of these questions is new. In 2000, Jimerson, Egeland, Sroufe and Carlson stated: Five decades of research have uncovered numerous correlates of withdrawal from high school. Prior research highlights various demographic status variables, individual characteristics, psychological and behavioural measures, and family factors associated with high school drop out. They are now well known but not always useful. (p. 526)
82 •
RISK OR RESILIENCE? Reference to youth and children at-risk first came into wide use in the 1980s. Originally this referred to dangerous environments, such as disrupted families and dysfunctional schools. But terms like at-risk adolescents and high risk behaviour shifted the focus from how to build supportive environments to finding supposed defects in the adolescent. Those who labelled youth as “violent” or “predators” created a fear of dangerous adolescents while letting adults off the hook (Males, 1996). Thomson (2002) contends that analyses of “risk” are chosen from models structured around individual student cases or “the social, cultural, economic, political and institutional processes and practices in which these young people are collectively positioned” (p. 64). Thomson (2002) further contends that by focusing on individual student attributes policymakers and researchers omit to account for the socio-cultural and political conditions, often spanning several generations, responsible for constructing the at-risk trajectory. Views reflecting Thomson’s (2002) perspective have a long history. Radical sociologists like Willis (1979) for example, similarly argued that working-class, black and female students were denied equality of educational opportunity and that community and family deficits were not the causes of being at-risk. Twenty years later structural inequality still pervades students’ academic outcomes, as demonstrated by international empirical findings that consistently show a positive correlation between measures of socio-economic status (SES) and school achievement (e.g., OECD, 2001). However, not all socially disadvantaged students are at-risk and, conversely, not all advantaged students are academically successful. Although social inequalities are likely to be a persistent source of frustration for educators, parents, sociologists and even some politicians, psychologists espouse a more optimistic, proactive view: a view that offers the opportunity for timely local support at the individual level, while the remote wheels of social, educational and curricular reform grind very slowly onwards. For as Teese (2001) revealed in his detailed review of curricular ‘reform and counter reform’: “even major changes in systems of subjects, thorough revision of content and varied assessment methodologies produce little discernible impact on social patterns of (academic) results” (p. 194).
Low academic achievement, resilience, challenging behaviour and dropping out of school Several important factors that lead to dropping out of school have been identified. Of these, low academic achievement has been consistently found to strongly predict dropping out of school (e.g. Battin-Pearson, Newcomb, Abbott, Hill, Catalano, & Hawkins, 2000; Bradley, 1992). McMillan and Marks (2003), reporting on student
•83
HELEN J. BOON dropouts in Australia, concluded: “Not only are low achievers more likely to leave school early, they are among the first to do so” (p. 86). It might be tempting to believe that low academic achievement is due to low ability levels. Conceding that cognitive ability, as measured by IQ scores, has a strong relationship with measures of achievement (e.g. Yen, Konold, & McDermott, 2004; Reynolds, Lowe & Saenz, 1999), empirical evidence has demonstrated learning behaviour, marked by attentiveness, persistence and engagement with a learning task, adds substantially to the prediction of higher academic achievement (e.g. Yen, Konold, & McDermott, 2004). Research conducted in Australia in a school for students at-risk characterised by low academic achievement showed that 57 percent of students had average IQs while 30 percent had above average IQs (Candy & Baker, 1992). Similarly, researchers from the United Kingdom concluded that students in pupil referral units lacked suitable motivational and coping strategies to support their learning, not cognitive ability (Solomon & Rogers, 2001). Moreover, meta-analysis of several research studies has led American researchers to deduce that IQ accounts for only 25 per cent of the variance in schooling outcomes (Sternberg, Grigorenko, & Bundy, 2001). Therefore, (low) academic achievement, the most important factor in predicting dropping out of school, is strongly linked to motivational behaviours. These behaviours are fostered in the environments in which students participate. These environments, home, school, communities, can enhance behaviours that lead to either an at-risk trajectory or academic resilience. An urgent task for educators, counsellors, and social workers is to understand the issues surrounding students atrisk due to low achievement in order to support them in the path to resilience. Resilience is characterised by academic success where socio-economic and structural family factors would predict failure (Gordon Rouse, 2001). More recently, Schoon (2006) defined resilience as academic attainment in the face of socioeconomic adversity. Socioeconomic adversity is a major risk factor acknowledged to influence childrens’ and adolescents’ social and emotional functioning, as well as their cognitive competence. For Schoon (2006) socioeconomic adversity is represented by “living conditions, characterised by low social status, poor housing, overcrowding, and lack of material resources” (p. 9). Studies of adolescent resilience highlight a number of personal, biological and psychological factors. Resilient adolescents are more socially responsible, friendly, with excellent social skills, (Garmezy & Rutter, 1983; Werner, 1993), independent, and cognitively and academically superior to their counterparts (Werner, 1990). In other words, they are well adjusted to and able to meet the demands of school and society. It is this adjustment to school that is of concern to this study. Resilient students also have support from a parent or significant other to assist them to meet challenging
84 •
RISK OR RESILIENCE? situations. Lack of such support has been claimed to place young Australians at risk of failure (Withers & Batten, 1995). One indicator of adjustment to school is challenging behaviour leading to and measured by suspensions (Jimerson et al., 2000). Challenging behaviour, often exhibited by students at-risk, is broadly divided into two: externalizing, where problems are directed towards others and the environment, and internalizing, where problems turn inwards towards the self. Externalizing behaviours typically involve an acting-out style of responding that includes a repertoire of behaviours such as aggression, arguing, impulsivity and disobedience. On the other hand, internalizing behaviours withdraw the student from participation and may lead to absenteeism. These students often experience emotional difficulties such as anxiety, phobias, fearfulness, depression, loneliness and somatic symptoms like headaches and stomach-aches (Gresham, Lane, MacMillan, & Bocian, 1999). Internalizing and externalizing behaviours result in frequent referrals and suspensions. McEvoy and Welker (2000) contend that academic failure and challenging behaviours exist in a reciprocal relationship, exacerbated within the context of ineffective school practices.
Developmental perspectives surrounding risk and resilience issues Factors cited as instrumental to an at-risk trajectory such as low academic achievement and externalising behaviours do not necessarily act independently but may reinforce each other or set up conditions that predispose risk or resilience. For example, after a low test result, an adolescent may increase their effort to improve scores or may withdraw from academic work, depending upon the influence of particular family or school contexts, the interaction between them, or the interaction between the adolescent and either or both contexts. Academic withdrawal, or disengagement, might lead to behaviours that predispose suspensions. Developmental psychologists view risk as resulting from the reciprocal interchanges between a child/adolescent and their social network of family, school, peers, and community (Bronfenbrenner, 1986). The contexts where students participate, including school and home, contain many social interactions that contribute to identity formation. It is here, at the micro level, that academic resilience can be fostered. Empirical work suggests that parenting is highly instrumental in promoting healthy adjustment or behaviour problems in children. Furthermore, Christenson, Hurley, Sheridan and Fenstermacher (1997) assert that variables related to parental attitudes and behaviour are more important than SES in predicting academic achievement. For example, Kelley, Brownell, and Campbell (2000) demonstrated that maternal positive
•85
HELEN J. BOON feedback predicted the child’s later persistence in tackling academic tasks, and maternal guidance resulted in less avoidance of challenging tasks a year later. Parental behaviour, and in turn academic success, appears to be linked to family structure. An extensive literature review conducted in Great Britain to assess the impact of parental involvement on achievement supports the notion that parenting processes, which are linked to maternal education, SES, and family structure, mediate student achievement even when all the other factors shaping attainment are controlled (Desforges & Abouchaar, 2003). The authors conclude that parenting influences academic achievement indirectly by shaping the child’s self-concept as a learner and through communicating high aspirations for the child. A lack of suitable parenting may result in externalising or internalising problems, leading ultimately to suspensions and dropping out of school (Lamborn, Mounts, Steinberg, & Dornbusch,1991). In sum, not only do structural family factors and behaviours influence risk and resilience in adolescents, but also the cultural context of those interchanges is likely to be highly implicated in shaping those interactions. It is for this reason that substantial differences might be apparent between Indigenous and non-Indigenous students’ interactions with, and adjustment to, the school environment leading to academic resilience or an at-risk trajectory.
Study Aims The current study aims to validate previous work conducted with students at-risk in the United States (Jimerson et al., 2000) and in Australia (Candy & Baker, 1992). This work suggests the most proximal predictor of dropping out of school is challenging behaviour because it is highly linked to low achievement, the strongest predictor for dropping out (Battin-Pearson, Newcomb, Abbott, Hill, Catalano, & Hawkins, 2000; Bradley, 1992). In this study, challenging behaviour is indexed by suspensions. The hypothesis tested is that challenging behaviour, indexed by suspensions, predicts low academic achievement or at-risk status, more strongly than SES and family structure variables. Because behaviour is a product of current circumstances and prior developmental history (Rutter, 2002; Jimerson et al., 2000) students in Years 8 to 10 are included in order to test the hypothesis that there is a greater tendency to become at-risk, and therefore drop out, in the later years of high school. In addition, because of the widening gaps between Indigenous students’ literacy and numeracy compared to other Australian students (Miller & Spooner, 2004), the analyses are applied separately to the two samples of students, Indigenous and non-Indigenous, in order to compare and contrast differences and similarities between the two groups. Reviewing contemporary Indigenous research in Australia, Mellor and Corrigan (2004) have 86 •
RISK OR RESILIENCE? argued there is a dearth of empirical quantitative research within the Indigenous education literature. They note that the research methodology employed in current studies is limited by its focus on small case studies derived from communities with a high Indigenous population, thus isolating Indigenous education research from the broader discourses of disciplines such as psychology, sociology and health.
Methods Participants The sample consisted of 1127 Year 8-10 students, aged 12-15, from three state high schools in a regional city in North Queensland, Australia. In order to maximise student participation, parents were sent letters informing them of the study and requesting that parental permission forms were to be returned only if they did not wish their child to participate. The resulting sample represented 81 % of the students enrolled in the schools present on the days data were collected. Self-report questionnaires were completed during a 45 minute class period between two and four weeks after midyear report cards were sent to students. 1050 complete questionnaires were obtained; the remaining 77 surveys were randomly missing either names or various parts and so were not included. The principal researcher randomly checked 15% of the student responses for accuracy with the participating schools as students supplied their names on the questionnaire. Measures Since academic achievement is used as the index of at-risk status, students were separated into two groups for all preliminary analyses according to their English and mathematics grades: not at-risk (grades “C” and above) and at-risk (grades below “C”). 1)
Academic achievement: English and mathematics mid-year grades are recorded as grades following the approach used by Paulson, Marchant and Rothlisberg (1998). The grades are coded Very limited (E), Limited (D), Sound (C), High (B) and Very high (A) (reverse coded for use in the structural equation modelling analyses). Achievement scores of D-E for English and mathematics are used to construct the category of students at-risk. These students comprise 19.8 % of the sample used in this study.
2)
Suspensions (challenging behaviour): Students reported the number of times they were suspended. These were coded: never suspended (0), suspended (1).
3)
Socioeconomic and family structure variables: Paternal and maternal employment were recorded as (0) for unemployed and (1) for employed. Paternal and maternal education was coded as (0) for •87
HELEN J. BOON education only up to high school and (1) for graduate level and above for each parent following the approach used by Richters and Martinez (1993). 4)
Family structure: Living arrangements: if living with both biological parents, (1) any other blended family combination (0) following Astone and McLanahan’s (1991) approach.
5)
Year level: Year 8 coded (0); Years 9/10 coded (1). This grouping was formed to enable structural equation modelling of three possible categories. The variable was included because chi-square tests showed non-Indigenous students in Years 9/10 were significantly more likely to be at-risk than those in Year 8 (Table 3). The percentage of Indigenous students being at-risk also increased with each successive year at school, though, perhaps due to the smaller sample size, results of chi-square tests of association were not significant (Table 4).
Results The SPSS program was used to perform all statistical analyses while the structural equation path models (SEM) were developed using the AMOS 6.0 program (Arbuckle & Wothke, 1999). Tables 1 and 2 show the distribution of achievement grades for both samples and the distribution of suspensions associated with each achievement grade. Tables 3 and 4 provide a summary of participant characteristics. Chi-squared association tests were performed to assess the strength of relationship between structural or behavioural factors and academic achievement. The results of these tests are shown in Tables 3 and 4 (χ2/, Fisher’s exact statistic). As gender was not found to be significantly linked with academic failure in either group it was not investigated further. Notable differences between the two groups include the observation that Year 9 and 10 non-Indigenous students had higher levels of failure than Year 8 students, perhaps showing a developmental trend. Higher paternal education did not reach significance in Indigenous students. This was not the case for non-Indigenous students for whom lower paternal education was linked to being at-risk. Suspensions and family structure were most highly linked to academic failure for both groups, with intact biological family structure being a protective factor against academic failure. The next step in the analysis was to fit these variables into an SEM model to account for the relationship between socioeconomic variables, suspensions, year level and being at academic risk.
88 •
RISK OR RESILIENCE?
Grades
Indigenous
English
N
%
N
%
E
8
7.8
27
2.9
D
17
16.5
88
9.3
C
44
42.7
389
41.1
B
25
24.3
318
33.6
A
9
8.7
125
13.2
103 Total (N) Mathematics
Non-Indigenous
947
E
12
11.7
39
4.1
D
25
24.3
135
14.3
C
37
35.9
295
31.2
B
20
19.4
226
23.9
A
9
8.7
252
26.6
103
Total (N)
947
Table 1: Academic achievement of Indigenous and non-Indigenous students
Grades
English
Mathematics
Indigenous Suspension
Non-Indigenous Suspension
Never %
Suspended %
Never %
Suspended %
E
12.5
87.5
40.7
59.3
D
47.1
52.9
55.7
44.3
C
77.3
22.7
84.8
15.2
B
96.0
4.0
90.3
9.7
A
55.6
44.4
90.4
9.6
E
16.7
83.3
35.9
64.1
D
60.0
40.0
66.7
33.3
C
75.7
24.3
82.0
18.0
B
95.0
5.0
93.8
6.2
A
88.9
11.1
92.1
7.9
Table 2: Suspensions by achievement level for Indigenous and non-Indigenous students
•89
HELEN J. BOON
Student Characteristic
Not At-risk
At-risk
N
%
N
%
χ
dƒ
p
Variance
2
Student Sex
Male Female
97 84
20.7 17.5
371 395
79.3 82.5
1.55
1
.212
(NS)
Family
Non-intact Family Biological Intact Family
98 83
27.8 13.9
254 512
72.2 86.1
27.6
1
.001
17.1
Year Level
Year 8 Year 9 Year 10
45 54 82
13.2 18.9 25.6
296 232 238
86.8 81.1 74.4
16.5
2
.001
13.1
Father's Education
Non-graduate Graduate
161 20
22.3 8.9
561 205
77.7 91.1
20.0
1
.001
14.5
Mother's Education
Non-graduate Graduate
156 25
23.1 9.2
519 247
76.9 90.8
24.3
1
.001
16.0
Suspensions
Never Suspended Suspended
103 78
13.0 49.7
687 79
87.0 50.3
113.8
1
.001
35.0
Father's Work
Unemployed/ Don't Know Employed
39 142
29.5 17.4
93 673
70.5 82.6
10.8
1
.001
11.0
Mother's Work
Unemployed/ Don't Know Employed
65 116
28.4 16.2
164 602
71.6 83.8
16.8
1
.001
13.3
181
19.1
766
80.9
Total
Table 3: Demographic characteristics non-Indigenous students (N= 947)
Structural equation modelling (SEM) strategy The primary purpose of the study was to examine the structural relationships between low achievement (at-risk) and sociodemographic and behavioural predictors and to evaluate the extent to which these hold across the two ethnic groups. Structural equation modelling is also known as covariance structure modelling and simultaneous equation modelling. SEM is very useful for multi-sample modelling, wherein a model is fit simultaneously to sample data from different populations (MacCallum & Austin, 2000). SEM also helps to overcome the problems associated with the effects of measurement error and correlated measurement error on the outcome variable (Baron & Kenny, 1986) which attenuate the estimation of relationships between observed variables (Kline, 1998; Maruyama, 1998). Multiple predictor variables can be simultaneously modelled and their relative contribution to the outcome variable estimated, resulting in a more accurate weighting of influences for a particular outcome. This is not possible with association tests preformed for each predictor variable. Moreover, SEM techniques developed over the last two decades permit the use of dichotomous categorical predictor variables in a model without the need to employ more complicated logistic regression models (Joreskog & Sorbom, 1984; Muthen, 1984). Where data is not continuous, as in the case with suspensions, 90 •
RISK OR RESILIENCE? SEM provides a valuable analytical tool by permitting the use of dichotomous variables. The assumption of multivariate normality need not apply to the exogenous (measured) variables (Bollen, 1989, pp. 126-28). However, lack of multivariate normality usually inflates the chi-square fit statistic such that the possibility of the model being rejected due to Type I error is increased (Kline, 1998). While causality is not confirmed by SEM techniques, since the data are not longitudinal, the model shows the relative contribution of each exogenous variable to the outcome variable, being “at-risk”.
Student Characteristic
Not At-risk
At-risk
χ
2
dƒ
p
Variance
Fisher’s Exact Test
N
%
N
%
Student Sex
Male Female
15 22
37.5 34.9
25 41
62.5 65.1
.07
1
.790
(NS)
Family
Non-intact Family Biological Intact Family
29 8
46.8 19.5
33 33
53.2 80.5
7.97
1
.005
28.0
Year Level
Year 8 Year 9 Year 10
11 15 11
28.9 34.1 52.4
27 29 10
71.1 65.9 47.6
3.34
2
.188
(NS)
Father's Education
Non-graduate Graduate
35 2
37.6 20.0
58 8
62.4 80.0
1.22*
1
.324
(NS)
Mother's Education
Non-graduate Graduate
35 2
39.3 14.3
54 12
60.7 85.7
3.30
1
.069
18.0
Suspensions
Never Suspended Suspended
18 19
25.0 61.3
54 12
75.0 38.7
12.4
1
.001
35.0
Father's Work
Unemployed/ Don't Know Employed
16 21
50.0 29.6
16 50
50.0 70.4
4.0
1
.046
20.0
Mother's Work
Unemployed/ Don't Know Employed
18 19
43.9 30.6
23 43
56.1 69.4
1.9
1
.170
(NS)
37
35.9
66
64.1
Total
*Fisher's exact test used as cells have expected count of less than 5.
Table 4: Demographic characteristics of Indigenous students (N=103)
Various fit statistics are used to evaluate the models. Because the chi-square fit index is highly sensitive to sample size, overall model fit was also assessed by examining the Comparative Fit Index (CFI; Bentler, 1990) and the Goodness-of-Fit Index (GFI), for which values of .90 or greater are considered adequate (Byrne, 2001). Observed exogenous variables were allowed to co vary. The resulting model, Model 1, applied to the non-Indigenous students (N=947) is shown in Figure 1. The variance accounted for by this model is 31%, with suspensions the strongest predictor of being at-risk •91
HELEN J. BOON (standardised regression weight β = .30). Model fit indices are presented in Table 5. These represent excellent model fit. A non-recursive model developed to test whether low achievement predicts suspensions was not statistically supported.
Year Level .14*
.01 .03
Father’s Education
-.17* R2=.31
.04
.64 -.11
At-risk
Suspensions
.42
.04
Maths
.69 .47
-.18*
-.10
English
.17
.02
.80
.30*
Mother’s Education
-.18
-.14*
.10 .09
-.14*
-.17 Family
.19 .13
Mother’s Work
Figure 1: Model 1 Relationships between socioeconomic and structural variables and being at academic risk for non-Indigenous students (N=947), showing standardized regression weights and total variance (R2) for being at academic risk, *p