ence on the HRV indices of ectopic beats manifesting in two or more side lobes was eliminated. 3. Results. During the follow-up interval, fourteen patients (group.
Risk Stratification in Advanced Heart Failure Using Lorenz Plot Indices of Heart Rate Variability HD Esperer1,2 , HC Esperer1 , JB Chernyak1 1
2
Harvard-MIT, Cambridge, MA, USA Otto-von-Guericke-University, Magdeburg, Germany
Abstract
have become possible through measurement of heart rate variability (HRV). Several clinical studies have indeed suggested that decreased HRV provides valuable prognostic information in CHF patients [5, 6, 7]. However, there have also been conflicting results [8, 9]. The goal of this study was to test the hypothesis that quantitative HRV indices derived from two-dimensional Lorenz plots are useful in improving risk prediction in patients with advanced CHF.
The availability of powerful but expensive therapeutic means necessitates optimization of risk stratification of patients with advanced heart failure for both medical and economic reasons. Traditional methods of heart rate variability have been suffering from low predictive accuracy regarding identification of patients who are at high risk of cardiac death. We showed that Lorenz plot based heart rate variability indices are useful in significantly improving risk stratification in patients suffering from advanced heart failure.
1.
Introduction
Methods
2.1.
Patients
Between January 1999 and December 1999, fifty consecutive patients were screened who were admitted to our institution with the symptoms of severe CHF. They were entered into the prospective study if they fulfilled the following criteria:
Despite major advances in the prevention and treatment of cardiovascular diseases, in the United States and other Western countries, the results of the Framingham study indicate that the incidence and prevalence of congestive heart failure (CHF) have been significantly increasing in recent years. At present, over 400,000 new cases of CHF are diagnosed each year, and Americans spend over $ 17 billion annually on treatment for CHF [1]. Although novel drugs have been shown to prolong survival in this population, heart transplantation (HTX) presently remains the only long-term alternative for those who are suitable candidates. Unfortunately, up to 40% of the patients awaiting HTX are estimated to die suddenly [2]. Although powerful therapeutic means, such as the implantable cardioverter defibrillator (ICD) or biventricular pacing (BVP) devices have become available for bridging the waiting time, the extreme costs and possible complications of these procedures call for an optimization of risk stratification. Given the fact that, in CHF patients, impaired control of the cardiac autonomic nervous system (CANS) is one of the most important pathophysiologic changes correlating with the severity of CHF and its increased mortality rate [3, 4], it seems logical to determine the degree of CANS alterations for prognostic reasons. In recent years, non-invasive monitoring of CANS changes
0276−6547/04 $20.00 © 2004 IEEE
2.
1. Significantly depressed left ventricular pump function (LVEF < 40%) 2. Stable sinus rhythm 3. Absence of pacemaker dependence 4. Absence of concomitant malignant disease Overall, thirty-six patients were eligible for this study and prospectively followed over a mean follow-up interval of 48 ± 18 months for the occurrence of a combined arrhythmic and mechanical endpoint defined as: 1. Sudden arrhythmic death or documented VT necessitating ICD implant, or 2. Hemodynamical deterioration necessitating BVP or HTX At the first hospital admission, each patient underwent complete cardiac work up including left heart catheterization and coronary angiography. Left ventricular ejection fraction was determined from the left ventriculogram using the single-plane (RAO) method. Each patient also underwent 24-hour Holter monitoring, from which twodimensional Lorenz plots were generated. Clinical characteristics of the patients are summarized in Table 1.
209
Computers in Cardiology 2004;31:209−212.
Table 1. Patients’ Characteristics at First Admittance Age
50 ± 10 years
Male : Female ratio
36 : 0
LVEF
25 ± 6%
NYHA Class II III IV
Functional
Ischemic Cardiomyopathy Primary Dilated Cardiomyopathy Medical Therapy ACE Inhibitors Diuretics Digitalis Nitrates β-Blockers Ca2+ Blockers Amiodarone
2.2.
10 (27.7%) 24 (66.7%) 2 (5.6%)
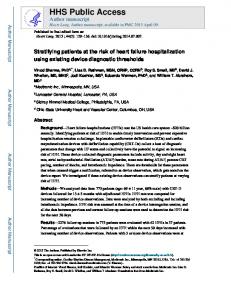
Figure 1. Definition of the LP-based HRV indices Lmax and Wmax
22 (61.1%)
jection on a line perpendicular to bisector: Wmax (Fig. 1) The Lorenz plot was represented in the coordinate system (x, y) which was rotated 45◦ counterclockwise and given by: Tk + Tk+1 √ xk = 2 Tk+1 − Tk √ yk = 2
14 (38.9%)
34 (94.0%) 30 (83.3%) 19 (52.8%) 15 (41.7%) 3 (8.3%) 3 (8.3%) 3 (8.3%)
where Tk and Tk+1 are the kth and the (k + 1)th R-R intervals. Maximal length of the LP shape was determined by calculating the cumulative density function of R-R intervals scattered parallel to the LP bisector (Fig. 1, left panel). Lmax was defined as the difference yk0.95 − yk0 , where yk0.95 was defined as the x-value when the magnitude of the sigmoidal function f (yk ) reached 95% of its maximum, and y0 designates a preset threshold value defining the point of origin of the measurement (Fig. 2, left panel). By analogy, Wmax was defined as the difference xk0.95 − x0 , where xk0.95 represents the x-value at which the sigmoidal function f (xk ) reached 95% of its maximum, and x0 represents a preset threshold value defining the lateral starting point of measurement (Fig. 2, right panel). In the case of additional side lobes (Fig. 3, right panel), only the central data point cloud was scanned and its maximal length and width determined. Thus, the influence on the HRV indices of ectopic beats manifesting in two or more side lobes was eliminated.
Holter analysis
Holter monitoring was performed using a Tracker II or III recorder (Reynolds Medical, Hartford, UK). Only tapes with at least 22 hours artifact-free recording time were accepted for further analysis. The tapes were scanned on a Pathfinder 700 analyzer (Reynolds Medical. Hartford, UK) and arrhythmia frequency and the HRVindex [5] were assessed. Arrhythmias were deemed frequent, if their incidence exceeded 10% of the total count of normal QRS complexes. For the assessment of the LP-based HRV indices, the R-R interval data were transferred to a PC and converted into ASCII format. Thus, from each patient a 24-hour R-R series was obtained and a two-dimensional Lorenz plot (LP) was constructed thereof by plotting each R-R interval against its preceding neighbor.
2.3.
3.
Lorenz plot analysis
Results
During the follow-up interval, fourteen patients (group A) experienced an endpoint, which was arrhythmic in nine, and mechanical in five cases, while the clinical status of the remaining twenty-two patients (group B) improved significantly or remained stable after optimization of medical therapy. Group A and B patients did not differ with respect to age or HRVindex, respectively. In contrast, group A patients showed significantly smaller values for both Lmax
For LP analysis we developed a dedicated software program that allowed for automatic assessment of the following geometric indices of the LP data points, which we used as HRV indices. 1.Maximal length of the LP shape projection on bisector: Lmax (Fig. 1); 2.Maximal width of the LP shape pro-
210
controversial results obtained in previous studies investigating the prognostic value of various time and frequency domain HRV indices [7, 8, 9]. In contrast, Lorenz plot derived HRV measures are demonstrated to be much more robust against artifacts and ectopic beats. Nevertheless, different LP analysis methods may yield different results. For example, Bonaduce et al. [7] were unable to find any independent or incremental prognostic value for HRV as assessed by Poincar´e (i.e. Lorenz) plots, whereas other authors [6, 8, 9] did. While Woo et al. [6, 9] and Brouwer et al. [8] used qualitative criteria for assessment of LP based HRV, Bonaduce and co-workers [7] used the quantitative LP indices SD1 and SD2. The latter, by definition, represent the short (SD1) and the long (SD2) diameter of an ellipse, which is fitted to the LP data point cloud in such a way that the ellipse’s center coincides with the center of inertia [10, 11]. Although, these indices may capture the geometry of a LP showing a torpedo pattern fairly well, they will not be able to correctly account for the shape of a comet pattern, especially if the comet exhibits a significant asymmetry (Fig. 3). In contrast, the indices Lmax , and Wmax , which we used in this study, do account for the important geometrical LP features of the various torpedo and comet morphologies observed in the CHF patients.
Figure 2. Principle of the automatic determination of Lmax and Wmax . Left panel: cumulative density function of R-R data points scattered parallel to LP bisector. Right panel: cumulative density function of R-R data points scattered perpendicular to bisector. and Wmax as compared to the patients in group B. Furthermore, significantly more patients of group A exhibited frequent ventricular premature depolarizations (VPDs) compared to group B. Both LP indices were significantly correlated with the patients outcome. A cut-off value of 1000 ms for Lmax , and 190 ms for Wmax yielded the best results regarding endpoint prediction through either index. Combination of both indices to the composite marker
5.
The results of this study suggest that the quantitative Lorenz plot indices Lmax and Wmax may be valuable prognostic markers in advanced heart failure and could be used to tailor an individual therapeutic approach for these patients.
Lmax ≤ 1000ms&Wmax ≤ 190ms improved risk prediction even further (Table 3).
4.
Conclusions
Discussion
References
The results of this study show that quantitative HRV indices derived from two-dimensional Lorenz plots may be a valuable tool for risk stratification of patients with advanced CHF. In contrast, time domain HRV indices, such as the HRVindex may not prove helpful in this context. An explanation for this is that, in our study, group A patients had significantly more episodes of frequent ventricular premature beats (Table 2), which may have affected the HRVindex. In fact, it is well known that non-linear indices of HRV, such as SDNN and HRVindex, are significantly compromised in the presence of both frequent supraventricular and ventricular ectopy leading to false-positively high values [5]. Therefore, it is highly likely that, in our group A patients, the true value of the HRVindex was obscured by the higher incidence of frequent ventricular ectopics impairing the prognostic value of this HRV measure. Thus, the observation that patients with advanced CHF very frequently present with a high incidence of ventricular arrhythmias may, besides other factors, such as different underlying pathologies, at least partially explain the
[1]
[2]
[3]
[4]
[5]
211
Lloyd-Jones DM; Larson MG; Leip EP; Beiser A; D’Agostino RB; Kannel WB; Murabito JM; Vasan RS; Benjamin EJ; Levy D. Framingham heart study. Circulation. lifetime risk for developing heart failure: the Framingham heart study. 106(24),2068–72, 2002. Desphande S; Akhtar M. Sudden cardiac death: Magnitude of the problem. Sudden cardiac death. Past, present and future, 1–27, 1997. Kienzle MG; Ferguson DW; Birkett CL; Myers GA; Berg WJ; Mariano J. Clinical, hemodynamic and sympathetic neural correlates of heart rate variability in congestive heart failure. 69,761–717, 1992. Hadase M; Azuma A; Zen K’ Asada S; Kawasaki T; Kamitani T; Kawasaki S; Sugihara H; Matsubara H. Very low frequency power of heart rate variability is a powerful predictor of clinical prognosis in patients with congestive heart failure. Circ, 68,343–247, 2004. Task force of the european society of cardiology and the north american society of pacing and electrophysiology. heart rate variability. standards of measurement, physiolog-
Figure 3. Principles of automatic Lorenz plot analysis. Left panel: maximal length and width of the comet shape are scanned. Right panel: only the central torpedo shape (inside ellipse) is scanned for Lmax and Wmax assessment leaving out the three side lobes, which represent ventricular premature depolarizations. Table 2. Comparison of A and B patients Age HRVindex Lmax Wmax Frequent VPD
Group A (n = 14) 48 ± 10 years 25.5 ± 10.8 T. U. 794 ± 238ms 173 ± 69ms 9 / 14 (64%)
Group A (n = 22) 50 ± 12 years 32.5 ± 12.3 T. U. 1104 ± 401ms 306 ± 150ms 4 / 22 (18%)
p (U ) n. s. n. s. 0.02 0.02 0.01
Table 3. Diagnostic performance of the LP-based HRV indices in endpoint prediction Sensitivity Specificity Positive PV Negative PV
Lmax ≤ 1000ms 93.0% 50.0% 57.1% 86.7%
Wmax ≤ 190ms 86.0% 68.2% 63.2% 88.2%
ical interpretation, and clinical use. Circulation. 93,1043– 1065, 1996. [6] Woo MA; Stevenson WG; Moser DK; Trelease RB; Harper RM. Patterns of beat-to-beat heart rate variability in advanced heart failure. Am Heart, 123,704–710, 1992. [7] Bonaduce D; Petretta M; Marciano F; Vicario M LE; Apicella C; Rao MAE; Nicolai E; Volpe M. Independent and oncremental prognostic value of heart rate variability in patients with chronic heart failure. Am Heart, 138,273–284, 1999. [8] Brouwer J; van Veldhuisen DJ; Man In’t Veld AJ; Haaksma J; Dijk A; Visser KR et al. Prognostic value of heart rate variability during long-term follow-up in patients with mild to moderate heart failure. Am Coll Cardiol, 28,1183–1189, 1996. [9] Woo MA. Use of heart rate variability in special populations. Sudden Cardiac Death: Past, Present, and Future. Armonk, NY, 163–185, 1997. [10] Marciano F; Migaux ML; Acanfora D; Furgi G; Rengo F. Quantification of poincar´e maps for the evaluation of heart rate variability. IEEE Proc Comp Cardiol, 21,577–580, 1994. [11] Tulppo MP; Maekikallio TH; Sepp¨anen T; Laukkanen
Lmax ≤ 1000ms&Wmax≤190ms 86.0% 73.0% 67.0% 89.0%
RT; Huikuri HV. Vagal modulation of heart rate during exercise: effects of age and physical fitness. Am J Physiol Heart Circ Physiol, 274,H424–H429, 1998.
212