Risk-Tolerant Heuristic Scheduling for Trusted Grid Computing on Realistic Platforms* Shanshan Song, Student Member, IEEE, Yu-Kwong Kwok, Senior Member, IEEE, and Kai Hwang, Fellow, IEEE Abstract: Realistic platforms for Grid computing face security threats from the network attacks. Heterogeneous clusters in the open Grid are likely working in different autonomous domains (ADs). Grid jobs dispatched across the ADs are thus subject to unexpected failures or long delays due to wide-area insecurity. This hinders Grid job scheduling and outsourcing to remote sites. Unfortunately, this problem was largely ignored in the past. In this paper, we close up the gap by specifying several risk modes to model various levels of risky conditions in Grid sites. Then we propose three resilient strategies: preemptive, replication, and delay-tolerant for designing security-assured heuristic scheduling algorithms. The relative performance of these algorithms is evaluated by the NAS and PSA benchmarks. We measure the makespan, average turnaround time, Grid utilization, slowdown ratio, and job failure rate to evaluate heuristic algorithms. Kiviat graphs are used to demonstrate the highest performance of two delay-tolerant algorithms. Two replication algorithms rank the next, followed by two preemptive algorithms. The conservative algorithm has the lowest performance. These findings suggest that it is more resilient for the global job scheduler to tolerate job delays by calculated risky conditioning, instead of resorting to job preemption, replication, or assuming unrealistic risk-free operations.
Index Terms: Grid computing, security binding, risk analysis, scheduling heuristics, heterogeneous computing, preemptive, replication, and delay-tolerant strategies, fault-tolerant computing, and distributed computing *
Manuscript submitted to the IEEE Transaction on Parallel and Distributed Systems, Special Issue on Algorithm design and Scheduling Techniques for Heterogeneous Clusters, on Jan. 15, 2005. All three authors are affiliated with the University of Southern California. The work reported here was supported by NSF ITR Grant 0325409. Corresponding author: Kai Hwang, USC Internet and Grid Computing Lab, EEB 212, Los Angeles, CA 90089. Email:
[email protected], Tel.: (213) 740-4470.
-1-
1. Introduction In a realistic Grid computing environment, distributed resource clusters work at different autonomous domains (ADs), as depicted in Fig. 1. Job executions are carried out across the domain boundaries, meaning that the jobs from one AD could be outsourced to another AD for faster execution [3], [4]. A complication of job outsourcing is caused by network security threats. If a Grid site is under attack, its resources may not be accessible from outside of the domain. Thus, a job dispatched to that site may be delayed or failed due to system infections or cluster crashes. Many heuristics have been suggested for large-scale job scheduling [5], [6]. However, the known heuristics should be modified to apply in a risky environment.
Specifically, a
practical and resilient job scheduler must be security-driven, in that it must consider the risks involved in dispatching jobs to remote sites. Furthermore, risk-resistant strategies are needed to reduce the risks it may take. Unfortunately, existing Grid scheduling algorithms largely ignore the wide-area risk issues, making their applicability in a realistic environment rather doubtful.
Figure 1. The realistic wide-area Grid job-scheduling scenario, in which each grid site working in a different autonomous domain (ADs) may face security threats, independently.
In this paper, our basic contributions are two-fold: First, jobs that are dispatched to a remote site can possibly experience some insecurity and reliability problem once the remote site is intruded by malicious attackers. The jobs dispatched there could be killed. Thus, jobs must demand some form of security assurance from remote sites. Simply put, such a situation can be
-2-
modeled by a parameter called the trust level (TL) that a Grid site can offer to remote jobs. Correspondingly, a job† can be associated with a security demand (SD) value, so that if SD is not greater than TL, the job can expect to finish successfully. Otherwise, the job may fail and has to be restarted on the same or sent to different securer site [32]. The parameters TL and SD are compositely derived from many security parameters as detailed in Section 3. Based on the above conditioning, we study three risk modes to match the TL of Grid sites to SD of jobs. These modes are designed to apply in realistic Grid scheduling platforms: •
Secure mode: A job is allocated to a site, only if the security condition SD ≤ TL is met. The secure mode is considered as a conservative way of scheduling jobs, by which riskfree is assumed. Thus many jobs may be dropped for being over-demanding.
•
Risky mode: Allocate jobs to any available Grid sites and thus take all possible risks at the resource sites. The risky mode is considered as an aggressive way of scheduling jobs by taking some risk.
•
f-risky mode: This is a partial risky mode, by which the job takes some calculated risk. Allocate jobs to available sites to take at most f risk, where f is a probability measure with f = 0 for the secure mode and f = 1 (i.e., 100%) for the risky mode. Jobs are taking risk when scheduled in risky or f-risky modes. We propose three risk-tolerating strategies, namely preemptive, replication and delay-
tolerant strategies. The purpose is to reduce the risk involved in job scheduling. We derive seven Grid job-scheduling algorithms from these strategies under various risk modes. These risktolerant job-scheduling algorithms are specially tailored for risky Grid environment. The algorithms are named as conservative under the secure mode; preemptive f-risky, replication frisky, and delay-tolerant f-risky under the f-risky mode; and preemptive risky, replication risky, and delay-tolerant risky under the risky mode. †
Here, as in nowadays’ real-life Grid computing usage model, a job is an atomic unit of program execution that is neither malleable nor moldable or divisible.
-3-
In this paper, we modify the Min-Min scheduling heuristic [5] to yield seven scheduling algorithms for illustrating the main concept of security binding. The security-driven algorithm design technique hereby developed can be applied to modify many other heuristics, such as the Max-Min, Sufferage, Greedy, or Genetic Algorithms, etc. [5], [6], [30], [31]. The relative performance of these heuristic algorithms is evaluated with two practical workloads: NAS (Numerical Aerodynamic Simulation) and PSA (Parameter-Sweep Application), We measure the makespan, average turnaround time, Grid utilization, slowdown ratio, and failure rate of each of the scheduling algorithms. Then, we use 5-dimensional Kiviat graphs to assess their efficiencies or quality of scheduling services. The rest of the paper is organized as follows. Section 2 presents a brief review of related work and identifies our unique approach to solving the realistic scheduling problem over risky Grid platforms.
In Section 3, we describe the security-binding schema applied for job
scheduling. Section 4 presents a job failure model and the security assured scheduling strategies. We propose performance metrics for Grid computing and report extensive simulation results in Section 5. The relative performance of the seven scheduling algorithms is revealed with Kiviat graphs. Finally, we summarize the contributions and make some final remarks at the end.
2. Related Work and Our Unique Approach Very often, a computational Grid is used to execute a large number of jobs at dispersed resource sites. Job outsourcing becomes a major incentive in collaborative Grid computing. In the past, job scheduling has been primarily suggested for supercomputers, real-time, and parallel computers or heterogeneous systems [24]. Recently, we find reports on adaptive [35], dynamic [13], policy-based [20], QoS-driven [16] job scheduling on Grids. A resource co-allocation framework was described in [8]. Other Grid resource allocation work can be found in [7], [9], [22], [28], [34]. In security-aware job scheduling, the scheduling process becomes much more challenging [17], [33]. Unfortunately, well-known scheduling approaches for Grid computing largely ignore this security factor, with only a handful of exceptions. -4-
Most notably, Azzedin and Maheswaran [2] suggested integrating the “trust” concept into Grid resource management. They observed that if jobs are dispatched solely based on the “trustworthiness” of sites, then the security overheads can be very high. Thus, their research objective is to minimize those overheads. In our approach, we focus on how the risk brought the security concerns and how they affect the overall performance of the jobs in the system. These are evaluated by the slowdown ratio, makespan, site utilization, and job failure rate, etc. Humphrey and Thompson [17] provided a very useful discussion on various usage models for securityaware Grid computing. However, they did not elaborate on how a scheduler should be designed to address the security concerns in collaborative computing over distributed cluster environment. Abawajy [1] suggested a scheduling approach called Distributed Fault-Tolerant Scheduling (DFTS) to provide fault-tolerance to job execution in a Grid environment. The DFTS algorithm works by replicating jobs at multiple sites in a careful manner so as to guarantee successful job executions. However, in a practical situation, there are some trade-offs that cannot be ignored when using such a replication approach. For instance, the replicas may finish at different times and some synchronization overheads are required. Furthermore, if a job can actually be successfully executed in a site despite that there is some risk, the replicas then become wasted efforts, which could have been used for executing some other jobs.
Our
simulated results will demonstrate that replication is needed only for some constrained situation. Wu and Sun [35] develop a Grid Harvest Service (GHS) scheduler to supported dynamic and self-adaptive task scheduling, which monitors the long-running application progress and detects possible resource abnormality. Their self-adaptive scheduling algorithm is based on a probabilistic approach, which selects appropriate resources and reschedules tasks from abnormal machines to normal machines. Our work is different from their work in that we focus on the risk involved in job scheduling. Resources are allocated in a prevention manner in our approach. Jobs are prevented to dispatch to those sites with abnormal behavior.
-5-
Another related previous research effort is by Dogan and Ozguner [10], [11]. They suggested a novel scheme to minimize the failure rates of parallel applications on heterogeneous computing platforms. Their model is different from what we consider here, because they used static scheduling to manage tightly coupled parallel applications that are modeled by directed acyclic graphs [21]. Pushing further beyond the aforementioned work, our approach considers various risk factors that the job scheduler may deal with. We extend from the preliminary results reported in [31].
3. Security Binding with Trust Integration Grid sites may exhibit unacceptable security conditions and system vulnerabilities [17]. The worry about inevitable security threats and doubtful trustworthiness of remote resources created the barriers of trusted job outsourcing to remote computer platforms. In mapping jobs onto Grid sites, we need to tackle a completely new dimension of security-related problems. First, a user job demands resource site to provide security assurance by issuing a security demand (SD). In a real life situation, asking the Grid users to fully specify their security demand is an unreasonable burden. This situation is illustrated with a simple Grid job submission request in Fig.2. In addition to the request of computing power under deadline and budget limits, the user wishes to simply express an SD level from high to low.
Figure 2. Grid job submission request with computing power, deadline to job completion, allowable budget, and security demand.
-6-
On the other hand, the resource site needs to reveal its trustworthiness, called the trust level (TL). The SD and TL are two key parameters to satisfy a security-assurance condition: SD ≤ TL during the job mapping process. The process of matching TL with SD is similar to the
real-life scenario where the Yahoo! portal requires users to specify the security level of the login session. On a realistic platform, both SD and TL are highly loaded concepts, as depicted in Fig. 3. Trust Level (TL) Fuzzy logic based trust aggregation
IDS related Capabilities
Anti-Virus Capabilities
Firewall Capabilities
Prior Job Execution Success Rate
Cumulative Site Utilization
(a) Site trust level from trust integration reported in [29, 30] Security Demand (SD)
Job Sensitivity
Peer Authentication
Access Control
Job Execution Environment
Data Integration
(b) Job security demand
Figure 3. Attributes affecting the trust level (TL) at resource site and the security demand (SD) at the user end.
The trust level is an aggregation of five major attributes listed in Fig. 3(a). They are behavior attributes accumulated from historical performance of a resource site, such as prior job execution success rate and cumulative site utilization, and intrinsic security attributes such as intrusion detection, firewall, and intrusion response capabilities. The intrinsic attributes can be measured as intrusion detection rate, false alarm rate, and intrusion response results [19]. Both behavior attributes and intrinsic attributes change dynamically and they depend heavily on the trust model, security policy, accumulated reputation, self-defense capability, attack history, and
-7-
site vulnerability, etc. On the other hand, we show in Fig. 3(b) what the users may concern about the job sensitivity, peer authentication, access control, and data integrity in setting up their security demand. In our previous studies [29], [30], we propose a fuzzy-logic based trust model to enable the aggregation of numerous trust parameters and security attributes into easy-to-use scalar quantities. Specifically, the TL is aggregated through our fuzzy-logic inference process over the contributing parameters. A salient feature of our trust model is that if a site’s trust level cannot match with job security demand, i.e., SD > TL , our trust model could deduce detailed security features to guide the site security upgrade as a result of tuning the fuzzy system. The details of trust integration using fuzzy-logic aggregation are given in [30]. In a different approach (not using fuzzy logic to integrate trust), Xiong and Liu [36] have suggested a P2P reputation system called PeerTrust, which maintains a composite trust value for each peer by integrating five different factors: feedback by other peers, number of transactions, credibility of feedback sources, transaction context factor, and the community context factor. These parameters could be combined through some weighted function to yield a single metric. Other researchers in [14], [15], and [26] have proposed interesting ideas about the propagation and management of both “trust” and “distrust”. The distinction in our approach lies in an optimized matching of security/trust requirements and supports judicious Grid site mapping for user jobs. This obviously transcends the maintenance of reputation values to provide feedback to Grid sites. Our work reported in [30] guides the resource sites to reconfigure their security facilities to satisfy the job demands and hence, execute the jobs more successfully under security assurance.
4. Scheduling Strategies and Heuristic Algorithms When a remote site is infected by intrusions or by malicious attacks, that site may not be accessible by outside jobs or by the global job scheduler. The scheduler has two options to
-8-
consider: (1) Abort the job scheduling and reschedule it later. (2) Allow the job’s finish time delayed until the security barricade is removed.
Three risk-tolerant strategies and seven
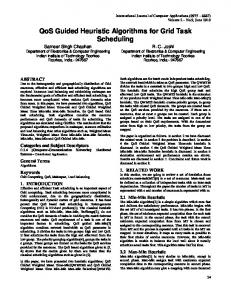
scheduling algorithms are specified below. 4.1 The Job Failure Model In our model, a job could be delayed or dropped, if the site TL is lower than the job SD. The SD is a real fraction in the range [0, 1] with 0 representing the lowest and 1 the highest security requirement. The TL is in the same range with 0 for the most risky resource site and 1 for a risk-free or fully trusted site. Specifically, we define the following job failure model as a function of the difference SD − TL between the job demand and site trust: a) Total failure: The probability of a total failure is modeled by an exponential distribution given in Eq. (1). The parameter λ is a real number deciding the growth of the failure rate against the difference SD − TL . The job abortion is caused by site malfunctioning due to severe attacks or inaccessibility from security barricade imposed. 0 P (complete fail ) = − λ ( SD −TL ) 1 − e
if SD ≤ TL if SD > TL
(1)
b) Delayed execution: The probability of a delayed job execution is given in Eq.(2). The parameter γ is a real number deciding the growth of the delayed execution against the difference SD − TL . This is caused by temporary unavailability of the allocated resources. 0 P (delay ) = −γ ( SD −TL ) 1 − e
if SD ≤ TL if SD > TL
(2)
We plot the failure function in Fig. 4 against the trust difference SD-TL under the secure condition ( SD > TL ). The probability of a job failure increases as the difference SD − TL increases. Intuitively, the probability of having a job delayed is higher than that of having a job completely failed. Thus, the delay parameter γ is less than the failure λ in our model.
-9-
1.0
λ=1 λ=2
0.8
λ=3
λ=4
P(fail)
0.6
λ=5 0.4
0.2
0.0 0.0
0.2
0.4
0.6
0.8
1.0
SD - TL
Figure 4. The exponential distribution of the job failure model.
4.2 On-line Scheduling Model and Risk Modes We consider a periodic online scheduling system as modeled in Fig.5. Modeling the reallife scheduling situation, jobs are scheduled in batches [5]. The scheduler aims at minimization of individual job execution times as well as the total time required by many jobs. All Jobs are assumed scheduled independently. However, we want to minimize the total execution time of N jobs, which is often called the makespan defined as follows: Makespan = Maxi {FT(Ji) FT(Ji) is the finish time of job Ji }
(3)
Site 1
Successful execution job
Site 2
Failed execution job Job re-dispatches
Site 3 Scheduling Interval 1st scheduling event
2nd scheduling event
Scheduling Interval
Time 3rd scheduling event
Figure 5. System model for on-line job scheduling in computational Grids.
In our model, we assume a fail-stop execution [27], meaning that if a job fails on a site, then it will be re-scheduled to restart at another secure site that has a TL greater than the SD. That is, the scheduler will not allow a failed job to take risk again. For clarity, we apply various
- 10 -
scheduling algorithms to the Min-Min heuristic [5]. This implies seven variations of the MinMin heuristic as briefly introduced below. Let ETC (Expected Time to Complete) be the expected finish time of a job. For each job, the Grid site that gives the earliest ETC is identified first. Then the job with the minimum ETC is selected and dispatched to the allocated Grid site. Recall in Section 1, we consider three risk modes for scheduling heuristics, according to different risk levels that can be tolerated. As illustrated in Fig.6, a conservative mode demands risk-free to schedule a task to a completely safe site (i.e., with SD ≤ TL ). On the other hand, the risky mode ignores the risk factor completely (i.e., it sets its tolerance of probability of failure to be 1 (100%)). Obviously, the original Min-Min heuristic assumed risky mode. We consider also any intermediate risk level in that the scheduler allows a task to take the risk probability f ( f ∈ (0,1) ) to execute on a partially risky site with SD > TL. The probability of job failure is
assured to be less than f. We call such an execution mode f-risky. In [31], we study the optimal f value through simulation experiments. It was shown that f = 0.5 has near-optimal performance among all possible f values. Thus we set f = 0.5 here to illustrate the concept. Risk scale: 0
P ( fail ) = 0 Secure
f
1(100%)
P ( fail ) < f f-Risky
P ( fail ) TL. In this strategy, replicas are placed in a careful manner. Multiple replicas are placed only when jobs are scheduled in risky or f-risky modes (SD > TL). All replicas will stop execution once one of the replicated jobs is successfully carried out. •
Delay-Tolerant: The scheduler will wait a period of time τ i = α Ti for each job i, where
Ti is the original execution time needed for the job. If the job can be finished within
τ i + Ti , then the job is still considered successful; otherwise, the scheduler will reschedule it in the next batch. The above strategies apply only to work under the f-risky and risky modes. Thus, we derive seven job-scheduling heuristic algorithms in Table 1 under various risk modes. Table 1. Seven Heuristic Scheduling Algorithms Proposed in This Paper Scheduling algorithm Conservative (secure mode) f-risky
Jobs are scheduled only to secure sites satisfying the condition: SD ≤ TL
Preemptive
The job is scheduled to a site taking a risk less than f and can be preempted due to insecure conditions, which exceeds the threshold f. Resubmit the job to another site, when the selected site is not available or inaccessible.
Replication
The same job may be dispatched to multiple sites taking a risk less than f. Multiple replicas are placed at multiple sites to prevent from job failure.
Delay-tolerant
The job is scheduled to a site taking risk less than f. The scheduler delays a preset period of time before making a rescheduling request
Preemptive
The job is scheduled to a risky site and can be preempted by alerted threats when the selected site is not available or inaccessible. Resubmit the job to another site by default.
Replication
Jobs are scheduled to multiple risky sites with known threats. Multiple replicas are placed to prevent from job failure.
mode
Risky
Action events in the heuristic algorithm
mode
Delay-tolerant
Jobs are scheduled to risky sites with known threats. The scheduler delays a preset period of time before making a rescheduling request
The conservative algorithm works only under the secure mode. For either the partial frisky mode or the fully risky mode, we can apply any of the three strategies to specify a scheduling algorithm. We will reveal the relative merits of these seven scheduling algorithms in
- 12 -
subsequent sections. The heuristic applicable is not restricted to Min-Min algorithm. As stated earlier, many other heuristics like Max-Min, Sufferage, Greedy, and Genetic algorithms can be also modified using the security model proposed. In our experiments, we only implemented the Min-Min variations to illustrate the security-binding idea.
5. Performance Results on NAS and PSA Workloads In this section, we propose the performance metrics and present the simulated benchmark results on the performance of the seven scheduling algorithms. 5.1 NAS and PSA workloads and Performance Metrics
In order to gain practical insights into the effectiveness of the scheduling approaches, we use two realistic workloads to text the scheduling effectiveness in a risky Grid environment. The NAS Workloads: We use the Numerical Aerodynamic Simulation (NAS) benchmark
recorded on the 128-node iPSC/860 system in NASA Ames Research Center. This NAS trace contains 92 days of data gathered in 1993. We map the 128 nodes to 12 Grid sites—each of four sites contains 16 nodes. The remaining eight sites each contain 8 nodes. Our simulations are based on the arrival time, job size, and runtime data provided by the NAS trace [23]. This trace was sanitized to remove the user specified information and pre-processed to correct for system downtime. Detailed NAS information can be found in [12]. Parameter-sweep application (PSA) Workload: The parameter-sweep application (PSA) model
has emerged as a “killer application” benchmark for high-throughput computing applications in large-scale Grid experiments [6]. The PSA is defined as a set of independent sequential jobs (i.e., no job precedence). Independent jobs operate on different datasets. A large range of parameter values is applied to the program input datasets. The PSA is deal to model N independent jobs (SPMD with the same task specification over a different datasets) on M distributed sites where N is much larger than M.
- 13 -
Performance Metric used: To evaluate the scheduling performance, we propose to use the
following performance metrics. Table 2 lists the key simulation parameters used in the NAS and PSA benchmark experiments. The simulation was carried out on a Dell dual-processor Linux server during the Fall of 2004. •
Average turnaround time: Let N be the total number of jobs, ci, be the completion time for a single job Ji and ai the job arrival time. the average turnaround time is defined by: Average job turnaround time = ∑ iN=1 (ci − ai ) N .
(4)
•
Makespan: Defined as max{ci , i = 1, 2, .. N } in Eq.(3).
•
Slowdown ratio: Denote the start time for a single job Ji as bi, the average waiting time is ∑ iN=1 (ci − bi ) N . The slowdown ratio is the ratio between the average turnaround time and the average waiting time. This metric indicates the contention experienced by a job. Slowdown ratio =
•
∑ iN=1 ( ci − ai ) N ∑ iN=1 ( ci − ai ) = ∑ iN=1 ( ci − bi ) N ∑ iN=1 ( ci − bi )
(5)
Job failure rate: When TL < SD, the number of risk-taking jobs is denoted as N risk . Job execution may fail due to insecure resource sites applied.
The numerator, N fail , is the
number of failed and rescheduled jobs. The failure rate is thus defined by the ratio: Job failure rate = N fail N risk ×100% . •
(6)
Site utilization: Defined by the percentage of processing power allocated to user jobs out of total processing power available at a selected Grid site.
•
Grid utilization: Defined by the percentage of processing power allocated to user jobs out of total processing power available of a global Grid.
- 14 -
Table 2. Simulation Parameters and Settings Used in Experiments Parameter
Value setting
Number of jobs N
NAS: 16000; PSA: 10000
Number of sites M
NAS: 12; PSA: 20
Job arrival rate
NAS: Given by trace; PSA: 0.008jobs/second/site
Job workloads
NAS: Given by trace; PSA: 20 levels (0 – 300000)
Site processing speed
NAS: 8×8 nodes and 4×16 nodes; PSA: 10 levels (0 – 10)
Job security demands (SD)
0.6-0.9, uniform distribution
Site trust level (TL)
0.3-1, uniform distribution
Failure coefficient λ
λ=4
Delay coefficient γ
γ=2
Delay time α
α = 0.2
Number of replicas
2
5.2 Performance Results over The NAS Workload
We evaluated the performance of the seven scheduling algorithms with the NAS trace workload. The simulation results are given below for each metric. Figure 7(a) shows the makespan results of seven algorithms. Overall, the delay-tolerant risky algorithm has the best performance. The conservative algorithm and replication f-risky perform the worst. All others have relatively the same level of performance. Among the three security modes, risky mode performs better than the f-risky mode, and secure mode is the worst. Among three scheduling strategies, delay-tolerant strategy performs better than preemptive, and replication strategies. Figure 7(b) shows the average turnaround times. The relative results are similar with the makespan results. The delay-tolerant-risky algorithm has the shortest turnaround time. The secure mode and replication f-risky have the longest turnaround time. Overall, the best case has twice shorter turnaround time than the worst case. Figure 7(c) shows the slowdown ratio results. The same trend is observed with that of the average turnaround time. Figure 7(d) shows the job failure rates. Under the conservative algorithm, there is no failure, inherently.
- 15 -
1
(a) Makespan
2
(c) Slowdown ratio
Grid Utilization (%)
20 10
5
6
7
60
40
20
0 4
5
(d) Failure rate
6
7
1
2
3
4
5
6
7
Delay-Tolerant Risky
3
Delay-Tolerant Risky
2
Replication Risky
1
Replication Risky
0
Preemptive Risky
7
Delay-Tolerant Risky
6
Replication Risky
5
Preemptive Risky
4
Delay-Tolerant f-Risky
3
Replication f-Risky
2
Preemptive f-Risky
Conservative
1
30
Delay-Tolerant f-Risky
0
40
Replication f-Risky
100
50
Preemptive f-Risky
200
60
Conservative
Failure Rate (%)
300
4
80
70
400
3
(b) Average turnaround time
500
Slowdown Ratio
0.0
7
Secure Mode
6
Delay-Tolerant Risky
5
Replication Risky
4
Preemptive Risky
3
Delay-Tolerant f-Risky
2
Replication f-Risky
Conservative
1
5
Delay-Tolerant Risky
0
3.0x10
Preemptive Risky
6
5
Replication Risky
1x10
6.0x10
Delay-Tolerant f-Risky
6
5
Preemptive Risky
2x10
9.0x10
Replication f-Risky
3x10
6
Delay-Tolerant f-Risky
6
6
Preemptive f-Risky
4x10
1.2x10
Replication f-Risky
6
6
Conservative
5x10
1.5x10
Preemptive f-Risky
6
Turnaround Time (s)
6
6x10
Preemptive f-Risky
Makespan (second)
7x10
(e) Grid utilization
Figure 7. Performance results of seven scheduling algorithms for the NAS trace workload.
For the other six algorithms, the replication f-risky algorithm has the lowest failure rate. The observed results show that all f-risky mode algorithms have much lower failure rate than risky mode ones. Furthermore, under each mode, replication algorithms have the lowest failure rate, delay-tolerant polices have the medium failure rate, and preemptive algorithms have the highest failure rate. Figure 7(e) shows the Grid utilization. Again, the delay-tolerant risky algorithm has the highest utilization. All other algorithms have comparable utilization rate. No single algorithm achieves universal best performance for all metrics. Delay-tolerant risky algorithm achieves the best in makespan, turnaround time, slowdown ratio, and Grid utilization.
However, its failure rate is very high, compared with the replication strategy.
Replication f-risky has the lowest failure rate, however, it has the worst performance for other metrics. Figure 8 shows the individual site utilization rates. Overall, risky-mode algorithms
- 16 -
show more balanced utilization among sites. The results of the secure-mode algorithms are shown in Fig.8 (g). The utilization is not balanced among Grid sites. Some sites are simply not used. Eight sites among the 12 sites achieved more than 95% utilization rate.
80
80
60
40
20
0
Replication f-Risky (NAS)
80
60
40
20
2
3
4
5
6
7
8
9
10
11
12
20
2
3
4
5
7
8
9
10
11
1
12
40
20
0 4
5
6
7
8
9
10
11
12
40
20
8
9
10
11
1
40
20
2
3
4
5
6
7
8
9
10
11
0
12
1
2
3
Grid Site
4
5
6
7
8
9
10
11
Grid Site
(e) Replication Risky
(f) Delay-Tolerant Risky
100
80
Site Utilization (%)
80
60
40
20
60
Preemptive Risky Replication Risky Delay-Tolerant Risky
40
20
0
0 1
2
3
4
5
6
7
8
9
10
11
12
1
2
3
Grid Site
(g) Conservative
12
60
0
Conservative (NAS)
7
80
Grid Site
100
6
Delay-tolerant Risky (NAS)
60
(d) Preemptive Risky
5
100
Site Utilization (%)
Site Utilization (%)
60
3
4
(c) Delay-Tolerant f-Risky
80
2
3
Replication Risky (NAS)
100
80
1
2
Grid Site
(b) Replication f-Risky
Preemptive Risky (NAS)
100
6
Grid Site
(a) Preemptive f-Risky
Site Utilization (%)
40
0 1
Grid Site
Site Utilization (%)
60
0
1
Delay-Tolerant f-Risky (NAS)
100
Site Utilization (%)
100
Site Utilization (%)
Site Utilization (%)
Preemptive f-Risky (NAS) 100
4
5
6
7
8
9
10
11
12
Grid Site
(h) An overall comparison of the three strategies (under risky mode)
Figure 8. Site utilization (%) for the NAS trace workloads.
- 17 -
12
The results of the three f-risky algorithms are shown in Figs. 8(a), (b) and (c). Their utilization rates are well balanced among the sites. Fewer sites are not used compared with the secure mode. Only slight difference was observed among the three strategies. The results of the three risky algorithms are shown in Figs. 8(d), (e) and (f). Owing to the aggressive nature of this operational mode, no idle site is observed. Thus, the site usages are much better balanced. Compared with the f-risky mode, more sites achieve the higher utilization rates. 5.3 Performance Results over The PSA Workload
In this section, we evaluate the performance of the seven scheduling algorithms on the PSA workload. Figure 9(a) shows the makespan results of all algorithms. First, conservative algorithm exhibits the longest makespan.
Second, the performance of f-risky and risky
algorithms is comparable. Third, comparing the performance among three strategies, the delaytolerant strategy has the shortest makespan, the preemptive strategy has medium makespan, and the replication strategy has the longest makespan. Figure 9(b) shows the PSA results on the average turnaround time. Two delay-tolerant algorithms have the shortest turnaround time. The conservative algorithm and replication f-risky have the longest turnaround time. The preemptive algorithms and replication risky algorithm have relative the same turnaround time. Overall, the best-performed delay-tolerant algorithms improve more than 80% over the worst secure mode and replication f-risky algorithms. Figure 9(c) shows the slowdown ratio results. Delay-tolerant algorithms perform the best, preemptive strategies perform the second, followed by the preemptive algorithm. Figure 9(d) shows the job failure rate. Owing to the characteristics of a secure approach, no job fails. For the other six algorithms, replication f-risky has the lowest failure rate. This is because jobs take less risk when operating in f-risky mode. The replication strategy has further reduced risk taken by jobs. The replication risky algorithm has the second lowest failure rate. The two delay-tolerant algorithms have the same level of failure rate. The two preemptive
- 18 -
algorithms have the highest failure rate. Figure 9(e) shows the Grid utilization. Delay-tolerant risky algorithm has the highest utilization. Conservative algorithm has the lowest utilization. Turnaround Time (s)
6
3x10
6
2x10
6
1x10
5x10
5
4x10
5
3x10
5
2x10
5
1x10
5
0
(a) Makespan
(c) Slowdown ratio
7
Delay-Tolerant Risky
6
Replication Risky
Preemptive Risky
5
7
(d) Failure rate
0 1
2
3
4
5
6
7
Delay-Tolerant Risky
6
Replication Risky
5
Preemptive Risky
4
Delay-Tolerant f-Risky
3
Delay-Tolerant Risky
2
Replication Risky
1
20
Replication f-Risky
0
40
Preemptive f-Risky
10
60
Conservative
Grid Utilization (%)
20
Preemptive Risky
7
Delay-Tolerant Risky
6
Replication Risky
5
Preemptive Risky
4
Delay-Tolerant f-Risky
3
Replication f-Risky
2
Preemptive f-Risky
Conservative
1
30
Delay-Tolerant f-Risky
0
40
Replication f-Risky
40
50
Preemptive f-Risky
80
4
80
60
Conservative
Failure Rate (%)
70
120
3
(b) Average turnaround time
160
Slowdown Ratio
2
Delay-Tolerant f-Risky
1
7
Conservative
6
Delay-Tolerant Risky
5
Replication Risky
Replication f-Risky
4
Preemptive Risky
3
Delay-Tolerant f-Risky
2
Preemptive f-Risky
Conservative
1
Replication f-Risky
0
Preemptive f-Risky
Makespan (second)
6
4x10
(e) Grid utilization
Figure 9. Performance results of seven heuristic algorithms for the PSA workload.
6. Relative Performance and Scalability Analysis
In this section, we show the aggregate performance of seven scheduling algorithms, considering their combined strength and weakness in all five performance matrices. We use 5-D Kiviat graphs to conduct this compound-objective comparison. 6.1 Kiviat Graphs for Modeling Scheduling Efficiency
Figure 10 contains seven Kiviat graphs, each of which shows the performance of one scheduling algorithm. All data in this set of graph is collected from experiments running on the NAS workload. Each Kiviat graph has five orthogonal axes, each representing one dimension of the performance metric. The scales and ranges of five measures are specified in Fig. 10(a). The
- 19 -
circle center represents ‘0’ for all measures. The range of makespan, turnaround time and slowdown ratio is from zero to the largest value observed in the experiments. The failure rate and un-utilization rate (1-utilization) are within the interval [0, 1]. 6.5×10⁶s
Makespan [0, 6.9×10⁶s]
Turnaround Time [0, 1.5×10⁶s]
1- Utilization [0, 1.0]
1.3×10⁶s
0.43 0.0
O
403
Failure Rate [0, 1.0]
Slowdown Ratio [0, 469]
ε = 1 - 30.5% = 69.5%
(a) Scales and ranges of 5 measures
(b) Conservative
6
5.8×10 s
6.9×10 s
1.0×10⁶s
0.36
5.5×10⁶s
6
1.5×10⁶s
0.41 0.06
0.31
0.81×10⁶s
0.32 0.18 272
325 469
ε = 1- 25.3% =74.7%
ε = 1- 37.9% = 72.1%
ε = 1-18.1% = 81.9%
(b) Preemptive f-Risky
(c) Replication f-Risky
(d) Delay-tolerant f-Risky
6
5.84×10 s
5.8×10 s
1.0×10⁶s
0.37
5.1×10⁶s
6
1.0×10⁶s
0.34
0.26 0.66×10⁶s
0.25 0.66
0.38 332
339
221
ε = 1- 32.6% = 67.4%
ε = 1- 24.5% = 75.5%
ε = 1- 15.5% = 84.5%
(f) Preemptive Risky
(g) Replication Risky
(h) Delay-tolerant Risky
Figure 10. Kiviat graphs showing the aggregate performance of seven scheduling algorithms in terms of five performance metrics under the NAS trace workload.
Intuitively, the smaller the shaded area in the center of the Kiviat graph, the better the
quality or efficiency of a scheduling algorithm being evaluated. Thus, we define the efficiency ε
- 20 -
of a scheduling algorithm in Eq.(7). This term indicates the overall scheduling quality.
ε = 1 −
×100%
Ashaded Acircle
(7)
Based on Eq.(7), the delay-tolerant risky algorithm achieves the highest efficiency 84.5%, as shown in Fig. 10(h). The delay-tolerant f-risky is ranked at the second place. The
preemptive f-risky and replication risky have comparable efficiency. All the other algorithms have relative lower efficiency. 3.3×10⁶s
Makespan [0, 3.3×10⁶s]
Response Time [0, 4.2×10⁵s]
1- Utilization [0, 1.0]
3.9×10⁵s
0.48
O
0.0
118
Failure Rate [0, 1.0]
Slowdown Ratio [0, 152]
ε = 1- 32.3% = 67.7%
(a) Scales and ranges of 5 measures
(b) Conservative 2.2×10⁶s
2.0×10⁶s
4.2×10⁵s
1.7×10⁵s
0.36 0.65
1.2×10⁶s 0.23 0.76×10⁵s
0.31
0.43
0.06
69
33
152
ε = 1- 17.9% = 82.1%
ε = 1- 29.5% = 70.5%
ε = 1- 6.1% = 93.9%
(b) Preemptive f-Risky
(c) Replication f-Risky
(d) Delay-tolerant f-Risky
2.0×10⁶s 0.38 1.7×10⁵s
1.8×10⁶s 0.29
2.2×10⁵s
0.23 0.65
65
1.4×10⁶s 0.22 0.74×10⁵s 0.44
32
87
ε = 1- 17.8% = 82.8%
ε = 1- 14.3% = 85.7%
ε = 1- 6.0% = 94%
(f) Preemptive Risky
(g) Replication Risky
(h) Delay-tolerant Risky
Figure 10. Kiviat graphs showing the aggregate performance of seven scheduling algorithms in terms of five performance metrics under the PSA workload.
- 21 -
Figure 11 shows the Kiviat graphs for PSA workloads. Delay-tolerant f-risky and risky algorithms have the highest efficiency, roughly 94%. Replication risky has the second highest efficiency (ε = 85.7%), which agrees with the NAS results. Both preemptive f-risky and risky algorithms are ranked in the middle with 82%. Conservative and replication f-risky algorithms result in the lowest efficiency. 6.2 Relative Performance of Seven Scheduling Algorithms
We summarize the efficiency and relative ranking of seven algorithms for both NAS and PSA workloads in Table 3. The first three places are same for both workloads. Delay-tolerant risky algorithm ranks the first, followed by delay-tolerant f-risky and replication risky algorithm. Delay-tolerant strategy demonstrates high efficiency under both risky and f-risky modes. Thus, delay-tolerant strategy should be promoted for Grid job scheduling. The replication strategy demonstrates high efficiency only under risky mode. This is due to less risk involved when scheduling algorithm operates in f-risky mode. Thus, job replication is redundant and decreases the efficiency. Preemptive strategy demonstrates relative low efficiency. Secure mode demonstrates the worst performance. It should not be adopted unless all jobs are highly security sensitive, and require 100% security assurance. Table 3. Efficiency and Relative Ranking of Seven Scheduling Algorithms Scheduling Algorithms
NAS workload Efficiency, ε Ranking
PSA workload Ranking Efficiency, ε
Conservative
69.5 %
6th
67.7 %
7th
Preemptive f-Risky
74.7 %
4th
82.1 %
5th
Replication f-Risky
72.1 %
5th
70.5 %
6th
Delay-tolerant f-Risky
81.9 %
2nd
93.9%
2nd
Preemptive Risky
67.4 %
7th
82.8%
4th
Replication Risky
75.5 %
3rd
85.7 %
3rd
Delay-tolerant Risky
84.5 %
1st
94.0 %
1st
- 22 -
6.3 Scaling Effects of Workload Size
The more user jobs injected into a Grid system, the higher the workload and the longer the time needed to process the submitted jobs. The performance effects of varying the number of simulated jobs are reported in Figure 12. Because the number of jobs in the NAS trace workload is fixed, we study only the scaling effects only on the PSA workload. The PSA workload is executed on 20 simulated Grid site. All simulation parameters follow the setting in Table 2. The number of simulated jobs varies from N = 1000 to 20,000 jobs.
6
7x10 6x10
6
5x10
6
4x10
Turnaround Time (second)
Makespan (second)
6
1.0x10
Conservative Preemptive f-Risky Replication f-Risky Delay-Tolerant f-Risky Preemptive Risky Replication Risky Delay-Tolerant Risky
6
6
3x10
6
2x10
6
1x10
0 1 1000
2 5000
3 10000
Conservative Preemptive f-Risky Replication f-Risky Delay-Tolerant f-Risky Preemptive Risky Replication Risky Delay-Tolerant Risky
5
8.0x10
5
6.0x10
5
4.0x10
5
2.0x10
0.0 1 1000
4 20000
2 5000
Number of Jobs
(a) Makespan
160
60
80
Grid Utilization (%)
240
80
70
Conservative Preemptive f-Risky Replication f-Risky Delay-Tolerant f-Risky Preemptive Risky Replication Risky Delay-Tolerant Risky
50 40 30 20 10
2 5000
3 10000
Number of Jobs
(c) Slowdown ratio
4 20000
60
40
Conservative Preemptive f-Risky Replication f-Risky Delay-Tolerant f-Risky Preemptive Risky Replication Risky Delay-Tolerant Risky
20
0
0
0 1 1000
4 20000
(b) Average turnaround time
Failure Rate (%)
Slowdown Ratio
320
3 10000
Number of Jobs
1 1000
2 5000
3 10000
Number of Jobs
(d) Failure rate
4 20000
1 1000
2 5000
3 10000
4 20000
Number of Jobs
(e) Grid utilization
Figure 12. Scaling effects of the job number (from N=1000 to 20000 jobs) on the performance of 7 scheduling algorithms in executing the PSA workload over 20 Grid resource sites.
With more jobs running the same PSA workload, the makespan, the average job
turnaround time, and the slowdown ratio increase with the same pace as seen in Figs.12 (a), (b), - 23 -
and (c). The delay-tolerant-risk algorithm has the best performance and conservative algorithm has the lowest performance in all measures. Furthermore, the flat job failure rate in Fig.12 (d) shows the robustness of these algorithms. The slow increase of Grid site utilization in Fig.12 (e) indicates that all algorithms can reach their maximum utilization with job scaling.
7. Conclusions In the Internet environment, when a resource site is under attack, the site may be unresponsive but not yet in a failed state. But the jobs dispatched to such a site may appear to be failed. Of course, there are also situations where a site is shutdown and all jobs are purged. Thus, a job may be completely failed or just delayed. The question for a scheduling algorithm is what we should do to handle such a failure heterogeneity problem. Unfortunately, this problem is largely ignored in the past. The classical results in fault-tolerant computing cannot be applied due to the large-scale heterogeneity involved in computational Grids [26]. To solve the trusted computing issues, mapping large-scale applications on a wide-area computational Grid, trust and security issues must be addressed properly. Specifically, as the Grid sites are administered by different organizations, the defense capabilities of the sites are highly heterogeneous. Such a heterogeneity feature is highly complex to prevent perfect match of the job security requirements from the trust level of various resource sites in different domains. In our recent study [30], we have proposed a trust integration methodology to align security requirements of jobs with the defense capabilities at resource sites. However, the defense heterogeneity also induces another problem—the possible failures in jobs and the heterogeneity in such failures. A practical method is to aggregate the job requirements as well as the site capabilities to scalar quantities TL and SD introduced in this paper. Even if the aggregated values indicate that the trustworthiness of a resource site is sufficiently high (i.e., SD < TL), jobs dispatched at such sites can still fail. Consequently, the
- 24 -
failed jobs need to be re-scheduled. However, the re-scheduling problems are tricky because job failures manifest in different forms. In this paper, we solved this heterogeneity problem by developing resilient strategies and seven job-scheduling algorithms under various risky conditions. Summarized below are the major contributions and research findings out of extensive NAS and PSA benchmark experiments on simulated Grid environment. A. First, we developed three risk modes for modeling Grid operations, namely the secure,
risky, and f-risky modes. These operational modes model various levels of risk involved in Grid job scheduling. These risk modes are first-time introduced, that can be applied to bind security in most heuristics and scheduling algorithms. In [31], we have discovered that the optimal f value is 0.5 based on simulation results. B. Second, we propose three realistic risk-tolerant strategies: namely the preemptive,
replication, and delay-tolerant strategies for trusted Grid job scheduling. Based on these scheduling strategies, we proposed seven job-scheduling algorithms, which offer the resilient choices under different risky conditions. These three strategies cover a widerange of applications. They can be also modified to suit special security requirement. C. The relative performances of the 7 scheduling algorithms were evaluated by the NAS and PSA benchmarks. We measure the makespan, average job turnaround time, Grid
utilization, the slowdown ratio, and job failure rate in using these algorithms. We find that the Kiviat graph very useful to reveal the aggregate performance of each of the 7 scheduling algorithms along all 5 dimensions of performance attributes. D. Our extensive simulation results suggest that in a wide-area Internet computing environment, it is more resilient for the global job scheduler to tolerate the job delays introduced by calculated risky conditions, instead of resorting to job preemptive or replication or using the unrealistic risk-free demands.
- 25 -
E. We find that the delay-tolerant risk algorithm has the best performance among the 7 algorithms evaluated in this paper. The conservative algorithm has the lowest performance for being too rigid to adapt to changes in risk condition. All scheduling algorithms scale well with the increase of job numbers. This is reflected by the fact that the flat job failure rate in Fig.12 (d) and the slow increase of Grid site utilization in Fig.12 (e).
Acknowledgments: The funding support of this work by the NSF ITR Grant ACI-0325409 is
appreciated. This work was conducted at the USC Internet and Grid Computing Laboratory. Y.K. Kwok participated on this project while he was visiting USC, on his sabbatical leave from the University of Hong Kong. The authors appreciate the critical comments from the technical members of the USC GridSec research group.
References [1] J. H. Abawajy, “Fault-Tolerant Scheduling Policy for Grid Computing Systems,” in Proc. of IEEE International Parallel & Distributed Processing Symposium (IPDPS’04), Santa Fe, NM, April 2004. [2] F. Azzedin and M. Maheswaran, “Integrating Trust into Grid Resource Management Systems,” Proc. Intl. Conf. of Parallel Processing, Aug. 2002. [3] M. A. Baker, R. Buyya, and D. Laforenza, “The Grid: International Efforts in Global Computing,” International Journal of Software Practice and Experience, Nov. 2002. [4] F. Berman, G. Fox, and T. Hey, (Editors), Grid Computing: Making The Global Infrastructure a Reality, John Wiley & Sons, 2003. [5] T. D. Braun, H. J. Siegel et al., “A Comparison of Eleven Static Heuristics for Mapping a Class of Independent Tasks onto Heterogeneous Distributed Computing Systems,”
Journal Parallel and Distributed Computing, vol. 61, 2001, pp. 810-837. [6] H. Casanova, A. Legrand, D. Zagorodnov, and F. Berman, “Heuristics for Scheduling Parameter Sweep Applications in Grid Environments,” Proc. HCW 2000.
- 26 -
[7] K. Cooper et al., F. Berman et al., “New Grid Scheduling and Rescheduling Methods in the GrADS Project,” in Proc. of IEEE International Parallel & Distributed Processing
Symposium (IPDPS’04), Santa Fe, NM, April 2004. [8] K. Czajkowski, I. Foster, and C. Kesselman, “Resource Ao-Allocation in Computational Grids,” Proc. of IEEE Int’l Symp. High Perf. Distri. Computing (HPDC-8), 1999. [9] H. Dail, F. Berman, and H. Casanova, “A Decoupled Scheduling Approach for Grid Application Development Environments,” Journal Parallel and Distributed Computing, vol. 63, 2003, pp. 505-524. [10] A. Dogan and F. Ozguner, “Matching and Scheduling Algorithms for Minimizing Execution Time and Failure Probability of Applications in Heterogeneous Computing,”
IEEE Trans. Parallel and Distributed Systems, vol. 13, no. 3, Mar. 2002, pp. 308-323. [11] A. Dogan and F Ozguner, “A duplication based scheduling algorithm for heterogeneous computing systems,” In Proc. of International Conference on Parallel Processing
(ICPP'02), pages 352-358, Vancouver, Canada, Aug. 2002. [12] D. G. Feitelson and B. Nitzberg, “Job Characteristics of a Production Parallel Scientific Workload on the NASA Ames iPSC/860,” Research Report RC 19790 (87657), IBM T. J. Watson Research Center, Oct. 1994. [13] N. Fujimoto and K. Hagihara, “Near-Optimal Dynamic Task Scheduling of Independent Coarse-Grained Tasks onto a Computational Grid,” Proc. ICPP 2003. [14] R. Guha, R. Kumar, P. Raghavan, and A. Tomkins, “Propagation of Trust and Distrust,”
Proc. ACM WWW 2004. [15] M. Gupta, P. Judge, and M. Ammar, “A Reputation System for Peer-to-Peer Networks,”
Proc. ACM NOSSDAV 2003. [16] X. He, X. H. Sun, and G. Laszewski, “A QoS Guided Scheduling Algorithm for the Computational Grid,” GCC02, Hainan, China, Dec. 2002. [17] M. Humphrey and M. R. Thompson, “Security Implications of Typical Grid Computing Usage Scenarios,” Proc. of HPDC, Aug. 2001. [18] K. Hwang, C. M. Wang, C. L. Wang, and Z. Xu, “Resource Scaling Effects on MPP Performance: STAP Benchmark Implications,” IEEE TPDS, May 1999.
- 27 -
[19] K. Hwang, Y. Chen, and H. Liu, “ Protecting Network-Centric Computing System from Intrusive and Anomalous Attacks”, Keynote paper, IEEE Workshop on System and Network
Security (SNS-225), to be held with IPDPS 2005, Denver, April 8, 2005. [20] J. In, P. Avery, R. Cavanaygh, and S. Ranka, “Policy-Based Scheduling for Simple Quality of Service in Grid Computing,” Proc. of IPDPS 2004, Apr. 2004. [21] Y.-K. Kwok and I. Ahmad, “Static Scheduling Algorithms for Allocating Directed Task Graphs to Multiprocessors,” ACM Computing Surveys, Dec. 1999, pp. 406-471. [22] C. Liu, L. Yang, I. Foster, and D. Angulo, “Design and Evaluation of a Resource Selection Framework for Grid Applications,” Proc. of HPDC-11, 2002. [23] V. Lo and J. Mache, “Job Scheduling for Prime Time vs. Non-Prime Time,”
Proceedings of IEEE Cluster Computing, 2002. [24] M. Maheswaran, S. Ali, and H. J. Sigel, “Dynamic Mapping and Scheduling of Independent Tasks onto Heterogeneous Computing Systems,” JPDC, 1999, pp. 107-131. [25] S. Marti and H. Garcia-Molina, “Limited Reputation Sharing in P2P Systems,”
Proc. ACM EC 2004. [26] X. Qin, H. Jiang, D. R. Swanson, “An efficient fault-tolerant scheduling algorithm for realtime tasks with precedence constraints in heterogeneous systems,” In Proc. of Int’l Conf. of
Parallel Processing, Aug 18-21, 2002. pp. 360-368. [27] F.B. Schneider, “Byzantine generals in action: Implementing failstop processors,”
ACM Transactions On Computer System, 2(2):145-154, 1984. [28] J. M. Schopf, “A General Architecture for Scheduling on the Grid,” Special Issue on Grid Computing, Journal of Parallel and Distributed Computing, April 2002. [29] S. Song, K. Hwang, and M. Macwan, “Fuzzy Trust Integration for Security Enforcement in Grid Computing,” Proc. of IFIP Int’l Conf. on Network and Parallel Computing, Sept. 2004. pp. 9-21. [30] S. Song, K. Hwang, and Y.-K. Kwok, “Security Binding for Trusted Job Outsourcing in Open Computational Grids”, IEEE Trans. on Parallel and Distributed Systems, submitted in May 2004, revised in Dec. 2004. [31] S. Song, Y.-K. Kwok, and K. Hwang, “Trusted Job Scheduling in Open Computational Grids: Security-Driven Heuristics and A Fast Genetic Algorithm,” Proc. of IEEE - 28 -
International Parallel and Distributed Processing Symposium (IPDPS-2005), Denver, CO, April 4-8, 2005. [32] X.-H. Sun and M. Wu, “Grid Harvest Service: A System for Long-Term, Application-Level Task Scheduling,” Proc. of IPDPS, Santa Fe, 2003. [33] V. Welch, F. Siebenlist, I. Foster, J. Bresnahan, K. Czajkowski, J. Gawor, C. Kesselman, S. Meder, L. Pearlman, S. Tuecke. “Security for Grid Services,” Proc. of the HPDC-12, 2003. [34] R. Wolski, J. Brevik, J. Plank and T. Bryan, “Grid Resource Allocation and Control using Computational Economies,” in Grid Computing: Making The Global Infrastructure a
Reality, edited by F. Berman, G. Fox and A. Hey, John Wiley & Sons, 2003. [35] M. Wu and X. Sun, “A General Self-adaptive Task Scheduling System for Non-dedicated Heterogeneous Computing,” IEEE Int’l Conf. on Cluster Computing, Dec. 2003. [36] L. Xiong and L. Liu, “PeerTrust: Supporting Reputation-based Trust to P2P ECommunities,” IEEE Trans. Knowledge and Data Engineering, July 2004, pp. 843-857.
Biographical Sketches: Shanshan Song received her B.S. degree in Computer Science from Special Class for Gifted
Young in University of Science and Technology of China in 2001. She is currently pursuing the Ph.D. degree in the Department of Computer Science at University of Southern California. She specializes in P2P networks, network security, database systems, parallel and distributed computing, and knowledge management. Her current research activities cover the areas of trust management in Grid and P2P systems, security-driven scheduling algorithms, cooperative game strategies, and Grid computing systems. She can be reached via Email:
[email protected] or visit the web site: http://www-scf.usc.edu/~shanshas/. Yu-Kwong Kwok received the B.S. degree in Computer Engineering from the University of
Hong Kong in 1991, and the M.Phil. and Ph.D. degrees in Computer Science from the Hong Kong University of Science and Technology in 1994 and 1997, respectively. He is an Associate Professor of Electrical and Electronic Engineering, University of Hong Kong (HKU). Dr. Kwok
- 29 -
is currently on leave from HKU to serve as a Visiting Associate Professor at the University of Southern California. His research interests include Grid computing, mobile computing, wireless communications, network protocols, and distributed computing algorithms.
Dr. Kwok is a
member of the Association for Computing Machinery, the IEEE Computer Society and Communications Society.
He is a Senior Member of the IEEE.
He can be reached at
[email protected]. Kai Hwang is a Professor and Director of Internet and Grid Computing Laboratory at the
University of Southern California. He received the Ph.D. from the University of California, Berkeley. An IEEE Fellow, he specializes in computer architecture, parallel processing, Internet and wireless security, Grid and cluster computing, and distributed computing systems. He has authored or coauthored 7 scientific books and over 180 Journal and Conference papers in these areas. Dr. Hwang is the founding Editor-in-Chief of the Journal of Parallel and Distributed
Computing. He is also on the editorial board of IEEE Transactions on Parallel and Distributed Systems. He has performed advisory and consulting work for IBM Fishkill, Intel SSD, MIT Lincoln Lab., ETL in Japan, and GMD in Germany. Presently, he leads the NSF-supported ITR GridSec project at USC. The GridSec group develops security-binding techniques for trusted Grid computing. The group builds self-defense software systems for protecting Grid and distributed computing resources. Dr. Hwang can be reached via Email:
[email protected] or through the web site: http://GridSec.usc.edu/Hwang.html.
- 30 -