S.M.M. Tahaghoghi. James A. Thom. School of ...... We plan to replace some of the fixed .... [18] S. M. M. Tahaghoghi, J. A. Thom, H. E. Williams, and T. Volkmer.
RMIT University Video Retrieval Experiments at TRECVID 2006 Timo Volkmer
S.M.M. Tahaghoghi
James A. Thom
School of Computer Science and Information Technology RMIT University, GPO Box 2476V, Melbourne, Australia, 3001 {tvolkmer,saied,jat}@cs.rmit.edu.au
All runs are fully automatic search runs. Table 1 shows an overview of the submitted runs. We used We participated in the shot boundary detection and different inverted indexes built using text from speech video search tasks. This page provides a summary of transcripts (T); semantic high-level concept terms (S); our experiments: and terms from expanding the concept terms using lexical semantic referencing (E). In Run 2, the system Shot Boundary Detection automatically used a text-based index (T) for personx queries or a combined index (T+S+E) for other Our approach uses the moving query window techqueries. nique [17, 18, 21, 22]. We applied the system that we used in 2004 [22] Run Type Index Term expansion and varied algorithm parameters around the optimal 1 B T+S+E Hyponym settings that we obtained with training runs on the 2 B Q. dep. Hyponym/none trecvid 2005 test set. 3 B T+S+E Hypernym The results of all runs are close together at a high 4 B T+S+E Hyponym+Hypernym 5 B T+S none standard in terms of recall and precision, but we could 6 A T none not match the performance that we achieved in previous years. In particular, precision for gradual transiTable 1: Overview over our six submitted runs in 2006 tion detection has suffered significantly in all runs. We use localised hsv colour histograms with 16 re- and the different indexes we used. Run 6 uses only the gions and 32 bins per dimension. Our system uses dif- speech transcripts provided by NIST, and serves as a ferent weights for histogram regions when computing baseline. frame differences. The mean average precision varied little between the We observe decreased performance compared to preruns, with small improvements over the baseline. Our vious years because of many falsely reported gradual term expansion schemes are highly query dependent; transitions. Cut detection performance suffered due to no particular strategy could be identified as being ophigh brightness levels in most video clips. Some of the timal across all queries. fixed thresholds that we use do not allow the algorithm Term expansion was rather harmful, we achieved the to adapt well to different types of footage. Our system best results when adding semantic concept terms withperformed best on videos that are similar to the 2004 out any expansion. Despite very good results during and 2005 test sets, such as those from cnn or nbc. training on the trecvid 2005 test set, we could not achieve significant improvements in the trecvid 2006 Video Search benchmark. Term expansion seems to introduce severe We combine visual high-level concept terms with an in- topic drift. While adding the semantic terms yields dex built from the speech transcripts in an early-fusion an improvement, it may skew the search engine’s term approach. We experimented with expanding concept frequency statistics too much due to the sparsely popterms by lexical semantic referencing before combining ulated index that is based on closed captions. them with the speech transcripts. Run overview
pre frames
1
2
frame number
3
4
5
6
7
post frames
1
2
3
4
5
8
9
10
11
12
moving window
13
1
2
3
4
5
14
15
16
17
18
19
20
21
current frame
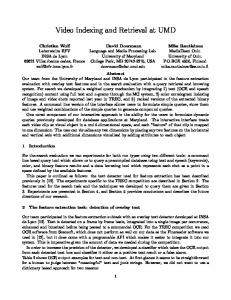
Figure 1: A moving query window with a half-window size (hws) of 5. The five frames before the current frame and the five frames after it form a collection on which the current frame is used as a query example. and allows fast text-based query execution. We describe the results we obtained when applying our sysThe task of identifying the basic semantic entities in tems to the trecvid 2006 shot boundary detection video clips — the shots [4] — is crucial for enabling and search tasks. search and retrieval. It is usually achieved by finding the transitions that constitute the boundaries between 2 Shot Boundary Detection adjacent shots. Most automatic shot boundary detection methods are based on the observation that frames At trecvid 2005 we used a two-pass implementation are similar when they are within a shot, and dissimilar of our moving query window algorithm [17, 23]. This when they span a transition. This generally holds for did not exhibit any improvement over the one-pass alall kinds of transitions, regardless of whether they are gorithm that we used in 2004 [21, 22]. Consequently, abrupt or gradual. we chose to use our 2004 system this year, but with The accurate detection of gradual transitions still parameters tuned on the 2005 test set. constitutes a more challenging problem [7, 8] compared Figure 1 shows a moving query window: the winto the detection of abrupt transitions, that is, cuts [2, dow has an equal number of frames on either side of 13, 18]. Results of standardised benchmarks such as a current frame, and the current frame is advanced or the trecvid shot boundary detection task support this moved as the video is processed. observation. Internally, the content of each frame is represented State-of-the-art content-based video search systems by one-dimensional histograms of the pixel hsv colour usually process information gained from analysing mul- coefficients. We extract localised histograms for 16 tiple modalities of the video content [15], that is, low- equal-sized regions in each frame. For each region, we level features, such as colour, texture, shape, and mo- extract a separate histogram with 32 bins per colour tion are used for semantic classification of individ- component. The quantised pixel information for all ual shots. This semantic classification is then used components are evaluated within a one-dimensional in combination with spoken text transcripts to facil- vector. itate multi-modal search and retrieval. The main steps Detecting gradual transitions is a rather different are mapping low-level features to high-level semantic problem from detecting abrupt transitions, and so we concepts, and fusing the information gained from the apply different evaluation approaches for these, but use visual domain and the text domain. The trecvid the same histogram data. Our implementation allows search task is designed to promote research in content- us to accomplish cut detection and gradual transition based video search, and investigates how multi-modal detection within a single pass. We discuss the details search approaches can improve retrieval performance of our approach next. compared to approaches that use only the spoken text. In this paper, we present our techniques for shot 2.1 Abrupt Transitions boundary detection and video search. In the shot boundary detection task, we used the moving query For cut detection, we use our ranking-based This method has proven to work window technique that we successfully applied in pre- method [18]. vious years [17, 18, 21, 22]. The focus of our experi- very effectively [17] with features derived from the ments this year was to test our algorithm on a wider Daubechies wavelet transform [3]; however, computarange of video content. In the video search task, we tion of wavelets is expensive. In 2003, to reduce comparticipated with a system that combines automati- putational cost, we used the ranking-based method in cally detected semantic concepts and spoken text in an combination with one-dimensional global histograms in early-fusion approach. This system uses lexical seman- the relatively simple hsv colour space [23]. Results tic referencing for expanding terms at indexing time, were strong, although not as good as those obtained 1
Introduction
2
with the wavelet feature. In 2004 we were able to improve cut detection quality by using localised hsv histograms. Scenes with rapid object movement are difficult to correctly delineate, and sometimes lead to false detections. Other groups apply motion compensation techniques to handle such cases [12, 24] but this adds additional computational overhead. We have observed that the main activity typically occurs in the focus area — usually in the centre — of frames. This lead us to investigate the effect of assigning less weight to the centre of each frame when comparing inter-frame differences. We divide each frame into 16 equal-sized regions and extract a local hsv histogram for each region. When comparing frames in the moving query window, we assign a weight to each region, allowing fine-grain control over the significance attached to an area of the frame; as discussed previously, this allows the weight associated with the middle of the frame — the region typically affected by rapid object movement — to be reduced. During our training experiments, we observed that this technique is most accurate when the four central regions (the focus area) of the frame are ignored. This can also result in faster feature extraction and shot boundary detection if the system extracts and compares the histograms for only the frame regions that are actually used in the comparisons. The cut detection experiments described in this paper ignore the central four frame regions during comparisons. However, we do not exclude these regions during feature extraction, since, as we describe next, we use them when detecting gradual transitions. 2.2
frames using the average distance between corresponding regions of the two frames, with identical weights for all regions. We found that assigning different weights to regions does not improve the detection results. However, using localised histograms with the average distance of corresponding regions does improve precision compared to using global histograms. 2.3
Algorithm Details
An important parameter of our system is the size of the moving window. We describe this by referring to the number of frames on either side of the current frame, known as the Half-Window Size (hws). We have experimented with different sizes for cut detection and gradual transition detection. We have used the same empirically-determined optimum hws for cut detection since 2004 [22]. However, it is difficult to determine an optimal window size for all gradual transitions across different types of footage. The appropriate hws is closely tied to the average length of the transitions in the footage. In trecvid 2004, the video content is limited to television news; we have found that we achieve best results for this footage when using hws=14. When training on the trecvid 2005 test set, we achieved the best results using hws=18, and so used this setting for our blind runs on the trecvid 2006 test set. For peak detection, we use a dynamic threshold calculated using some of the past frames that we store in a history buffer. The size of this buffer is controlled by the Threshold History Size (ths) factor; the number of frames in the buffer is the number of frames in the moving query window, multiplied by ths. We store the ratio between the pre-frames difference and postframes difference for each frame in this buffer, compute the average ratio over all frames of the buffer, and determine the current threshold value based on the standard deviation from the actual curve. We additionally control the computed threshold with an Upper Threshold Factor (utf). Both ths and utf can then be used to fine-tune the technique for different video content. A larger history results in a less dynamic threshold curve. Varying utf has a direct impact on recall but can help to reduce false detections in low quality, noisy footage. The goal of the parameter variation in our run submissions was to find optimal settings for modern television news sequences. For a transition to be reported, we require that the last frame of the previous shot and the first frame of the next shot have a minimum dissimilarity [18]. Given that the frames within a single shot are usually similar — independent of the type of transition — it seems
Gradual Transitions
Our main focus this year was on improved detection of gradual transitions. Our approach is also based on the moving query window, but in contrast to our cut detection stage, the frames are not ranked. Instead, for each frame in the moving window, we compute the similarity to the current frame. Frames on either side of the current frame are then combined into two sets of preand post-frames, and the average similarity of each set to the current frame is determined. We then monitor the ratio between the average similarities, allowing us to detect gradual transitions by observing peaks in the ratio curve [21]. We observed strong results with this technique in 2004, and still good but slightly weaker performance in 2005. We use the same one-dimensional, localised hsv histograms as used in cut detection, again divided into 16 regions per frame. For gradual transitions, we compare 3
Figure 2: A screen-shot of our Sapphire search engine web front-end. It allows efficient text-based video search. Results are visualised for each returned shot using a single static representative frame. reasonable to apply this requirement to both cuts and gradual transitions. Therefore, after detecting a possible transition, we compare the frame immediately before the start of the possible transition to the frame directly after the end of the possible transition. We refer to this as the PrePost Frame Threshold (P Pmax ), and express it as the percentage of the average interframe distance of the collection. Interestingly, we observe the best results when applying different threshold values for cuts and gradual transitions. Based on training experiments, we have established optimal values of P Pmax ≈ 40% for cuts and P Pmax ≈ 9% for gradual transitions. Part of our experiments was to vary this parameter and to find optimal settings for the 2006 test collection.
level concept detection results kindly provided by the The University of Amsterdam MediaMill Team1 for use by trecvid 2006 participants [16]. Apart from our baseline run, which uses only the speech transcripts that are provided as part of the test collection, our runs are therefore classified as Type B [10]. All six submitted runs were fully-automatic search runs. The Linguistic Data Consortium (ldc)2 provided speech transcripts for all videos of the test collection based on Closed Captions (cc) and Automatic Speech Recognition (asr).3 Closed captions and asr transcripts were available for most of the US American sources, and machine-translated asr transcripts were available for the Chinese and Arabic sources. We have previously observed generally better retrieval performance for text-based search when using closed caption text rather than asr transcripts, as the former has sig3 Video Search nificantly fewer errors. For this reason, we use closed captions where available, and fall back to using asr This is our first attempt at video search, and we re- transcripts for clips that have no provided closed capgard our techniques as preliminary and experimental. tions. In addition, time and resource constraints did not al1 http://www.science.uva.nl/research/mediamill low us to perform the process of extracting low-level 2 http://www.ldc.upenn.edu 3 The asr text was produced using the BBN Audio Indexer features and mapping these to semantic high-level concepts ourselves. Instead, we used the automatic high- System. 4
3.1
System and Experiments Description
query-refinement techniques [19], the improvements are somewhat query-dependent. In particular, we observed the best performance for queries concerning named persons, locations, or organisation when using only the speech transcripts, and without using concept terms in any form. For all other query types, we achieved improved mean average precision when adding the concept terms and applying term expansion. To cater for this, we implemented a query-dependent approach by analysing the query text using the namedentity detector that is part of the OpenNLP Tools.7 This allows us to identify query terms that indicate whether a query concerns a person, a location, or an organisation. Based on this named-entity detection, our system invokes a search using an appropriate specialised inverted index. We now describe the six runs that we submitted as part of trecvid this year. Several of the runs rely on selected concept terms; we describe how the conceptterm selection process operates later in this section.
Our approaches focussed on efficient text-based querying without the need for any visual query examples. Using the common shot-boundary reference provided by the Fraunhofer Institute [11], we segment the speech transcripts based on the given timing, and align them with the video shots. Each video shot is therefore represented by a text document that contains the text spoken during that shot. For our baseline search approach, we build an inverted index for the shot-aligned text document collection using a standard text search engine. In our experiments, we used the Indri text search engine [1, 9] that is part of the Lemur Toolkit4 developed by Carnegie Mellon University and the University of Massachusetts, Amherst. We apply the Indri Porter stemming algorithm and use the built-in pseudo-relevance feedback technique in all our runs. We tuned the parameters for the pseudo-relevance feedback during training on the trecvid 2005 test set. Our Sapphire search system provides a web-based text query front-end, as shown in Figure 2. Sapphire processes queries fully automatically and represents retrieved answer shots with its associated representative frame; these representative frames were provided by the Centre for Digital Video Processing (cdvp)5 at Dublin City University (dcu). For our trecvid experiments we used the system’s batch query interface that allows sequential processing of multiple queries and generates XML formatted ranked result lists for evaluation. We experimented with an early-fusion approach to incorporate visual features into our search while still being able to provide efficient text-based querying using an inverted index. Our strategy was to extend the baseline approach by including the terms of the automatically detected visual concepts into the shot-aligned text document collection. In this way, we are able to retrieve shots through term-matching not only if a search term is part of the spoken text, but also if the named concept has been detected as being present in the visual content. While this allows shots to be retrieved if a query uses the exact concept terms, we also wanted to enable retrieval for queries that include terms that are semantically related to the concepts. We therefore experimented with different term expansion strategies using lexical semantic referencing with WordNet6 [5]. We observed significant improvements during training with this technique, but also noticed that as with many
rmit1: In this run, we select the concept terms to be added for each shot based on the concept detector confidence score that is provided as part of the MediaMill concept detector output. We retrieve the corresponding hyponyms from the WordNet database for each concept term associated with the shot. We then add the selected concept terms and their hyponyms to the speech transcript of the shot. The search operation uses an inverted index of the resulting text documents. rmit2: In Run 2 we use a query-dependent approach. Using the OpenNLP named-entity finder, our system analyses the query text and checks whether the query is about a specific person, a specific location, or an organisation. If it is, the search operation uses only the speech transcripts. If not, the search is performed with the same inverted index as Run 1. rmit3: Here, we retrieve WordNet hypernyms associated with each concept term. We add the selected concept terms and their hypernyms to the speech transcript of the shot. rmit4: In this run, we combine the strategies of Run 1 and Run 3. We retrieve both hyponyms and hypernyms from WordNet for each concept term, and add these to the speech transcript alongside the concept terms.
4 http://www.lemurproject.org 5 http://www.cdvp.dcu.ie
7 http://opennlp.sourceforge.net
6 http://wordnet.princeton.edu
5
������ ������ ������ ������
���� ��� ��� � ��� ��� �����
������ ������ ������ ��� �� ��� �� ��� �� ��� �� ������ ������ ������ �������� ������������ ����������� ����������� ��������� �� ����������� ����������� ����� �� ������ ���������� ����������� ����� ���!����
������ ������ ������ ������ ������ ���
���
����
���
����
���
���
���
���
��
��
���������� � � ���� � � ���� ���� ��� ������ � �
Figure 3: Performance of our system in training runs on the trecvid 2005 test set when varying the minimum confidence threshold t for concept selection. Nearly all approaches yield the best performance for t = 0.15. The query-dependent approach achieved the best overall mean average precision. rmit5: In this run, we do not use lexical semantic ref- annotation data on the trecvid 2006 training corpus erencing and add only the selected concept terms that they used as the ground-truth during training. We used this data to estimate the prevalence of each conto the speech transcript of the shot. cept in the test collection, that is, we extrapolate the rmit6: This is our baseline run that uses only an inprevalence of each concept in the training collection to verted index based on the provided speech tranthe test collection. This allows us to calculate the spescripts. cific number of shots that we expect to contain each We now describe our concept-term selection, query concept. Given that the training and test collections pre-processing, and query analysis techniques in detail. are highly correlated in terms of their semantics, we believe that this is a reasonable assumption. 3.2 Selection of Semantic Concepts To add semantic concept terms to the shot-aligned The MediaMill team at the University of Amster- text documents in our collection, we add the concept dam has provided semantic concept annotation for the term of the n top-ranked shots from the automatically trecvid 2006 test corpus based on automatic detec- detected concepts, where n is the number of expected tion of 101 concepts. The annotation is provided as a relevant shots for the given concept. For some conlist of shot reference IDs for each concept, ranked by cepts, however, this may mean that we add many false the confidence score obtained from the automatic con- detections, in particular if the confidence score for a cept detector. The MediaMill team has provided the concept is generally very low. To alleviate this efoutput of their system from different experiments [16] fect, we specify a minimum confidence score that must using a support-vector machine for automatic classifi- be satisfied globally. We have determined the optimal cation. We leveraged the output of their Experiment 1 threshold for the minimum confidence score during our that was designed to classify shots based on several training experiments on the trecvid 2005 test set to be t = 0.15. The mean average precision observed durvisual low-level features [16]. Besides this automatically detected concept anno- ing these training runs are shown in Figure 3.1. We tation, the MediaMill team also provided the manual have conducted runs with the same strategies as de6
1.0
1.0
RMIT, gradual transitions Others, gradual transitions
RMIT, cuts Others, cuts 0.9 0.9 7 3 9 45 1 8 1 20 6
Average Precision
Average Precision
0.8
0.8
0.7
0.7
0.6
0.5 6 10 8
0.6 24
59 7
0.4
0.5
13
0.3 0.5
0.6
0.7
0.8
0.9
1.0
0.3
Average Recall
0.4
0.5
0.6
0.7
0.8
0.9
1.0
Average Recall
Figure 4: Performance of our system on cut detection. Figure 5: Performance of our system for gradual tranWhile maintaining a high standard, we could not match sition detection. Compared to previous years, we mainthe performance of previous years. tained high recall, but lost precision. maximum-entropy machine-learning system9 . Due to resource constraints, we did not train models specifically for our purposes, but instead relied on the default models included in the OpenNLP package. While the results were generally very good, we observed occasional detection errors that might be avoided with better models.
scribed in Section 3.1. As can be seen from the figure, in our best training runs we have achieved improvements of over 60% in mean average precision over the baseline. 3.3
Query Preparation and Analysis
Our system processes all the queries provided by nist for part-of-speech tagging after removing the common request phrase, “Find shots of ...”. Part-of-Speech tagging allows us to retain only the nouns of the query text. In past experiments, this technique has shown to yield generally better results than using the full query text. For visual retrieval purposes, the nouns in a query tend to provide the best context for the information need. As our training runs suggested that best retrieval performance can be achieved with a query-dependent approach, we classify queries based on automatic named-entity detection. If we have determined the query to be about a specific person, location, or organisation, we invoke a search based on the speech transcripts only. For all other queries, we invoke the search that uses an index built from speech transcripts, with semantic concept terms and relevant hyponyms added. We used the named-entity detector and the part-of-speech tagger that are part of the OpenNLP Tools.8 These are model-based detectors that use a
4
Results and Discussion
In this section we discuss results of our systems for shot boundary detection and video search when applied to the trecvid 2006 test sets in the respective tasks. 4.1
Shot Boundary Detection
The shot boundary detection test set consisted of 13 video files with a total duration of approximately 5 hours and 30 minutes. There are 3 785 transitions, of which 1 844 are labelled as cuts, and 1 941 are labelled as gradual transitions, such as fades and dissolves. Figure 4 shows the cut-detection performance of our runs and the runs of other participants, measured in terms of recall, precision, and the trecvid quality measure [14]. Our algorithm was set to produce an optimum trade-off between recall and precision according to this quality measure that slightly favours recall over precision. Our results are good, but do not match the performance of previous years [20, 22].
8 http://opennlp.sourceforge.net
9 http://maxent.sourceforge.net
7
Run 1 2 3 4 5 6 7 8 9 10
P Pmax Cuts Grad. 40% 9% 40% 9% 42% 9% 42% 9% 40% 9% 40% 9% 42% 9% 42% 9% 42% 8% 42% 8%
ths 1 2 1 2 1 2 1 2 1 2
All Q 0.709 0.713 0.708 0.711 0.726 0.729 0.724 0.727 0.724 0.727
utf 1.6 1.6 1.6 1.6 1.7 1.7 1.7 1.7 1.7 1.7
Transitions R P 0.853 0.700 0.842 0.721 0.850 0.700 0.839 0.721 0.846 0.732 0.835 0.751 0.843 0.732 0.832 0.751 0.843 0.732 0.832 0.751
Q 0.840 0.840 0.839 0.839 0.840 0.840 0.839 0.839 0.839 0.839
Cuts R 0.893 0.893 0.889 0.889 0.893 0.893 0.889 0.889 0.889 0.889
P 0.875 0.874 0.879 0.878 0.875 0.874 0.879 0.878 0.879 0.878
Q 0.112 0.165 0.107 0.159 0.257 0.288 0.251 0.284 0.251 0.284
Gradual Transitions R P FR 0.781 0.398 0.889 0.741 0.422 0.793 0.782 0.397 0.879 0.742 0.421 0.794 0.756 0.438 0.880 0.716 0.464 0.822 0.757 0.436 0.888 0.716 0.462 0.823 0.757 0.436 0.889 0.716 0.462 0.823
FP 0.698 0.776 0.704 0.776 0.704 0.773 0.698 0.773 0.698 0.773
Table 2: Detailed recall and precision results for all shot boundary detection runs with our system, along with the varied parameters: PrePost frame threshold (P Pmax ); upper threshold factor (utf); and Threshold History Size (ths). P Pmax is expressed as the percentage of the average inter-frame distance that is expected from training. 1.0
1.0 RMIT, all transitions Others, all transitions
RMIT Others
0.9
Average Frame Precision
Average Precision
0.9
0.8 10 86 975 42
0.7
31
0.6
0.8 24
10 68
35971
0.7
0.6
0.5
0.5 0.5
0.6
0.7
0.8
0.9
1.0
0.5
Average Recall
0.6
0.7
0.8
0.9
1.0
Average Frame Recall
Figure 6: Performance of our system for all transitions Figure 7: Frame recall and frame precision of our syson the trecvid 2006 shot boundary detection task, tem for gradual transitions on the trecvid 2006 shot measured by recall and precision. boundary detection task. seem too low for the trecvid 2006 collection, and led to many false detections. For the combined results in cut and gradual transition detection — as shown in Figure 6 — our system still shows competitive results. However, the poor precision in gradual transition detection has a clear impact on the overall results, and we have not matched our good results of previous years. Figure 7 shows Frame Recall and Frame Precision to measure how accurately the start and end of gradual transitions are detected. We observe good results, similar to those of 2005. Table 2 shows detailed results of all runs with parameter details. Timing results are nearly identical between runs. We measured processing time as the sum of the CPU times
In Figure 5, the recall and precision of our technique for gradual transitions is shown, as are the results of the other submissions. We have varied parameters to explore optimal quality, and our runs show the variation in trade-off between recall and precision. We have maintained the high recall of previous years [20, 22], but precision has suffered significantly this year. The fact that nearly all videos had very high brightness levels may have contributed to our poor results: we do not apply any pre-processing to cater for such effects. Moreover, some of the fixed algorithm parameters that we use, such as P Pmax and utf do not allow our algorithm to adapt well to different types of footage. For example, the values of P Pmax ≈ 9% that we established during training on the trecvid 2005 test set 8
Topic 173 174 175 176 177 178 179 180 181 182 183 184 185 186 187 188 189 190 191 192 193 194 195 196 Avg.
baseline MAP 0.0026 0.0003 0.0005 0.0007 0.0396 0.2264 0.1290 0.0000 0.0008 0.0327 0.0212 0.0078 0.0087 0.0017 0.0351 0.0426 0.0002 0.0016 0.0052 0.0004 0.0000 0.1496 0.0143 0.1134 0.0348
(rmit6) P@20 0.0000 0.0000 0.0000 0.0000 0.0000 0.5000 0.2500 0.0000 0.0000 0.3000 0.2000 0.0500 0.1000 0.0000 0.1500 0.3500 0.0000 0.0000 0.0000 0.0000 0.0000 0.4000 0.2500 0.3000 0.1188
rmit1 MAP P@20 0.0016 0.0000 0.0002 0.0000 0.0000 0.0000 0.0008 0.0000 0.0274 0.0500 0.2170 0.5500 0.0989 0.1500 0.0000 0.0000 0.0131 0.1500 0.0078 0.0000 0.0100 0.1000 0.0092 0.1000 0.0415 0.1000 0.0099 0.3000 0.0309 0.1500 0.0529 0.4000 0.0003 0.0000 0.0012 0.0500 0.0022 0.0000 0.0001 0.0000 0.0005 0.0000 0.1593 0.3500 0.1183 0.4000 0.0705 0.5000 0.0364 0.1396
rmit2 MAP P@20 0.0016 0.0000 0.0002 0.0000 0.0000 0.0000 0.0008 0.0000 0.0274 0.0500 0.2264 0.5000 0.1290 0.2500 0.0000 0.0000 0.0008 0.0000 0.0078 0.0000 0.0100 0.1000 0.0092 0.1000 0.0415 0.1000 0.0099 0.3000 0.0309 0.1500 0.0529 0.4000 0.0003 0.0000 0.0012 0.0500 0.0022 0.0000 0.0001 0.0000 0.0005 0.0000 0.1594 0.3500 0.1183 0.4000 0.0705 0.5000 0.0375 0.1354
rmit3 MAP P@20 0.0020 0.0000 0.0002 0.0000 0.0010 0.0500 0.0008 0.0000 0.0332 0.0500 0.2225 0.5500 0.1024 0.1500 0.0003 0.0000 0.0104 0.1000 0.0072 0.0000 0.0166 0.2500 0.0089 0.1000 0.0284 0.0000 0.0009 0.0000 0.0327 0.1500 0.0519 0.4500 0.0003 0.0000 0.0014 0.0000 0.0030 0.0000 0.0001 0.0000 0.0003 0.0000 0.1578 0.3500 0.1439 0.5500 0.0755 0.5000 0.0376 0.1354
rmit4 MAP P@20 0.0029 0.0000 0.0002 0.0000 0.0011 0.0000 0.0009 0.0000 0.0323 0.0500 0.2077 0.5000 0.0920 0.1500 0.0005 0.0000 0.0073 0.1000 0.0039 0.0000 0.0102 0.1000 0.0111 0.1000 0.0645 0.2500 0.0117 0.1500 0.0320 0.1500 0.0475 0.4000 0.0004 0.0000 0.0013 0.0000 0.0012 0.0000 0.0001 0.0000 0.0006 0.0000 0.1608 0.4000 0.1014 0.3000 0.0561 0.5000 0.0353 0.1312
rmit5 MAP P@20 0.0020 0.0000 0.0003 0.0000 0.0001 0.0000 0.0005 0.0000 0.0402 0.0500 0.2250 0.5000 0.1233 0.2500 0.0000 0.0000 0.0025 0.0000 0.0162 0.0000 0.0201 0.2000 0.0082 0.1000 0.0182 0.0500 0.0048 0.1000 0.0355 0.1500 0.0473 0.4000 0.0004 0.0500 0.0014 0.0000 0.0050 0.0000 0.0003 0.0000 0.0010 0.0000 0.1541 0.3500 0.1353 0.4500 0.0971 0.3000 0.0391 0.1229
Table 3: Mean Average Precision (MAP) and precision at 20 returned results for each query and for all our submitted runs. We were not able to translate the good training results into significant improvements on the trecvid 2006 test set. While precision at 20 returned results improves in most cases, mean average precision remains at a low level, with insignificant improvements over the baseline. in system and user mode for each run. As we use only one feature, decoding times are identical for each run with 15 163.35 seconds to decode all 13 clips of the test set. The evaluation times varied between 364.99 seconds for Run 10 and 391.21 seconds for Run 2. The average evaluation time was 381.13 seconds for the complete test set. On average, our system took 4 hours and 19 minutes to process the trecvid 2006 shot boundary test set — approximately 78% of real time. The timing experiments were performed on a single CPU Intel-based machine with a 3GHz Pentium-4 Hyperthreading processor, 1,024 MB of main memory, and running openSuSE Linux 10.1 with the standard kernel (2.6.13-15.11-smp). Our current implementation, especially the decoding stage, is not optimised for efficiency, and does not make use of multiple threads. This means that we are not leveraging the full power of the Hyperthreading CPU.
nese, and Arabic sources. The news sections were interrupted by sections of advertisements and short entertainment sections. Results in terms of mean average precision and precision at 20 returned results are shown in Table 3. We report the precision at 20 results because this is the number of results that our search engine returns on the first page. In all runs, we have been able to achieve improvements over the baseline. However, the results are generally substantially weaker than those that we obtained during training on the trecvid 2005 set. While mean average precision improves marginally over the baseline, it remains rather low. The precision within the first 20 returned results improved more substantially; for example, Run 1 shows a 17.5% improvement over the baseline.
This shows that our approach causes more relevant results to be shown on the first page. In contrast to our observations during training, our best run in terms 4.2 Video Search of mean average precision was Run 5 with a 12.8% imThe search test set in trecvid 2006 is substantially provement over the baseline. In this run, we have not larger than the collections of previous years [6, 10] and used term expansion and only added semantic concept consisted of 259 video clips with a total duration of terms to the speech-based index. However, according nearly 160 hours. The clips were mostly recordings to the Student’s T-Test, the improvements that we obof television news from different US American, Chi- serve for precision at 20 results and for mean average 9
��� �� ������ ������ ������ ������
����� � �
��� �� ������ ������
������ ����� �����
������ ������ ��� �� ������ ������ ������ ������ ����
����
����
����
����
����
����
�� �
�� �
����
����
������
Figure 8: Interpolated recall and precision for our two best search runs compared to the baseline on the trecvid 2006 test set. Run 1 performed best in precision at 20 resturned results and Run 5 achieved best mean average precision. precision are not statistically significant. Interpolated recall and precision shows little variation across all our submitted runs. In Figure 8 we have illustrated this for our two best runs in comparison to the baseline. We achieved best precision at 20 returned results with Run 1 and best mean average precision in Run 5. The results for all runs where we used semantic term expansion lead us to conclude that this may have lead to topic drift. Generally, our results are not competitive, and we observe improvements for only a few individual queries, and the overall mean average precision is low. 5
Conclusions and Future Work
unable to obtain similar results on the trecvid 2006 test set. Several factors may have contributed to this. We suspect that semantic term expansion may have caused severe topic drift, and our strategy for adding the semantic concept terms on the basis of information from the training set may have been sub-optimal. Moreover, we do not have control over the full process, from training automatic concept classifiers to fusion of modalities, and this complicates the task of optimising the visual search process. We will investigate these factors in future work. Nevertheless, we believe we have provided an interesting approach for efficient text-based video retrieval by incorporating visual concept-detection data as part of the search process.
We have presented our approaches to shot boundary References detection and video search. Our moving query window approach for detecting shot boundaries allows ef- [1] N. Abdul-Jaleel, J. Allan, W. B. Croft, F. Diaz, fective shot segmentation of news video based on only L. Larkey, X. Li, D. Metzler, M. D. Smucker, a single histogram feature. We plan to replace some T. Strohman, H. Turtle, and C. Wade. UMass of the fixed algorithm parameters with dynamic ones at TREC 2004: Notebook. In E. M. Voorhees and that better allow the algorithm to adapt to different L. P. Buckland, editors, NIST Special Publication types of footage. 500-261: Proceedings of the Thirteenth Text REThe approaches that we have tested for fully autotrieval Conference (TREC 2004), Gaithersburg, matic search did not yield any statistically significant MD, USA, 16–19 November 2004. improvements over the text-based baseline. While our training runs showed very promising results, we were [2] B. Adams, A. Amir, C. Dorai, S. Ghosal, G. Iyengar, A. Jaimes, C. Lang, C.-Y. Lin, A. Natsev,
10
M. Naphade, C. Neti, H. J. Nock, H. H. Per2004 Workshop Notebook Papers, Gaithersburg, muter, R. Singh, J. R. Smith, S. Srinivasan, B. L. MD, USA, 15–16 November 2004. Tseng, T. V. Ashwin, and D. Zhang. IBM Re[12] G. M. Qu´enot. TREC-10 shot boundary detecsearch TREC-2002 Video Retrieval System. In tion task: CLIPS system description and evaluE. M. Voorhees and L. P. Buckland, editors, ation. In E. M. Voorhees and D. K. Harman, NIST Special Publication 500-251: Proceedings of editors, NIST Special Publication 500-250: Prothe Eleventh Text REtrieval Conference (TREC ceedings of the Tenth Text REtrieval Conference 2002), pages 289–298, Gaithersburg, MD, USA, (TREC 2001), pages 142–151, Gaithersburg, MD, 19–22 November 2002. USA, 13–16 November 2001. [3] I. Daubechies. Ten Lectures on Wavelets. Society [13] G. M. Qu´enot, D. Moraru, and L. Besacier. CLIPS for Industrial and Applied Mathematics, Philadelat TRECVID: Shot boundary detection and feaphia, PA, USA, 1992. ture detection. In E. M. Voorhees and L. P. Buckland, editors, TRECVID 2003 Workshop Note[4] A. Del Bimbo. Visual Information Retrieval. Morbook Papers, pages 35–40, Gaithersburg, MD, gan Kaufmann Publishers Inc., San Francisco, USA, 17–18 November 2003. CA, USA, 2001. [14] R. Ruiloba, P. Joly, S. Marchand-Maillet, and G. M. Qu´enot. Towards a standard protocol for the evaluation of video-to-shots segmentation algorithms. In Proceedings of the European W. Kraaij, A. F. Smeaton, P. Over, and J. ArlanWorkshop on Content-Based Multimedia Indexing dis. TRECVID-2004 – An introduction. In E. M. (CBMI’99), pages 41–48, Toulouse, France, 25–27 Voorhees and L. P. Buckland, editors, TRECVID October 1999. 2004 Workshop Notebook Papers, Gaithersburg, [15] C. G. M. Snoek and M. Worring. Multimodal MD, USA, 15–16 November 2004. Video Idexing: A Review of the State-of-the-art. R. W. Lienhart. Reliable transition detection in Multimedia Tools and Applications, 25(1):5–35, videos: A survey and practitioner’s guide. InterJanuary 2005. national Journal of Image and Graphics (IJIG), [16] C. G. M. Snoek, M. Worring, J. C. van Gemert, J.1(3):469–486, July 2001. M. Geusebroek, and A. W. Smeulders. The ChalS. Marchand-Maillet. Content-based video relenge Problem for Automated Detection of 101 Setrieval: An overview. Technical Report 00.06, mantic Concepts in Multimedia. In Proceedings of CUI - University of Geneva, Geneva, Switzerland, the ACM International Conference on Multimedia 2000. 2006, Santa Barbara, CA, USA, 23–27 October 2006. ACM Press, NY, USA. D. Metzler and W. B. Croft. Combining the Language Model and Inference Network Approaches [17] S. M. M. Tahaghoghi, J. A. Thom, and H. E. to Retrieval. Information Processing and ManWilliams. Shot boundary detection using the agement Special Issue on Bayesian Networks and moving query window. In E. M. Voorhees and Information Retrieval, 40(5):735–750, 2004. L. P. Buckland, editors, NIST Special Publication 500-251: Proceedings of the Eleventh Text REP. Over, T. Ianeva, W. Kraaij, and A. F. trieval Conference (TREC 2002), pages 529–538, Smeaton. TRECVID-2005 – An Introduction. In Gaithersburg, MD, USA, 19–22 November 2002. P. Over and T. Ianeva, editors, TRECVID 2005 Workshop Notebook Papers, Gaithersburg, MD, [18] S. M. M. Tahaghoghi, J. A. Thom, H. E. Williams, USA, 14–15 November 2005. and T. Volkmer. Video cut detection using frame http://www-nlpir.nist.gov/projects/ windows. In V. Estivill-Castro, editor, Proceedings tvpubs/tv5.papers/tv5intro.pdf. of the Twenty-Eighth Australasian Computer Science Conference (ACSC 2005), volume 38, NewC. Petersohn. Fraunhofer HHI at TRECVID 2004: castle, NSW, Australia, 31 January – 3 February Shot boundary detection system. In TRECVID 2005. Australian Computer Society.
[5] C. Fellbaum and Others. WordNet – An Electronic Lexical Database. The MIT Press, Boston, MA, USA, May 1998. [6]
[7]
[8]
[9]
[10]
[11]
11
[19] T. Volkmer and A. Natsev. Exploring Automatic tion Workshop (CVPRW’04, Volume 9, 27 June Query Refinement for Text-Based Video Retrieval. 2 July 2004.]). In Proceedings of the IEEE International Conference on Multimedia & Expo (ICME), Toronto, [22] T. Volkmer, S. M. M. Tahaghoghi, and H. E. Williams. RMIT University at TRECVID-2004. Ontario, Canada, 9–12 July 2006. To appear. In TRECVID 2004 Workshop Notebook Papers, [20] T. Volkmer, S. M. M. Tahaghoghi, and J. A. Gaithersburg, MD, USA, 2004. Thom. RMIT University Video Shot Boundary Detection at TRECVID-2005. In P. Over and [23] T. Volkmer, S. M. M. Tahaghoghi, H. E. Williams, and J. A. Thom. The moving query winT. Ianeva, editors, TRECVID 2005 Workshop dow for shot boundary detection at TREC-12. Notebook Papers, Gaithersburg, MD, USA, 14–15 In TRECVID 2003 Workshop Notebook Papers, November 2005. pages 147–156, Gaithersburg, MD, USA, 17–18 November 2003. [21] T. Volkmer, S. M. M. Tahaghoghi, and H. E. Williams. Gradual transition detection using average frame similarity. In S. Guler, A. G. Haupt- [24] L. Wu, X. Huang, J. Niu, Y. Xia, Z. Feng, and Y. Zhou. FDU at TREC 2002: Filtering, Q&A, mann, and A. Henrich, editors, Proceedings of web and video tracks. In E. M. Voorhees and the Conference on Computer Vision and Pattern L. P. Buckland, editors, NIST Special Publication Recognition Workshop (CVPR-04), Washington, 500-251: Proceedings of the Eleventh Text REDC, USA, 2 July 2004. IEEE Computer Society. trieval Conference (TREC 2002), Gaithersburg, [also published as: Proceedings of the ConferMD, USA, 19–22 November 2002. ence on Computer Vision and Pattern Recogni-
12