Nov 25, 2015 - initial condition. If the latter lies in the basin of attraction of a certain equilib- ... that determine the domains of attraction, when bistability occurs, as a particular case of the ... The MAtlAB software here discussed is available at:.
arXiv:1511.08110v1 [math.NA] 25 Nov 2015
Robust approximation algorithms for the detection of attraction basins in dynamical systems Roberto Cavoretto∗, Alessandra De Rossi∗ , Emma Perracchione∗ and Ezio Venturino∗ ∗
Department of Mathematics G. Peano, University of Turin - Italy
Abstract. In dynamical systems saddle points partition the domain into basins of attractions of the remaining locally stable equilibria. This problem is rather common especially in population dynamics models. Precisely, a particular solution of a dynamical system is completely determined by its initial condition and by the parameters involved in the model. Furthermore, when the omega limit set reduces to a point, the trajectory of the solution evolves towards the steady state. But, in case of multi-stability it is possible that several steady states originate from the same parameter set. Thus, in these cases the importance of accurately reconstruct the attraction basins follows. In this paper we focus on dynamical systems of ordinary differential equations presenting three stable equilibia and we design algorithms for the detection of the points lying on the manifolds determining the basins of attraction and for the reconstruction of such manifolds. The latter are reconstructed by means of the implicit partition of unity method which makes use of radial basis functions (RBFs) as local approximants. Extensive numerical test, carried out with a Matlab package made available to the scientific community, support our findings.
1
Introduction
Mathematical modelling is applied in major disciplines, such as biology, medicine and social sciences. The aim of such models lies in the prediction of the temporal evolution of the considered quantities (populations, cancer, divorces), [1, 23]. In a model involving a set of ordinary differential equations, a particular solution of the system is completely determined by the initial condition. The latter establishes the steady state of the solution. Moreover, we may also note that, under some conditions imposed on the model parameters and depending on the initial state, the trajectories, i.e. the model solutions, at the end of the observation period may stabilize at different equilibria. So the phase state of the dynamical system is partitioned into different regions, called the basins of attraction, depending on where the trajectories originating in them will ultimately stabilize. Thus, the prediction of a mathematical model depends on the initial condition. If the latter lies in the basin of attraction of a certain equilibrium point, the final configuration will be the one at this specific steady state. Therefore, it is important to assess, for each possible attractor, the domain of attraction. 1
In order to have a graphical representation of the separatrix manifolds we study the problem described above in dynamical systems composed by two or three equations. We have analyzed the problem of the reconstruction of the domains of attraction for competition models of dimension two and three which present bistability in [5, 7]. In this paper we instead focus on systems of two or three ordinary differential equations aimed at finding the basins of attraction of three different stable equilibria. Moreover, we propose the problem of the separatrix curves or surfaces that determine the domains of attraction, when bistability occurs, as a particular case of the algorithm described in this article. Thus, the aim of this work is to construct approximation surfaces which partition the phase space into three regions. The approximation of the attraction basins leads to a method consisting of two steps: 1. detection of the points lying on the separatrix manifolds, 2. interpolation of such points in a suitable way, [3, 8, 9, 17, 18, 24]. For this purpose we have implemented several Matlab routines for the approximation of the points lying on the manifolds determining the basins of attraction, obtained by a bisection algorithm, and for the graphical representation of such manifolds. The Matlab software here discussed is available at: http://hdl.handle.net/2318/1520518. The separatrix manifolds generated by a saddle point are determined locally (by linearization) in well-known examples, see e.g. [16]. Specifically, even if some techniques to prove the existence of invariant sets have already been developed, none of them, except for particular and well-known cases, allows to have a graphical representation of the separatrix manifolds, [11, 20]. Such techniques are based on results from algebraic topology, and thus such methods are not constructive in the sense that they do not give a precise structure and location of the invariant sets. Furthermore, numerical tools based on characterizing in (exponentially) asymptotically autonomous systems a Lyapunov function as a solution of a suitable linear first-order PDE have already been developed. Such equation is then approximated using meshless collocation methods, [13, 14]. Our aim is instead more ambitious since, on the contrary, the software presented here allows to reconstruct the basin of attraction of each equilibrium in a three-dimensional dynamical system, providing a graphical representation of the separatrix curves or surfaces. Moreover, we are not restricted to asymptotically autonomous systems and thus the transformations made in order to use powerful methods, which are well-suited only for autonomous models, are not here necessary. The paper is organized as follows. In Section 2 we describe the method used for approximating the manifolds determining the basins of attraction. Section 3 is devoted to the presentation of the designed algorithms for the detection of points lying on such surfaces. Section 4 contains our numerical results. 2
2
Approximation of manifolds determining the basins of attraction: interpolation phase
In this section we describe the method used for the reconstruction of the basins of attraction. The latter are often described by implicit equations, consequently we use an implicit scheme, specifically the implicit partition of unity method, to reconstruct the domains of attraction. We will describe such method for a 3D dataset, but it can easily be adapted to a 2D dataset so as to allow the reconstruction also of implicit curves [12]. However, an implicit approach is not always necessary for the approximation of some separatrix manifolds. In fact we have already obtained good results with the explicit partition of unity method, [5, 7]. But the nature of a curve or of a surface is known only after detecting the points lying on them. Thus, though such curves or surfaces might usually be expressed by an explicit equation, we use the more general implicit partition of unity technique. The use of such method is the key step which allows to reconstruct the basins of attraction of any stable equilibrium point.
2.1
Implicit surface reconstruction
Given a point cloud data set, i.e. data in the form XN = {xi ∈ R3 , i = 1, . . . , N }, belonging to an unknown two dimensional manifold M , namely a surface in R3 , we seek another surface M ∗ that is a reasonable approximation to M . For the implicit approach, we think of M as the surface of all points x ∈ R3 satisfying the implicit equation: f (x) = 0,
(1)
for some function f , which implicitly defines the surface M [12]. This means that the equation (1) is the zero iso-surface of the trivariate function f , and therefore this iso-surface coincides with M . The surface M ∗ is constructed via partition of unity interpolation, [12], as shown in Subsection 2.2. Unfortunately, the solution of this problem, by imposing the interpolation conditions (1), leads to the trivial solution, given by the identically zero function, [9]. The key to finding the interpolant of the trivariate function f , from the given data points xi , i = 1, . . . , N, is to use additional significant interpolation conditions, i.e. to add an extra set of off-surface points. Once we define the augmented data set, we can then compute a three dimensional interpolant I to the total set of points, [12]. A common practice is to assume that in addition to the point cloud data the set of surface oriented normals ni ∈ R3 to the surface M at the points xi is also given. We construct the extra off-surface points by taking a small step away along the surface normals, i.e. we obtain for each data point xi two additional off-surface points. One point lies outside the manifold M and is given by xN +i = xi + δni ,
3
whereas the other point lies inside M and is given by x2N +i = xi − δni ,
δ being the stepsize. The union of the sets Xδ+ = {xN +1 , . . . , x2N }, Xδ− = {x2N +1 , . . . , x3N } and XN gives the overall set of points on which the interpolation conditions are assigned. Note that if we have zero normals in the given normal data set, we must exclude such points, [12]. Now, after creating the data set, we compute the interpolant I whose zero contour (iso-surface I = 0) interpolates the given point cloud data, and whose iso-surfaces I = 1 and I = −1 interpolate Xδ+ and Xδ− .The values +1 or −1 are arbitrary. Their precise value is not as critical as the choice of δ. In fact the stepsize can be rather critical for a good surface fit, [2, 12]. A suitable value for such parameter will be discussed in Section 4. Finally, we just render the resulting approximating surface M ∗ as the zero contour of the 3D interpolant, [12]. If the normals are not explicitly given, see [17, 18].
2.2
Partition of unity method and radial basis function interpolation
In Subsection 2.1 we have presented an approach, to obtain a surface that fits the given 3D scattered data set, based on the use of implicit surfaces defined in terms of some meshfree approximation methods such as the partition of unity interpolation, [6, 8, 12, 22, 25, 26]. Let XN = {xi ∈ R3 , i = 1, . . . , N } be a set of distinct data points or nodes, arbitrarily distributed in a domain Ω ⊆ R3 , with an associated set FN = {fi , i = 1, . . . , N } of data values or function values, which are obtained by sampling some (unknown) function f : Ω → R at the nodes, i.e., fi = f (xi ), i = 1, . . . , N . The basic idea of the partition of unity method is to start with a partition of S the open and bounded domain Ω into d subdomains Ωj such that Ω ⊆ dj=1 Ωj with some mild overlap among the subdomains. Associated with these subdomains we choose a partition of unity, i.e. a family of compactly supported, non-negative, continuous functions Wj with supp(Wj ) ⊆ Ωj such that d X
Wj (x) = 1,
j=1
x ∈ Ω.
(2)
The global approximant thus assumes the following form I(x) =
d X
Rj (x)Wj (x),
j=1
x ∈ Ω.
(3)
For each subdomain Ωj we define a local radial basis function interpolant [19] Rj : Ω → R of the form Rj (x) =
Nj X
k=1
ck φ(||x − xk ||2 ), 4
(4)
where φ : [0, ∞) → R is called radial basis function, || · ||2 denotes the Euclidean norm, and Nj indicates the number of data points in Ωj . Moreover, Rj satisfies the interpolation conditions Rj (xi ) = fi ,
i = 1, . . . , Nj .
(5)
In particular, we observe that if the local approximants satisfy the interpolation conditions (5), then the global approximant also interpolates at xi , i.e. I(xi ) = f (xi ), for i = 1, . . . , Nj . Solving the j-th interpolation problem (5) leads to a system of linear equations of the form φ(||x1 − x1 ||2 ) · · · φ(||x1 − xNj ||2 ) c1 f1 .. .. .. .. .. . = . , . . . φ(||xNj − x1 ||2 )
···
φ(||xNj − xNj ||2 )
cN j
fNj
or simply
Φc = f . Now, we give the following definition (see [26]). Definition 2.1 Let Ω ⊆ R3 be a bounded set. Let {Ω}dj=1 be an open and bounded covering of Ω. This means that all Ωj are open and bounded and that Ω is contained in their union. A family of nonnegative functions {Wj }dj=1 with Wj ∈ C k (R3 ) is called a k-stable partition of unity with respect to the covering {Ωj }dj=1 if 1) supp(Wj ) ⊆ Ωj ; Pd 2) j=1 Wj (x) ≡ 1 on Ω;
3) for every β ∈ N30 with |β| ≤ k there exists a constant Cβ > 0 such that |β|
||Dβ Wj ||L∞ (Ωj ) ≤ Cβ /δj ,
j = 1, . . . , d,
where δj = diam(Ωj ) = supx,y∈Ωj ||x − y||2 . In agreement with the statements in [25] we require some additional regularity assumptions on the covering {Ωj }dj=1 . Definition 2.2 Suppose that Ω ⊆ R3 is bounded and XN = {xi , i = 1, . . . , N } ⊆ Ω are given. An open and bounded covering {Ωj }dj=1 is called regular for (Ω, XN ) if the following properties are satisfied: (a) for each x ∈ Ω, the number of subdomains Ωj with x ∈ Ωj is bounded by a global constant K; (b) each subdomain Ωj satisfies an interior cone condition [26];
5
(c) the local fill distances hXNj ,Ωj , where XNj = XN ∩ Ωj , are uniformly bounded by the global fill distance hXN ,Ω , i.e. hXN ,Ω = sup min ||x − xk ||2 . x∈Ω xk ∈XN
Let Cνk (R3 ) be the space of all functions f ∈ C k whose derivatives of order |β| = k satisfy Dβ f (x) = O(||x||ν2 ) for ||x||2 → 0. The following convergence result is well known (see, e.g., [12, 26]). Theorem 2.1 Let Ω ⊆ R3 be open and bounded and assume that XN = {xi , i = 1, . . . , N } ⊆ Ω. Let φ ∈ Cνk (R3 ) be a strictly positive definite function. Let {Ωj }dj=1 be a regular covering for (Ω, XN ) and let {Wj }dj=1 be k-stable for {Ωj }dj=1 . Then the error between f ∈ Nφ (Ω), where Nφ is the native space of φ, and its partition of unity interpolant (3) is bounded by (k+ν)/2−|β|
|Dβ f (x) − Dβ I(x)| ≤ ChXN ,Ω
|f |Nφ (Ω) ,
for all x ∈ Ω and all |β| ≤ k/2. If we compare this result with the global error estimates (see e.g. [26]), we can see that the partition of unity preserves the local approximation order for the global fit. This means that we can efficiently compute large RBF interpolants by solving small RBF interpolation problems and then glue them together with the global partition of unity {Wj }dj=1 .
3
Approximation of manifolds determining the basins of attraction
This section describes the algorithms implemented for the detection of points lying on the manifolds delimiting the basins of attraction. In Subsection 3.1 we discuss the problem of partitioning the phase space in three subregions, when the system presents three stable equilibria. Moreover, a final remark explains how the algorithm can be easily adapted in case of bistability.
3.1
Detection of points determining the basins of attraction of three different equilibria
In order to approximate the basins of attraction, when the system admits three stable equilibria, the general idea is to find the points lying on the surfaces determining the domains of attraction and finally to interpolate them with a suitable method. The steps of the so-called detection-interpolation algorithm are summarized in the 3D-Detec-Interp Algorithm. At first, we need to consider a set of points as initial conditions, then we take points in pairs and we proceed with a bisection routine to determine a point lying on a surface dividing the domains of attraction, [7]. The simplest idea, which turns out to be also reliable, 6
consists in considering the set of initial conditions in a cube domain [0, γ]3 , where γ ∈ R+ . Once we take points in pairs, if the two initial conditions evolve towards the first and second equilibrium point, respectively, a bisection routine is performed to find a point lying on the surface delimiting the basin of attraction of both the first and the second stable steady state. In the same way, if the trajectories of the two initial data converge to the first and third stable equilibrium point, a point lying on the surface determining the domain of attraction of the first and third attractor is found. Similarly, if the trajectories of the two initial data converge to the second and third stable equilibrium point, a point lying on the surface determining the domain of attraction of the second and third stable steady state is found, (see Step 5 in the 3D-Detec-Interp Algorithm). It means that the algorithm finds three sets of points, and the latter, taken in pairs, determine the basins of attraction of the three stable equilibria, (see Step 6 in the 3D-Detec-Interp Algorithm). Moreover, in the detection-interpolation algorithm, after considering n equispaced initial conditions on each edge of the cube [0, γ]3 , we construct a grid on the faces of the cube, (see Step 2 in the 3D-Detec-Interp Algorithm): Pi11 ,i2 = (xi1 , yi2 , 0) Pi31 ,i2 = (xi1 , 0, zi2 ) Pi51 ,i2 = (0, yi1 , zi2 )
and Pi21 ,i2 = (xi1 , yi2 , γ), and Pi41 ,i2 = (xi1 , γ, zi2 ), and Pi61 ,i2 = (γ, yi1 , zi2 ),
i1 , i2 = 1, . . . , n, i1 , i2 = 1, . . . , n, i1 , i2 = 1, . . . , n,
(6)
and a bisection routine is applied with initial conditions (6), [7]. We now analyze the inputs of the detection-interpolation algorithm: n ∈ N+ : number of equispaced points on each edge of the cube; it is used to define the set of initial data. γ ∈ R+ : edge length of the cube. tol ∈ R+ : tolerance used during the bisection routine. The latter stops when the distance between the last two generated midpoints is less than tol. t ∈ R+ : integration time, used during an integration routine. We cannot provide a suitable choice for this parameter because it depends on the dynamical system, but the algorithm checks if the allowed integration time is sufficient. par ∈ Rl+ : vector of model parameters, where l is the number of model parameters. The latter must be chosen so that the system presents three stable equilibria. npi ∈ N+ : number of equilibrium points to be interpolated, typically the origin when it is unstable and the point having all non zero coordinates, such as in population dynamics the coexistence equilibrium, if it is a saddle point.1 E ∈ RM×3 : matrix of the equilibria, where M is the total number of equilibria. 1 In case of two equilibria a saddle point partitions the phase space into two regions, called the basins of attraction of the equilibria. In case of three equilibria instead, several saddles are involved in the dynamics. But the three separating surfaces intersect together at only one saddle which corresponds to a point where all the populations are nonnegative.
7
Step 1: Check if the system presents exactly three stable equilibria. Step 2: Definition of initial conditions on the faces of the cube of edge γ. Set s = 1. Step 3: While s 0 is the shape parameter. Such parameter determines the size of the support of the basis function. Its choice can significantly affect the final result. Specifically, for the three manifolds, we choose the shape parameters so that 0.01 ≤ εi ≤ 0.1, i = 1, 2, 3. Assuming to have a nearly uniform node distribution such as the Halton points, according to [4], a possible choice for the number of subdomains centers consists in constructing a uniform grid of U s di = (dP i ) centers, where s is the dimension of the dynamical system and 1 PU di = ⌈1/2(Ni /2) s ⌉, i = 1, 2, 3. However, we point out that in our tests we U find good results even with different dP i , i = 1, 2, 3. This is due to the fact that we deal with concrete and unstructured data. Such choices, described above, are suitable assuming to start with 8 ≤ n ≤ 15 equispaced initial conditions on each edge of the cube [0, γ]3 . For the tolerance used in the bisection routine, a recommended value is 10−3 ≤ tol ≤ 10−5 , since it allows to achieve a good trade-off between accuracy and computational cost.
4.1
3D detection-interpolation tests
A model chosen to test the detection-interpolation algorithm is the classical three-populations competition model. Letting x, y and z denote the populations, we consider the following system dx = p 1 − x �x − axy − bxz, u dt
y� dy = q 1 − v y − cxy − eyz, dt
dz = r 1 − z �z − f xz − gyz, w dt
(8)
where p, q and r are the growth rates of x, y and z, respectively, a, b, c, e, f and g are the competition rates, u, v and w are the carrying capacities of the three populations. The model (8) describes the interaction of three competing populations within the same environment (see e.g. [15]). There are eight equilibrium points. The origin E0 = (0, 0, 0) and the points associated with the survival of only one population E1 = (u, 0, 0), E2 = (0, v, 0)
10
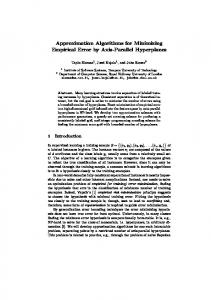
and E3 = (0, 0, w). Then we have the equilibria with two coexisting populations: � � � � ur(bw − p) uq(av − p) pv(cu − q) wp(f u − r) E4 = cuva − pq , cuva − pq , 0 , E5 = f uwb − rp , 0, f uwb − rp , � � vr(we − q) wq(vg − r) E6 = 0, gvwe − qr , gvwe − qr . Finally we have the coexistence equilibrium, � u[p(gvwe − qr) − avr(we − q) − bwq(vg − r)] E7 = , p(gvwe − qr) + uva(rc − f we) + uwb(f q − gcv) v[q(f uwb − pr) − rcu(wb − p) − pew(f u − r)] , q(f uwb − pr) + cuv(ra − gwb) + evw(gp − af u) � r[(cuva − pq) − gpv(cu − q) − uf q(va − p)] . r(cuva − pq) + bwu(f q − vcg) + evw(gp − f ua) Letting p = 1, q = 2, r = 2, a = 5, b = 4, c = 3, e = 7, f = 7, g = 10, u = 3, v = 2, w = 1, the points associated with the survival of only one population, i.e. E1 = (3, 0, 0), E2 = (0, 2, 0) and E3 = (0, 0, 1), are stable, the origin E0 = (0, 0, 0) is an unstable equilibrium and the coexistence equilibrium E7 ≈ (0.1899, 0.0270, 0.2005) is a saddle point. The remaining equilibria E4 ≈ (0.6163, 0.1591, 0), E5 ≈ (0.2195, 0, 0.5317) and E6 ≈ (0, 0.1714, 0.2647) are other saddle points. The manifolds joining these saddles partition the phase space into the different basins of attraction, but intersect only at the coexistence saddle point, labeled E7 .2 In this situation we can use the detectioninterpolation routine to approximate the basins of attraction. More precisely, we choose n = 15, γ = 6, tol = 10−3 , t = 90, ε = (0.1, 0.09, 0.08), dP U = (3, 4, 4), K = (7, 8, 6). Figure 1 shows the separatrix points and the basins of attraction of E1 , E2 and E3 , (left to right, top to bottom). Finally, in Figure 2 we plot together the three basins of attraction. To test our detection-interpolation routine when bistability occurs, we consider the following model, describing a three level food web, with a top predator indicated by W , the intermediate population V and the bottom prey N that is affected by an epidemic. It is subdivided into the two subpopulations of 2 In case of bistability the manifold through the origin and a saddle point partitions the phase space into two regions. In case of a system with three equilibria instead, more saddles are involved in the dynamics. But the three separating manifolds all intersect only at one saddle with all nonnegative populations.
11
6
z
4
2
0 0
0 5
y
5
x
Figure 1: Set of points lying on the surfaces determining the domains of attraction (top left) and the reconstruction of the basin of attraction of E1 (top right), E2 and E3 (bottom, left to right). The four figures (left to right, top to bottom) show the progress of the algorithm: first it generates the points on the separatrices, then in turn each individual basin of attraction. The black and blue circles represent the unstable origin, the coexistence saddle point and the stable equilibria, respectively. Moreover the other saddles (E4 , E5 and E6 ) which, in pairs, lie on the separatrix manifolds of the attraction basins are identified by green circles.
susceptibles S and infected I, [10], dW = −mW + pV W, dt dV = −lV + eSV − hV W + qIV, dt
(9)
dI = βIS − nIV − γI − νI, dt dS = aS 1 − S + I � − cV S − βSI + γI, K dt
where m and l are the mortality rates of W and V respectively, ν is the natural plus disease-related mortality for the bottom prey, p and h are the predation rates. The disease, spreading by contact at rate β, can be overcome, so that 12
6
z
4 2 5 0 5 0 0
y
x
Figure 2: Reconstruction of the basins of attraction with parameters p = 1, q = 2, r = 2, a = 5, b = 4, c = 3, e = 7, f = 7, g = 10, u = 3, v = 2, w = 1.
infected return to class S at rate γ. Then the gain obtained by the intermediate population from hunting of susceptibles is denoted by e, which must clearly be smaller than the damage inflicted to the susceptibles c, i.e. e < c, the corresponding loss rate of infected individuals in the lowest trophic level due to capture by the intermediate population is n, while q < n denotes the return obtained by V from capturing infected prey. In this lowest trophic level, only the healthy prey reproduce at net rate a, while the prey environment carrying capacity is K. The equilibria are the origin E0 = (0, 0, 0, 0), E1 = (0, 0, 0, K), the disease-free equilibrium with all the trophic levels E2 and the steady state in which only the intermediate population and the bottom healthy prey thrive E3 : � � � � a(Ke − l) ap − cm l apKe − mecK − apl m , E3 = 0, . , , 0, K , 0, E2 = ahp p ap ecK e Then we have the point at which just the bottom prey thrives, with endemic disease, E4 and two equilibria in which the top predators disappear, E5 and E6 : � � a(Kβγ + kβν − γ 2 − 2γν − ν 2 ) γ + ν , E4 = 0, 0, , β β(aγaν + Kβν) � � β Sˆ − γ − ν l − eSˆ ˆ E5,6 = 0, , q ,S , n ˜ 2 + BS ˜ + C = 0. where Sˆ are the roots of AS With the parameters values l = 10, e = 2, q = 1, β = 1.6, n = 5, γ = 1, ν = 3, a = 8, K = 6, c = 0.5, the equilibria E3 ≈ (0, 2.6666, 0, 5) and E4 ≈ (0, 0, 1.8421, 2.5) are both stable and E5 ≈ (0, 0.7244, 0.4721, 4.7639) is the saddle point that partitions the domain in the W = 0 three-dimensional phase subspace. Thus system (9) is reduced to a system of three equations and therefore we can reconstruct the separatrix surface in such subspace with the routine described in Subsection 3.1. The separatrix points and the separatrix 13
surface, shown in Figure 3 (left) and (right) respectively, are the result of the detection-interpolation algorithm with n = 11, γ = 10, tol = 10−4 , t = 30, ε = 0.6, dP U = 4, K = 7. 10 8
S
6 4 2 0 10 5
I
0 0
5
10
V
Figure 3: Set of points lying on the surface separating the domains of attraction of E3 and E4 (left) and the reconstruction of the separatrix surface (right). The black and blue circles represent the unstable origin, the saddle point and the stable equilibria, respectively.
4.2
2D detection-interpolation tests
To give an example for a dynamical system of dimension two, we can consider the competition model analyzed in [21]. Letting P and Q denote two populations gathering in herds, we consider the following system describing the competition of two different populations within the same environment: � � √ √ Q dQ Q − q Q P, =r 1− K dτ Q (10) � � √ √ dP = m 1 − P P − p Q P , KP dτ where r and m are the growth rates of Q and P , respectively, q and p are the competition rates, KQ , and KP are the carrying capacities of the two populations. Since singularities could arise in the Jacobian when one or both populations vanish, we define the following new variables, as suggested in [21]: s r p Q(τ ) P (τ ) q K X(t) = , Y (t) = , t=τ p P, KQ KP 2 KQ (11) p p r K m K pK a = qKQ , b = p Q , c = p Q . P q KP q KP 14
Thus the adimensionalized, singularity-free system for (10) is dX = b(1 − X 2 )X − Y, dt
(12)
dY = c(1 − Y 2 )Y − aX. dt We can easily verify that the origin E0 = (0, 0), and the points associated with the survival of only one population E1 = (KQ , 0) E2 = (0, KP ) are equilibria of (10). To study the remaining equilibria we consider the adimensionalized system, in fact the coexistence equilibria are the roots of the eighth degree equation cb3 X 8 − 3cb3 X 6 + 3cb3 X 4 − cb(b2 + 1)X 2 a + cb = 0. ′
Observe that in our test we have to take into account that E1 = (1, 0) and ′ E2 = (0, 1), corresponding to E1 = (KQ , 0) and E2 = (0, KP ) of system (10), are not critical points of the system (12). With the parameters r = 0.7895, m = 0.7885, p = 0.225, q = 0.2085, Kp = 12 and Kq = 10, the points E1 = (10, 0), E2 = (0, 12) and E3 ≈ (7.0127, 8.9727) are stable equilibria of the system (10). Instead of integrating the latter we consider the model (12), whose three stable equilibria are E1∗ ≈ ′ (−1.1342, 1.1237), E2∗ ≈ (1.1342, −1.1237), E3 ≈ (0.8374, 0.8647), whereas the origin is the saddle point through which all the three curves go. Note that when three stable attractors are present there are also other saddles involved in the dynamics, namely E4 ≈ (−0.9585, −0.2692), E5 ≈ (0.9585, 0.2692) and E6 ≈ ′ (0.3055, 0.9575). Observe that, applying the transformations (11), obviously E3 corresponds to E3 , while E1∗ and E2∗ are not feasible, but roughly speaking, they represent E1 and E2 . In fact the trajectories converging to E1∗ and E2∗ , under the biological constraint X ≥ 0, Y ≥ 0, stop on the axes evolving toward ′ ′ ′ the biological equilibria E1 and E2 . Therefore we consider E1∗ , E2∗ and E3 . To apply the algorithm with initial conditions (7) we need a further consideration. Specifically, we have to translate the problem in the positive plane with the substitutions ′ ′ γ γ and Y = Y + , (13) X =X+ 2 2 where γ is the length of the square. At this point we can apply the detectioninterpolation algorithm. More precisely, we choose: n = 13, γ = 3, tol = 10−4 , t = 40, ε = (0.1, 0.06, 0.08), dP U = (4, 3, 3), K = (4, 6, 6). Figure 4 shows how the algorithm works. It generates first the points lying on the curves determining the domains of attraction (top left), then subsequently the basins of attraction ′ of E1∗ (top right), E2∗ (bottom left) and E3 (bottom right), in the original system X and Y . Finally, in Figure 5 we plot together the three basins of attraction, always in the original system. Using again the transformation (11) we obtain the curves separating the basins of attraction of E1 , E2 and E3 , shown in Figure 7 (left). To test our detection-interpolation algorithm when bistability occurs we choose the parameters as follows: r = 0.7895, m = 0.7885, p = 0.225, q =
15
1.5
1
1
0.5
0.5
0
0
y
Y
1.5
−0.5
−0.5
−1
−1
−1.5
−1
0
−1.5 −1.5
1
−1
1.5
1.5
1
1
0.5
0.5
0
0
0
0.5
1
1.5
−0.5
−0.5
−1
−1 −1.5 −1.5
−0.5
x
y
y
X
−1
−0.5
0
0.5
1
−1.5
1.5
x
−1
0
1
x
Figure 4: Set of points lying on the curves determining the domains of attraction (top left) and the reconstruction of the basin of attraction of E1 (top right), E2 and E3 (bottom, left to right). The four figures (left to right, top to bottom) show the progress of the algorithm: first it generates the points on the separatrices, then in turn each individual basin of attraction. The black and blue circles represent the origin and the stable equilibria, respectively. Moreover the other saddles (E4 , E5 and E6 ) that lie on the separatrix manifolds of the attraction basins are identified by green circles.
0.2085, Kp = 12 and Kq = 10. With this choice the equilibria E1 = (10, 0) and E2 = (0, 16.5) are stable, the origin E0 is unstable and E3 ≈ (3.8757, 3.1919) is the saddle coexistence equilibrium point partitioning the phase space domain of the system (10). The stable equilibria of (12) are E1∗ ≈ (1.3436, −1.2482), E2∗ ≈ ′ (−1.3436, 1.2482) and the coexistence saddle point is E3 ≈ (0.6717, 0.4252). In ′ view of the above considerations we can identify E1∗ and E2∗ with E1 = (1, 0) ′ and E2 = (0, 1). After translating the problem in the positive plane with the substitutions (13), we can apply the detection-interpolation routine. In this case we choose: n = 15, γ = 4, tol = 10−4 , t = 40, ε = 0.1, dP U = 3, K = 4. Figure 6 shows the separatrix points (left) and the separatrix curve (right) in the phase plane of the system (12). Using again the transformation (11) we obtain the curve separating the basins of attraction of E1 , E2 , shown in Figure 7 (right).
16
1.5 1
Y
0.5 0 −0.5 −1 −1.5 −1.5
−1
−0.5
0
0.5
1
1.5
X
2
2
1.5
1.5
1
1
0.5
0.5
Y
Y
Figure 5: Reconstruction of the basins of attraction with parameters r = 0.7895, m = 0.7885, p = 0.225, q = 0.2085, Kp = 12 and Kq = 10.
0 −0.5
0 −0.5
−1
−1
−1.5
−1.5
−2 −2
−1
0
1
−2 −2
2
X
−1
0
1
2
X
Figure 6: Set of points lying on the curve separating the domains of attraction of E1 and E2 (left) and the reconstruction of the separatrix curve (right). The black and blue circles represent the unstable origin, the coexistence saddle point and the stable equilibria, respectively.
References [1] Arrowsmith, D.K., Place, C.K.: An Introduction to Dynamical Systems. Cambridge Univ. Press, Cambridge (1990) [2] Carr, J.C., Beatson, R.K., Cherrie, J.B., Mitchell, T.J., Fright, W.R., Mccallum, B.C., Evans, T.R.: Reconstruction and representation of 3D objects with radial basis functions. Proceedings of the 28th Annual Conference on Computer Graphics and Interactive Techniques, Los Angeles, CA, USA, pp. 67–76 (2001) [3] Carr, J.C., Fright, W.R., Beatson, R.K.: Surface interpolation with radial basis functions for medical imaging. IEEE Transactions on Medical Imaging 16, 96–107 (1997)
17
12
16 10
14 12
8
Q
Q
10 6
8 6
4
4 2 0
2 0
2
4
6
8
10
0
12
P
0
5
10
15
P
Figure 7: The basin of attraction of E1 , E2 and E3 with parameters r = 0.7895, m = 0.7885, p = 0.225, q = 0.2085, Kp = 12 and Kq = 10 (left), and the curve separating the basin of attraction of E1 , E2 with parameters r = 0.8888, m = 0.602, p = 0.401, q = 0.5998, Kp = 16.5, Kq = 10.
[4] Cavoretto, R.: A numerical algorithm for multidimensional modeling of scattered data points. Comput. Appl. Math. 34, 65–80 (2015) [5] Cavoretto, R., Chaudhuri, S., De Rossi, A., Menduni, E., Moretti, F., Rodi, M., Venturino, E.: Approximation of dynamical system’s separatrix curves. In: Proceedings of the ICNAAM 2011, Simos, T.E., et al., eds., AIP Conf. Proc., vol. 1389, Melville, NY, pp. 1220–1223 (2011) [6] Cavoretto, R., De Rossi, A.: A meshless interpolation algorithm using a cell-based searching procedure. Comput. Math. Appl. 67, 1024–1038 (2014) [7] Cavoretto, R., De Rossi, A., Perracchione, E., Venturino, E.: Reliable approximation of separatrix manifolds in competition models with safety niches. Int. J. Comput. Math. 92, 1826–1837 (2015) [8] Chen, Y.L., Lai, S.H.: A partition of unity based algorithm for implicit surface reconstruction using belief propagation. In: Proceedings of the 2007 International Conference on Shape Modeling and Applications, Lyon, France, pp. 147–155 (2007) [9] Cuomo, S., Galletti, A., Giunta, G., Starace, A.: Surface reconstruction from scattered point via RBF interpolation on GPU. In: Proceedings of the 2013 Federated Conference on Computer Science and Information Systems, Ganzha, M., et al., eds., IEEE, pp. 433–440 (2013) [10] De Rossi, A., Lisa, F., Rubini, L., Zappavigna, A., Venturino, E.: A food chain ecoepidemic model: Infection at the bottom trophic level. Ecol. Complex. 21, 233–245 (2015) [11] Dellnitz, M., Junge, O., Rumpf, M., Strzodka, R.: The computation of an unstable invariant set inside a cylinder containing a knotted flow. In: B. 18
Fiedler et al. (Eds.), Proc. of Equadiff99, World Scientific, pp. 1015–1020 (2000) [12] Fasshauer, G.E.: Meshfree Approximation Methods with Matlab. World Scientific Publishers Co., Inc., River Edge, NJ (2007) [13] Giesl, P., Wendland, H.: Numerical determination of the basin of attraction for exponentially asymptotically autonomous dynamical systems. Nonlinear Anal. Theor. 74, 3191–3203 (2011) [14] Giesl, P., Wendland, H.: Numerical determination of the basin of attraction for asymptotically autonomous dynamical systems. Nonlinear Anal. Theor. 75, 2823–2840 (2012) [15] Gosso, A., La Morgia, V., Marchisio, P., Telve, O., Venturino, E.: Does a larger carrying capacity for an exotic species allow environment invasion? — Some considerations on the competition of red and grey squirrels. J. Biol. Systems 20, 221–234 (2012) [16] Hale, J.K., Kocak, H.: Dynamics and Bifurcations, Springer-Verlag, New York (1991) [17] Hoppe, H.: Surface Reconstruction from Unorganized Points. PhD thesis, University of Washington (1994) [18] Hoppe, H., Derose, T., Duchamp, T., Mcdonald, J., Stuetzle, W.: Surface reconstruction from unorganized points. In: Proceedings of 19th Annual Conference and Exhibition on Computer Graphics and Interactive Techniques, Brown, M., et al., eds., ACM SIGGRAPH Computer Graphics, vol. 26, New York, USA, pp. 71–78 (1992) [19] Iske, A.: Scattered data approximation by positive definite kernel functions. Rend. Sem. Mat. Univ. Pol. Torino 69, 217–246 (2011) [20] Johnson, T., Tucker, W.: Automated computation of robust normal forms of planar analytic vector fields. Discrete Contin. Dyn. Syst. Ser. B 12, 769–782 (2009) [21] Melchionda, D., Pastacaldi, E., Perri, C., Venturino, E.: Interacting population models with pack behavior. Submitted for publication (2014), arXiv:1403.4419v1 [22] Melenk, J.M., Babuˇska, I.: The partition of unity finite element method: Basic theory and applications. Comput. Methods. Appl. Mech. Engrg. 139, 289–314 (1996) [23] Murray, J.D.: Mathematical Biology. Springer-Verlag, Berlin (1993) [24] Turk, G., O’ Brien, J.F.: Modelling with implicit surfaces that interpolate. ACM Trans. Graph. 21, 855–873 (2002) 19
[25] Wendland, H.: Fast evaluation of radial basis functions: Methods based on partition of unity. In: Approximation Theory X: Wavelets, Splines, and Applications, Chui, C.K., Schumaker, L.L., St¨ockler, J., eds., Vanderbilt University Press, Nashville, pp. 473–483 (2002) [26] Wendland, H.: Scattered Data Approximation. Cambridge Monogr. Appl. Comput. Math., vol. 17, Cambridge Univ. Press, Cambridge (2005)
20