May 3, 1995 - were based on speech data from the Credit Card corpus (CC-. DATA). It is shown that feature enhancement provides a con- sistent level of ...
169
IEEE TRANSACTIONS ON SPEECH AND AUDIO PROCESSING. VOL. 3. NO. 3, MAY 1995
Robust Feature-Estimation and Objective Quality Assessment for Noisy Speech Recognition Using the Credit Card Corpus John H. L. Hansen, Senior Member, IEEE, and Levent M. Arslan, Student Member, IEEE
Abstract-It is well known that the introduction of acoustic background distortion into speech causes recognition algorithms to fail. In order to improve the environmental robustness of speech recognition in adverse conditions, a novel constrainediterative feature-estimation algorithm, which was previously formulated for speech enhancement, is considered and shown to produce improved feature characterization in a variety of actual noise conditions such as computer fan, large crowd, and voice communicationschannel noise. In addition, an objective measure based MAP estimator is formulated as a means of predicting changes in robust recognition performance at the speech feature extraction stage. The four measures considered include i) NIST SNR ii) Itakura4aito log-likelihood iii) log-area-ratio iv) the weighted-spectral slope measure. A continuous distribution, monophone based, hidden Markov model recognition algorithm is used for objective measure based MAP estimator analysis and recognition evaluation. Evaluations were based on speech data from the Credit Card corpus (CCDATA). It is shown that feature enhancement provides a consistent level of recognition improvement for broadband, and low-frequency colored noise sources. Average improvement across nine noise sources and three noise levels was +9.22%, with a corresponding decrease in recognition rate variability as represented by standard deviation in recognition from 12.4 to 6.5. As the ~ t a t i o ~ r i assumption ty for a given noise source breaks down, the ability of feature enhancement to improve recognition performance decreases. Finally. the log-likelihood based MAP estimator was found to be the best predictor of recognition performance, while the NIST SNR based MAP estimator was found to be poorest recognition predictor across the 27 noise conditions considered. I. INTRODUCTION
robust speech recognition, we consider the potential sources of distortion that are introduced into a speech signal under adverse conditions. In Fig. 1, a general speech recognition scenario is presented which includes a variety of speech signal distortions Clearly, the distortions illustrated may not be present in unison. For this scenario, we assume that a speaker is exposed to some adverse environment, where ambient noise is present and a usel task is required. Such scenarios include a noisy automobile environment where cellular communications is used, noisy helicopter or aircraft cockpits, noisy factory environments, and others. Since the user task could be demanding, the speaker is required to divert a measured level of cognitive processing. leaving formulation of speech for recognition as a secondary task. Workload task stress has been shown to signific,mtly impact recognition performance [51], [9]. [28]-[30], [32], [53]. Since background noise is present, the speaker will experience the Lombard effect [48]: a condition where speech production is altered in an effort to communicate more effectively across a noisy environment. The level of Lombard effect will depend on the type and level of ambient noise d l ( n ) . In addition, a speaker may also experience situational stress (i.e., anger, fear, other emotional effects), which will alter the manner in which speech is produced. If we assume s(r!) to represent a neutral, noise-free speech signal, then the acoustic signal at the microphone is written as
{I
U’ORKLOAD TASK
S(n) STRESS LOMBARD EFFECT(d1)
1
+&(n).
(1)
In general, the acoustic background noise d l ( n ) will also degrade the speech signal. Next, if the speech recognition system is trained with one microphone and another is used The issue of robustness in speech recognition can take on a for testing, then microphone mismatch will cause a distorbroad range of problems. A speech recognizer may be robust tion. This can be modeled as a frequency mapping with the in one environment and inappropriate for another. The main impulse response I L M I K E ( ~ )If. the speech signal is to be reason for this is that performance of existing recognition transmitted over a telephone line or cellular phone channel, systems which assume a noise-free tranquil environment, another level of distortion is introduced (modeled as either degrade rapidly in the presence of noise, distortion, and stress. additive noise & ( n ) , or a frequency distortion with impulse In order to discuss the signal processing needed to achieve response ~ C ~ H A K K . (n)). E L Further noise could also be present (or modeled) at the receiver &(n). Therefore the neutral noiseManuscript received February 2, 1994; revised December 1, 1994. The associate editor coordinating the review of this paper and approving it for free distortionless speech signal s(n), having been produced publication was Prof. Richard J. Mammone. and transmitted under adverse conditions, is transformed into The authors are with Robust Speech Processing Laboratory, Department of the degraded signal y(n), as shown in (2), at the bottom of Electrical Engineering, Duke University, Durham, NC 27708-0291 USA. IEEE Log Number 9410212. the next page.
A. An Overview to Robust Speech Recognition
1063-6676/95$04.00 0 1995 IEEE
lEEE TRANSACTIONS ON SPEECH AND AUDIO PROCESSING, VOL. 3, NO. 3. MAY 1995
170
LOMBARD EFFECT
Fig. 1.
General framework for the types of distortion which may b e addressed for robust speech recognition.
Approaches for robust recognition can be summarized under the following three research areas i) better training methods ii) improved front-end processing iii) improved back-end processing or robust recognition measures. These recognition approaches have in tum been used to address improved recoedtion of speech in a) noisy environments b) Lombard effect c) workload task stress or speaker stress d) microphone or channel mismatch. To formulate automatic speech recognition algorithms which are more effective in changing environmental conditions, it is important to understand the effects of noise on the acoustic speech waveform, the acoustic-phonetic differences between normal speech and speech produced in noise, and the acoustic-phonetic differences between normal speech and speech produced under stressed conditions. Several studies have shown distinctive differences in phonetic features between normal and Lombard speech [4], [43], [25], [281, [23], [54], [56], and speech spoken in noise [19]. Other studies have focused on variation in speech production brought on by task stress or emotion [25], [28], [29], [35], [5]. The primary purpose of these studies has been to improve the performance of recognition algorithms in noise [42], Lombard effect 1431, (371, [55], stressed speaking styles [46], [51], [91, noisy Lombard effect [28], [31], [33], [341, [7], and noisy stressful speaking conditions [53], [28], [30], [34], [35]. Approaches based c m improved training methods include multi-style stress training [46], [51], simulated stress token generation [5], training and testing in noise [14], and others [42]. Improved training methods have increased recognition performance, however as suggested by Juang, recognition performance degrades as testing conditions drift from the original training data. A solution which has been suggested is fast update methods for recognition models under varying noise environments. Another area which has received much attention is front-end processinghpeech feature-estimation for robust recognition.
Here, many studies have attempted to uncover that speech representation which is less sensitive to various levels and types of additive, linear filtering, or convolutional distortion. For example, some studies focus on identifying better speech features [391, [37], or estimation of speech features in noise [27], or processing to obtain better speech representations [38]. If the primary distortion is additive noise, then a number of speech enhancement algorithms can be used such as i) short-time spectral amplitude estimation (spectral subtraction) [3] ii) model based optimal filtering (Wiener filtering) [45], U71, 1181, [261, [27l iii) adaptive noise canceling [60]. Other front-end processing incorporates feature processing for noise reduction and stress equalization [35], [7], [33], additive and convolutional noise [38]. The last approach for robust recognition is in improved back-end processing or robust recognition measures. Such processing methods refer to changes in the recognizer formulation such ils the hidden Markov model (HMM) structure, or developing better models of noise within the recognizer [59]. Robust recognition measures are included here because they seek to project either the test data space closer to the trained recognition space, or trained space toward test space [36], [49], [8]. Studies related to robust metria include those processing for linear filtering or microphone mlsmatch distortion [47].
B. Outline of Paper: Robust Recognition Under Additive Noise In this study, we focus on the area of robust features with respect to additive background noise. The method under consideration is a previously formulated scheme based on sequential maximum a posteriori (MAP) estimation of the speech waveform and speech modeling parameters followed by the application of inter and/or intra-frame spectral constraints between iterations [24], [27]. The paper is organized as follows. In Section 11, three objective speech quality measures are discussed in the context of quality assessment for automatic recognition in noise. In Section 111, a simple objective measure based MAP estimation approach for recognition performance is presented, followed by a discussion of constrained-iterative
WORKLOAD TASK LOMBARD
EFFECT{^^}
*
MIKE:(^)
+ dz(n)
HANSEN AND ARSLAN: NOISY SPEECH RECOGNITION USING THE CREDIT CARD CORPUS
171
TABLE I AVERAGECORRELATION COEFFICIENT 1 1 1BETWEENOBlECTlVE AND SUBIECTIVE SPEECH QUALITY AS MEASURED B Y COMF'OSITE ACCEPTABILITY OF DAM [ 5 2 ] . CORRELATION COEFFICIENTS ARE FOR OVERALL DISTORTION ALL: 322 TYPES OF DISTORTION, AND SPECIFIC DISTORTION CLASSES: W K D : 66 WAVEFORM CODER DISTORTIONS. WBD.' 126 WIDEBAND DISTORTIONS FROM WAVEFORM CODERS AND CONTROLLED DISTORTIONS, NBD: 36 NARROWBAND FREQUENCY DISTORTIONS, FDD: 36 DIFFERENT COLORED FREQUENCY DEPENDENT DISTOFXIONS
COMPARISON OF THE
0B.JECTIVE SPEECH Q U A L I T Y MEASURE SNR Segmental S N R LPC Baned Measures Linear Predictor Coefficient Log Predictor Coefficient Linear Reflection Coefficient Log Reflection Coefficient Log Area Ratio (LAFt) Log Likelihood Ratio (IS: Itakura-Saito) Weighted Spectral Slope (WSSMKlatt) ~
D A.M. CORRELATION
IPIWFCD 1
3
= 0.24
1 = 0.77 ~ ~
~
131~1,~ = 0.06 131~1,~ = 0.11 [$[ALL= 0.46
PIALL= 0.11 l p l =~0.62 ~ = 0.59 j l 3 u l = 0.74
1 3 1 =~0.65~ ~~ P ~ M D= 0.91 1 3 1 =~0.6~1 ~1 3 j j = 0.80 1 8 1 = ~0.61~ ~1 3 1 =~0.9~0 ~
others for comparison. Here, i l j 1 . 4 ~ ~refers to correlation with composite acceptability of the DAM across all 322 tested distclrtions and therefore reflects the objectives measures overall performance. Some of these distortions included i) coding (e.g.. ADM, ADPCM. LPC, MPLPC, etc.) ii) controlled distortion (e.g., additive noise, clipping, echo, lowpass filtering, etc.) iii) frequency variant (e.g., narrowband noise, pole distortion;, etc.). Other correlation values reflect more specific distortion classes 11. NOISEAND OBJECTIVE SPEECH QUALITY such as When noise is introduced into a speech utterance, its impact i) WBD: wideband distortion on speech quality is nonuniform. As a result, the impact ii) NBD: narrowband distortion of additive background noise on speech recognition perforiii) WFCD: waveform coder distortion mance will depend on how each phoneme for an input text iv) FDD: frequency dependent distortion. sequence is effected. In this section, three objective speech From this !tudy, the log-likelihood ratio (IS) resulted in one quality measures are considered as a means of representing the of the higier LPC based quality measures, and of those impact of various additive noise sources on speech quality for measures employing an aural model, the weighted spectralrecognition. A fourth measure based on SNR is also discussed. slope meas Ire Watt) possessed the highest correlation coefFor this study, the focus is on distortion which primarily ficient with subjective quality. This table shows that the three introduces an additive spectral mismatch into the frequency selected me a w e s possess good degrees of correlation across response of the speech signal across time. This, of course, overall distortion types; and higher degrees of correlation for only reflects a small portion of the potential types of distortion narrowband and frequency dependent distortion classes. which may be introduced for voice recognition applications. It The method in which each measure is estimated will now 1s suggested that the change in quality could be used to predict be considered. The measures have the property that if the the robustness of feature enhancemenuestimation front-ends degradeafeature-enhanced and original speech spectra are for automatic speech iecognition in noise. identical, th:. resulting measure is zero. Each distance measure The choice of an objective measure rests on its ability to represents a measure of distortion between a frame of original predict quality for a particular distortion. Research has been and degradedprocessed speech. Global quality measures are performed in the formulation of objective quality measures for obtained by averaging individual frame distances d, over a coding [52], [l I], [SSI, and the application of these measures to sentence or database. speech enhancement [24] and recognition [ 131, [20]-[22], [36], One of tke more successful quality measures based on the [40]. In one study of over 2000 different objective measures magnitude spectrum is the log likelihood ratio [40], [20], [lo]. using the multidimensional diagnostic acceptability measure This measure is based on the dissimilarity between all-pole (DAM) [57], several measures were identified which have a models of the reference .T and processed speech 9 as follows: noticeable degree of correlation to subjective quality for a broad range of distortions [52]. The following three objective measures are considered in this study, log-likelihood ratio (Itakura-Saito) d ~ s ( ~log-area), ratio dLAR(I), and the weighted-spectralslope measure (Klatt) where Z~9; a'< are the all-pole model coefficients from the ith ~ w s ~ Table ~ ( ~I )summarizes . correlation results from [52] frame of the original and feature-enhanced signals respecfor the objective measures considered, along with several tively, and R.4 is the corresponding autocorrelation matrix robust feature-estimation using the (Auto:I,LSP:T) algorithm in Section IV. This procedure is evaluated using CCDATA and TIMIT data for a number of noise conditions. The transformed (Auto:I,LSP:T) estimated features are then employed within a monophone model based speech recognition algorithm across actual noise conditions in Section VI. Finally, the MAP recognition rate estimator is evaluated in Section VII, and conclusions drawn in Section VIII.
IEEE TRANSAITIONS ON SPEECH AND AUDIO PROCESSING. VOL. 3, NO. 3. MAY 1995
172
TABLE I1 SUMMARY OF CRITICAL BANDFREQUENCY bCATIONS AND BANDWIDTHS FOR
CALCULAT~ON OF THE WEIGHTED SPECTRAL SLOPEMEASURE
I
of the feature-enhanced signal. The measure has been shown to assign a high weight when an error due to mismatch in formant location occurs, and a lower weight for error in spectral valleys. This is desirable, since the auditory system i h more sensitive to errors in formant location, then to the spectral bandwidths or valleys between peaks. Other objective measures can be formed based on linear prediction coefficients (LPC). A variety of coefficients can be used to represent the LPC model, though it has been shown [52] that of all LPC based measures, the log-area-ratio measure has the highest correlation with subjective quality. The log-area-ratio parameters are obtained from the reflection coefficients T , as
I:$[
LAR, = log
I
Cnlical Bond Center Freauencu Locations and Bandwidihs /Hz)
= log
[E]
15 i
5 P (4)
where P represents the order of the LPC analysis. The objective quality measure is formed as follows:
where LARsXis the set of log-area-ratios from the original speech (ith frame), LA Rg, the log-area-ratios for the featureenhanced frame, and .M the number of parameters for each frame. Since spectral distance measures have perhaps been the most widely investigated quality measure, many variations exist [6], [lo], [20], [311, [521. The third measure, entitled weighted spectral-slope measure (WSSM) by Klatt [44], is based on an auditory model in which overlapping filters of progressively larger bandwidth are used to estimate the smoothed short-time speech spectrum. The filter bank bandwidths are chosen to be proportional to the ear's critical bands so as to give equal perceptual weight to each band. Once the filter bank is formed (see Table 11), the measure tinds a weighted difference between the spectral slopes in each band. The magnitude of each weight reflects whether the band is near a spectral peak or valley, and whether the peak is the largest in the spectrum. Klatt computes the weight for each spectrum then averages the two sets Of weights to obtain w,( k ) . Next, a per-frame spectral distance measure in
decibels is found using dWSSh?(%)== KspliK -
a+
25
U ' a ( k ) { S ( k )- S(W2 ( 6 ) k=l
where K , are related to overall sound pressure level of the reference and processed signals. Kspl is a parameter which can be varied to increase overall performance. The resulting measure is therefore sensitive to differences in formant location, yet less sensitive to differences in the height of those peaks or differences in spectral valleys. Next, we consider the various sources of distortion in this study for robust speech recognition, and present the final measure of recognition performance estimation. The last nieasure is based on the Uell-known signal-to-noise ratio (SNR) Two definitions of SNK are employed. The first will be referred to as SNR or SNRGI~OBAL, and is represented as
where the siimmation is over the entire utterance. The second SNR definition will always be referred to as NIST SNR, and is determined as, Peak Signal Power Mean Noise Power '
SNRNIST= 10 log -
(8)
where power refers to the signal variance computed over 20-ms windows.' The basic framework for introducing distortion into the CCDATA speech corpus will now be considered. CCDATA consists of 1737 files from two-way spontaneous telephone conversations concerning credit cards. A subset of CCDATA was selected and degraded with preselected levels of degrading background noise as :dn) = 4 n )+ 9 . 4 n )
(9)
where g is adjusted to achieve an average SNR level of 5, 10, or 15 dl3 as in (7). The nine noise sources summarized in 'Formulation of the NIST SNR measure is discussed in further detail in documentation provided by National Institufe of Standards and Technology -. (NIST) with speech corpus data base (i.e.. stnr.doc); also see [12].
I73
HANSEN ANI) ARSLAN: hOlSY SPEECH RECOGNITION USING THE CREDIT CARD CORPUS
Noise WGN
Stationarity 1 1
FLN SUN PS2 EEL
3
LCT
3
LCR
5 5
9
Description computer generated white Gaussian n o h noise from a flat communications channel
noise recorded from a helicopter fly-by noise recorded from a large citv noim recorded from a large crowd noise recorded inside an automobile traveling noise recorded under multiple speaker babble
20
18
16
J I4
c
9 12 IO
E O 0
(a)
(h)
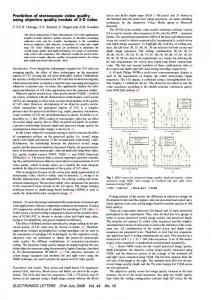
Fig. 2. Time versus power spectral response for two background noise distortions: (a) Flat noise; (h) highway noise
Table I11 were considered in this study. Each noise source was sampled at 8 kHz. A brief first and second moment analysis across 4 seconds of noise data was also conducted to determine the degree of stationanty for each source. A subjective score of stationarity (i.e., 1: for wide sense stationary, to 10: nonstationary) was assigned to each noise source based on this analysis. Sample time versus power spectral estimates are shown for two of the background noise sources in Fig. 2. Noise sources are grouped as broadband (WGN, E N ) , low frequency band (SUN, PS2, HEL, HWY), time varying colored (LCI, LCR, BAB).
iii) that the noise source possesses a known level of stationauity. Further assume, that a predetermined speech corpus exists which is representative of the required recognition task. Let the random variable .r represent the resulting objective measures from a degraded or feature-enhanced speech corpus. Also, let the random variable y represent the resulting recognition rate for a finite test set of utterances from that corpus. We assume that in the region of interest, both random variables are Gaussian distributed.’ With this, the joint probability density function (ptlf) for objective measure n: and recognition rate y is
MEASUREBASED 111. OBJECTWE MAP RECOGNITION ESTIMATION In this section, we formulate a simple estimation procedure of output recognition rate based on observed objective speech measures. The motivation for such an estimator is clear; since it provides a basis for obtaining a quantitative measure of recognition performance for a selected speech feature, given a noise source and SNR band, without the need of additional recognition simulation. Such an estimator would also indicate the impact level of a noise source for a given speech feature based recognizer, or the level of robustness for a speech feature under consideration for that adverse environment. Assume that the following is known for a speech recognition application in a given adverse environment: i) an example noise sequence is available ii) an operating SNR range is specified
The following conditional pdf can then be written
where pry. cy,my, and m, are estimated from our previous simulations. The resulting maximum a posteriori (MAP) ’The joint Gaussian awmption IS reasonable if the performance of recognition algonthm doe\ not vary too wildly for the given noise source and SNR band
IEEE TRANSACTIONS O N SPEECH A N D AUDIO PROCESSING, VOL. 3, NO. 3, MAY 1995
174
INTER-FRAME CONSTRANTS Step 1. Convert LPC predictor coefficients ti,,, (frame n. iteration i ) to LSP position P;,, and difference parameters.
d,,
Step 2. (i) Perform voiced or unvoiced/silence speech frame classification (based on frame energy E., and energy threshold E v p v ) (ii) Maintain count L, of consecutive frames below E v p . (iii) I f L, reaches L M A X , classify a l l subsequent frames below EvlUvas silence/noise. (iv) If a single frame rises above E v l v v , reset frame energy count L, t o zeio and continue. Step 3. LSP Position Smoothing Constmints: In general, LSP position parameters P;,, more closely related t o formant location. e Apply a speech adaptive smoothing constraint across a triangular base of support which is position (i.e., frequency) dependent as follows
Here, H ( E , , p , ) represents smoothing window height, WI:E,,p , ) the weighted window base width. (In general, both dependent on frequency and frame energy.)
Step 4. Update even LSPs using constrained position parameters as:
LSP,,,(Zj
+ 1) = h ( j ) .
Step 5. LSP Diflerence Constmintj: LSP difference parameters d , more closely related to formani bandwidth. e If I d , / < d,,,, then LPC analysis has underestimating a Ipole bandwidth Therefore, set
LSP,,,(Zj) = p..,(j) e If
+ d, = p;,,(j) + SIGN(d,)d,.,
Jd,l > d,.,,
then model pole corresponds to overall vocal tract shaping. Allow bandwidth to varying naturally. Set LSP differerice parameter as,
LSP,,,(Zj) = & ( j )
+ d , = P,,,,(J) + SIGN(d,)-
If d,,,,, 5 ld,l 5 d,.,, then model pole corresponds to a formant. Apply smoothing constraint only t o corresponding position coefficient p , , , , ( j )
Step 6. Form new set of constrained model parameters &,, from constrained .L?fP,,,,(j)parameters
Fig. 3. Procedure for application of inter-frame spectral constraints.
estimator for recognition rate given an objective measure is found as
$MAP(~C:~
= argmaxfYl,(yo I zo).
(12)
Y
Since we assume that the recognition rate and objective measure are both Gaussian distributed, this resulting MAP estimator i j ~ ~ p ( is z )equivalent to the mean square error estimator ijrnse(z)= J'yfyl,(yo I z,)dy. The resulting MAP estimation equation which maximizes the conditional pdf in I 11) for recognition rate is
parameters a' and gain g. A sequential maximup-a-posteriori (MAP) estimation of the cleaq speech vector So is obtained given the noisy input speech Yo, followed by MAP estimation of the model parameters a' given 2,3, where is the result of the first MAP estimation. The process iterates between the following two MAP estimation steps:
so
i) MAXp(2,
which gives &
ii)
which gives $ Q , ~
I go,,,Fo: g , $1) M.$Xp(,!?o , I &, Po;g, 2,)
until a convergence threshold is reached. This general sequential MAP estimation approach was first considered for white Gaussian noise conditions by Lim and Oppenheim [45].In the current feature enhancement approach, constraints are applied where [.la and [.I, ice used for notation purposes. This to & to ensure the following: estimator will be evaluated in Section VII. i) The all-pole speech model is stable; ii) It possesses speech-like characteristics (e.g., poles are IV. (AuTo:I,LSP:T) CONSTRAINED FEATURE-ESTIMATION in reasonable places with respect to each other and the unit circle); In this section, we consider the feature enhancement based iii) The vocal tract characteristics do not vary by more than recognition system. It should be noted that this algorithm a prescribed amount from frame to frame when speech was previously formulated as one of a number of constrained is present. iterative methods for speech enhancement [27]. Consider a noise corrupted speech vector &, . It is assumed that the input Fig. 4 illustrates a flow diagram of the sequential MAP estispeech signal can be modeled by a set of all-pole model mation procedure.
175
HANSEN AND ARSLAN: NOISY SPEECH RECOGNITION USING THE CREDIT CARD CORPUS
1
I
APP;
7
CONSTRAINTS:
lrame
' I
I ' CONSlRUCT NONCAUSALWIENER FILTER:
HMM RECOGNmON CONTINUOUS DISTRIBUTION
FILTER:
MONOPHONE BASED
TO FORM:
DIAGONAL COVARIANCE
HMM yk
Fig. 4. Framework for the (Auto:I,LSP:T) feature-enhanced recognition algorithm.
Inter--ume spectral constraints are applied to line-spectralpair parameters across time on a fixed-frame basis. These constraints are applied to ensure that vocal tract characteristics do not vary wildly from frame to frame when speech is present. This method allows constraints to be efficiently applied to speech model pole movements across time so that formants lay along smooth tracks. In order to increase numerical accuracy, reduce computational requirements, and eliminate inconsistencies in pole ordering across frames, the line spectral pair (LSP) transformation [40]is used to implement inter-frame constraint requirements across time. The procedure for application of LSP inter-frame constraints are outlined in Fig. 3. Znfraframe spectral constraints are applied to autocomelation parameters across iterations on a single-frame basis. Application of the intra-frame constraints is achieved by weighting the present set of autocorrelation parameters at time frame n with the samc frame from previous iterations as
m =O
xEz0
with the condition that t/q =1 (here, m represents autocorrelation terms from previous iterations). Given the present autocorrelation estimate, this weighting process re-introduces a controlled level of distortion from previous iterations which
slows the rate of improved estimation for phoneme sections less sensitive to additive noise. \'. FEATURE-ENHANCEMENT
EVALUATION
In this scction, performance of (Auto:I,LSP:T) feature enhancement is presented. First, evaluations are presented where the algorithm is adjusted to achieve improved subjective performance for a particular noise source. In the second section, the algorithm features are fixed and applied to the nine noise sources for robust feature enhancementhecognition evaluation. These results therefore, represent the default level of improvement for a general recognition algorithm.
A. TIMIT Sentence Evaluation The general feature estimator possesses several algorithm values which may be adjusted for improved estimation in the presence of different noise sources. For example, the power exponent in the filter and weighting terms in the intra-frame spectral constraints work together to effect the choice for the best terminating iteration for enhanced features. In general, as the value of @ is decreased (i.e., in the range /3 E [0.1, OS]), the optimal terminating iteration increases. The best improvement in objective speech quality for each of the nine noise sources for a single sentence is shown in Fig. 5 . Informal listening
~
IEEE TRANSACTIONS ON SPEECH AND AUDIO PROCESSING, VOL. 3, NO. 3, MAY 1995
176
TABLE IV SUMMARY OF ITAKL-RA-SAITO (IS) QUALITY MEASURESACROSSPHONEMES FOR 100 TIMIT SPEECH SENTENCES. WITH WGN (lODB SNR), FE.: FEATURE-ENHANCED (AUTO:I,LSPT), Cnt.: FRAMECOUNT DE.: DEGRADED Phoneme
DE.
FE.
Cnt.
/ml
me
1.1
no
/ngl
siy maw problem subtract= greaalng
/U/
/em/ /en/ /eng/
6.563 8.225
7.990 5.625 5.575 9.224 3.423
1.483 1.323 1.820
683 1153 159
0.506
77
1.324 1.925
33 135
0.908
18
CONSONANT,$ - unvoiced frrcatiues /a/
/th/
If/ /Eh/
zip &ing lan show
0.664 1.009 0.881
1.126 0.836 1.108
1433 203 796
0.905
0.964
673
C O N S O G N T , ? - voiced fricatives /a/
/ah/ /dh/
1.1
-
4P garaQe &at
CONSONANTS
~
0.880
1.435
0.924 3.338 3.574
1.232 1.038 1.163
1054 66 270 273
afftcates
/jh/
pke
1.041
1.398
263
/.a/
C~OP
1.276
1.506
336
DE.
FE.
Cnt.
~
h>d 1.478 0.426 had 1.745 0.375 /=/ had 1.275 0.222 /ux/ t g buy 1.975 0.584 VOWELS inzd /a./ odd 2.748 0.615 /er/ 6.244 1.319 /ah/ 3 2.088 0.480 /a./ all 4.528 1.291 VOWELS - back /uw/ boot 3.622 1.250 /uh/ foot 2.164 0.534 VOWELS - front schwa hgd 2.785 0.646 /ix/ VOWELS - back schwa /ax/ aton 3.418 1.014 VOWEL; - retroflexed schwa /axr/ after 8.519 2.141 VOWELS - voiceless schwa /ax-h/ svbtraction 2.951 1.634
/PI It/
/k/
pan lan lay
2.228 1.233 2.118
CONSONANT:: /b/
6e
/d/ /g/
dawn give
-
-
it pays
podets tohy sandwich ipanas accomplish
508 542 559
voiced slops 2.206 1.164 2.217
CONSOTVANT:; /tcl/ /kcl/ /bcl/ /dcl/ /gcl/ /pcl/
0.890 0.701 0.982 0.698 0.817 0.782
135 186 142
closure stops 1.869 2.013 3.857
1.395 1.221 1.432
999 655 399
3.424 3.055 1.553
1.443 1.327 0.935
636 241 779
CONS ON AN^?; - glottal stop, Pap /q/ /dx/
_allow put-in
3.998 4.299
1.481 0.721
661 142
C O N S O N A N T S - unvoiced whisper /hh/ bad 3.532 1.054 CONSONANT:; - voiced whisper
143
/hv/
0.832
103
0.300 0.654 0.331 0.649 0.325
0.887
1033 171 725 660 288 1220
1.875 1.672 2.480
747 1079 356
y o u h ~ ~ e 6.235
DIPHTXONGA-
VOWELS front jihl /eh/
Phoneme
C O N S O N A N T S - unvoiced stops
C O N S O N A N T S - nasals
947 856 977 636
~
1339 562 625
750 197 116 1043
/ay/ /oy/ ley/ /OW/
/awl /iy/
SEMIVOWELS /r/ /1/ /el/
/Y/ Sdence
/pau/ /epi/
1.509 3.519 1.043 2.193 1.727 1.581 -
laqurds 8.137 3.783 4.667
I;m
!awn chemic&
SEMIVOWEL: /w/
/# / 628
We co2n p.en code PoVt new
~
glides
E t you
5.545 1.743
1.853 1.142
289 318
extended pause epenthetic
1.700 2.552 4.358
0.947 1.284 2.930
5087 175 98
594
Overall 35
tests and objective measure results show that quality improvement occurs for the following noise conditions: WGN, HEL, HWY, PS2, and SUN computer cooling fans, and (FLN) flat communications channel noise. Little improvement or change was noted for LCI, and LCR. Finally, the feature-estimation procedure introduced further distortion for BAB noise. This i\ to be expected, since the assumption of a stationary noise source has been violated for the single channel method. Next, a detailed evaluation was considered across individual phonemes. Since phonetic label data is not available for the CCDATA corpus, TIMIT [l] sentence data was used for analysis. For this evaluation, 100 sentences were selected from a representative sampling of dialect across TIMIT. Each sentence was down-sampled to 8 kHz, and degraded with white Gaussian noise (WGN) at an SNR of 10 dB. Next, feature enhancement was applied to each degraded utterance. Using phonetic label data provided by NIST, individual frames were grouped into NIST labeled phonemes. The IS objective quality measure was obtained for each degraded and
enhanced phoneme class (see Table IV). After application of (Auto:I,LSP:T) feature-enhancement, improvement in objective quality is obtained for 55 of the 61 NIST phonemes, with significant improvement for nasals, vowels, diphthongs, glides, and liquids. Fricatives and affricates comprised the six phonemes which did not see signiticant improvement. This however, does not adversely effect c'verall performance, since these phonemes were not originally effected by this noise source to the same extent as other:, (i.e., compare degraded fricatives which did not show improvement with overall test average). These results show that (Auto:I,LSP:T) is able to adapt its feature enhancement across changing vocal tract phoneme structure. It is thus suggested. that such improvement could contribute to improved recognition performance. B. CCDATA Feature Enhancement Evaluation Next, we consider the performance of the featureenhancement algorithm for degraded CCDATA corpus. Results for several objective quality measures are reported to i)
HANSEN AND ARSLAN: NOISY SPEECH RECOGNITION USING THE CREDIT CARD CORPUS
SPEECH QUALITY vs. NOISE SOURCE 3.0
CCDATA
2.7
2.4
)?
2.1
3
1.1
8
with Auto-LSP F d u n Enhancement
1.6 1.2
0.0
0.6 0.9 0
Fig. 5. Enhancement using the (Auto:I,LSP:T) enhancement algorithm for nine noise sources at 10 dB SNR. Improvement is shown with respect to IS distance measures.
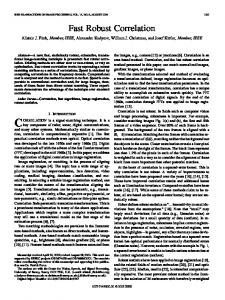
illustrate the improvement in feature representation in varying levels and types of additive background noise, and ii) to provide the necessary a priori information to formulate a MAP estimator for output recognition performance. Though results have shown that adapting (Auto:I,LSP:T) processing characteristics such as terminating iteration, inter- and intraframe constraint setlings, and power exponent effect the resulting quality of the optimal features, an average algorithm configuration was used across all noise types and levels. Therefore, further improvement in the estimated features employing further knowledge of the noise source should improve the actual recognition rates. This has already been demonstrated using it phoneme class directed constrained iterative enhancement technique [2]. The results obtained by fixing the feature enhancement algorithm therefore represents the level of recognition performance improvement which should be expected from an unknown input noise source (i.e., no a priori noise training data). Time Waveform Analysis: As discussed previously, noise influences speech quality and recognition feature parameters differently across time. To illustrate this, see the first IS objective measure plot of in Fig. 6 for a female CCDATA sentence degraded with WGN. Since WGN has a uniform frequency response, its' impact on speech quality and recognition feature representation will be approximately uniform. However, noise sources such as SUK, PS3, HEL, and HWY effect some phonemes more than others. This results in a nonuniform level of speech quality and !>peechfeature representation for recognition. However, after application of the feature-enhancement algorithm, output speech quality is shown to be more uniform (see Fig. 6). Here the average IS measure is reduced from 2.80 to 0.87, with a significant reduction in IS variance. This result suggests that feature enhancement will increase the quality of extracted speech features for robust speech recognition. Next, we illustrate the effect of additive noise and feature enhancement with objective quality measures. NISTSNRAnalysis: Next, we consider the effect of noise and feature-enhancement on NIST SNR, since improvement in NIST SNR may be a more meaningful numerical mea-
177
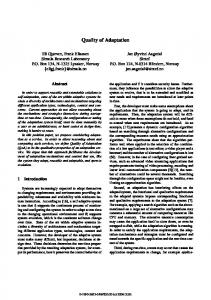
sure of improvement for some researchers in robust speech recognition. For this evaluation, 60 CCDATA sentences were degraded at SNRCLOBALof 5, 10, and 15 dB, and processed with the feature-enhancement algorithm. Fig. 7 summarizes NIST SNR3 improvement for nine noise conditions and 5-15 dB SNR range (i.e., each scatter plot entry represents a NIST SNR measure for a single degraded input and featureenhanced ,mtput sentence). NIST SNR improvement however, is only meaningful if the background resting noise level is at least staticnary with respect to frame-to-frame signal strength. Therefore, for short-time stationary noise sources such as flat communications channel, computer cooling fan, or highway, improvement in NIST SNR is meaningful. However, for such noise sauces as large crowd noise (LCR) and background babble (B4B), NIST SNR measurements may be prone to error. This occurs since the non stationarity of the background noise will ?ush individual signal frames into the speech region of the franie density function. Scatter plots between input and feature-enhanced NIST SNR are also shown for WGN, FLN, HWY, and HEL noise. Since an increase in the output featureenhanced NIST SNR signifies improvement, all entries above the equal iiiput-output line represent improvement. The results show that when additive noise is introduced at 5, 10, and 15 dB SNR values, NIST SNR is concentrated at 12.3, 16.9, and 21.6 dB. After employing (Auto:I,LSP:T) feature enhancement. average N[ST SNR increased to 27.0, 31.0, and 35.8 dB. This repre!.ents an improvement of' 14.1 to 14.7 dB in NIST SNR for the non speech-like noise distortions (i.e., excludes LCR and €{AB). More importantly, some noise sources such as WGN, E N , HEL, SUN, LCI. resulted in concentrated regions of output NIST SNR, while others (HWY, LCR, BAB) showed a wider range of output NIST SNR. This notion is clearly illustrated if NIST SNR scatter plots are compared for FLN and H W Y noise sources in Fig. 7. The concentration for each of thc 60 CClDATA sentences at each input SNR for WGN, FLPJ, and HEL suggest a high degree of confidence in (Auto:I,LSP:T) performance. Though the level of feature enhancement was not as consistent for HWY noise, this may be expected, since the impact of highway noise on speech quality varies more across individual phoneme classes than for FLN or WGN. The table of N E T SNR measures in Fig. 7 for the seven non speech-like noise sources show improvement at each input SNR level. Objective Quality Analysis: It has been shown that feature enhancement improves resulting objective quality across non speech-like noise sources. The three objective quality measures (IS, LAR, WSSM) were obtained for the 60 CCDATA sentences used in the previous evaluation for both degraded and feature- enhanced conditions. These results will be used to obtain the necessary a priori information for the objective quality based MAP recognition rate estimator. In this section, we briefly discuss the three objective measure results. Fig. 8 presents a partial summary of IS objective quality measures fc+ four of the nine noise sources. Scatter plots show input degraded IS measures versus feature enhanced 'The signal-.o-noise ratto as presented by National Institute of Standards and Technology (NIST) used here is based on their 'Second Method' which uses a 97% spread threshold in the energy histogram.
IEEE TRANSACTIONS ON SPEECH AND AUDIO PROCESSING, VOL. 3, NO. 3. MAY 1995
178
Noisefree speech
5000
5000
10000
150CO
20000
15000
20000
Sample Value (a) Noisy Speech
20000 -
I
10000
5000
Sample Value
(b) Distortion measure between the processed and original speech files I
”
‘
Sample Number (N=240,75%ovfrlap)
Enhanced Speech
,
1 , 1 .
5000
15000
10000
20000
Sample Value (d) Distortion measure between the processed and original speech files I
, . ,
“Yea, I’ll probably hatie o m of every credit card there is. ” (e)
Fig. 6. Time waveforms of (a) an original CCDATA female speech sentence, (b) degraded with additive white Gaussian noise, and (d) (Auto:I,LSPT) enhanced. Distortion as measured by frame-to-frame IS objective quality measures are shown for (c) noisy and (e) enhanced waveforms.
HANSEN AND ARSLAN: NOISY SPEECH RECOGNITION USING THE CREDIT CARD CORPUS
I79
used to derive a combination of ten Mel-cepstral pAarameters mfcc,,,,yr , ten delta Mel-cepstral parameters Anifcc,,,,ln, and energy. This conversion was performed after terminating feature processing. Cepstral mean removal was performed prior to testing. The recognizer was based on monophone hidden M,ukov models, with a single Gaussian per state, each possessing a diagonal covariance matrix. A complete noisefree training and testing evaluation using the entire CCDATA corpus w i h monophone HMM,, models resulted in a correct monophorle recognition score of 43.7%, with an accuracy of 39.7%. Noise-free trained monophone HMM,, 's were used for all recognition evaluations for the remainder of this study. Since we wish to determine performance over a large number of noise conditions, a subset of those sentences used for noise free testing was extracted. A rank ordering of those sentences tested was performed, and the 60 best sentences were extracted for noisy recognition evaluation. This rank ordered set, produced a monophone recognition score of 54.2%, with an accuracy of 51.8%. Next, the 60 sentence rank order test set was sequentially degraded with each noise source at global SNR's of 5, 10, and 15 dB, and submitted to the context-independent HMM monophone recognizer. Recognition scores summarized in Fig. 9 show that average recognition rates decreased across all noise sources. HWY resulted in the smallest decrease from the 54.2% noise-free rate, with average recognition rates of 30.8%-46.9%. Other noise sources such as WGN, FLN, and SUN introduced more pronounced losses in recognition. with rates ranging from 7.1 to 39.7%. Next, results for (Auto:I,LSR:T) feature enhancement for robust recognition are also summarized. Consistent recognition improvement (+8 to +13%) was observed for the following noise sources: WGN, FLLJ, SUN. PS2, LCR. A scatter plot for individual SNR level:) revealed consistent performance for these noise sources as SNR varied from 5 dB to 15 dB. Recognition performance improvement ranged from 13 to 20% at 5 dB, VI. SPEECHRECOGNITION USING 4-8% at 1.5 dB. Feature enhancement for helicopter (HEL) (AUTO$ 1,SP:T) DERIVED FEATURES and large city (LCI) noise sources performed well at 5 dB The (Auto:I,LSP:T) algorithm has been shown to be useful SNR, with recognition improvements ranging from I3 to 21 %. in improving speech features for a limited isolated-word However, this improvement decreases as SNR increases to 15 speech recognition task [26]-[28]. Extensions to this approach dB.Little change (increase or decrease) in recognition rate was based on auditory constraints have also been reported 1321, and observed for highway (HWY)noise. A measurable decrease in shown to improve the quality of CELP coded speech 1501. recognition rate was observed for feature enhancement under Further feature enhancement methods have also been devel- background babble (BAB) noise conditions. The associated bar oped and applied to speech recognition in adverse (i.e., noisy graph illust-ates a representative sample of the improvement stressful) conditions [3 31-[35]. In this section, we consider the in recognit ion using feature enhancement. Finally, means CCDATA corpus with respect to robust feature enhancement and standarjl deviations in recognition rate for degraded and for recognition. As a test of the difficulty of the noise-free feature-enhanced conditions across the noise sources are also CCDATA corpus, an evaluation by BB&N4 using their BYB- summarized for 5 , 10, and 15 dB SNR (BAB noise not LOS system produced a gender dependent phone recognition included in these calculations). With feature enhancement, score of 36.2%, and a gender independent score of 30.1%. The context-independent recognition scores increased + 15.2% for BYBLOS recognition system uses discrete output densities 5 dB SNR (L.e., from 14.2 to 29.4%). +9.59% for 10 dB SNR with features based on normalized cepstra and delta cepstra. (i.e., 29.1 to 38.7%), and +2.9% for 15 dB SNR (i.e., from As shown in Fig. 4, feature-enhanced parameters & n . y k were 40.3 to 43.2%). Feature enhancement processing significantly reduced the variability in recognition across noise sources. 'These results were obtain.:d by P. Jeanrenaud of BB&N as part of the DoD Workshop on Robust Speecli Processing, Rutgers University CAIP Center, This can seen by the fact that recognition standard deviation July 1993. QECOG(NC)ISES,SNR,) was cut in half for each SNR level.
IS measures for the 60 sentence set over three SNR levels. Since objective measures quantify the level of distortion with respect to an original noise-free data set, entries below the diagonal (equal input versus output quality) line represent improvement using feature-enhancement. Also, the effect of additive noise on a degraded utterance reduces to zero as the measure approaches the origin. The results showed that for broadband noise sources such as WGN and FLN, feature enhancement provided a significant level of improvement. The level of improvement was greater at the 5 dB SNR input case. For narrowband noise sources such as HWY, SUN, and PS2, a ITIeaSUrdbk improvement was observed, however the variance in output quality was much higher than for WGN and FLN. This can be explained by the nonuniform impact these noise sources have on speech quality, and the fact that the (Auto:I,LSP:T) algorithm was not adjusted as the noise type was varied. Finally, for the speech-like distortions (LCR,BAB), some utterances were enhanced slightly at the lower SNR level for LCR noise; however, feature processing was not successful Ior background speaker babble (BAB). Since these noise sources violate the stationarity assumption made in using a single noise spectral estimate from the beginning of each sentence, it is not surprising that limited improvement occurs. The few isolated utterances for WGN and FLN which did not show improvement do contribute to a lower general mean IS improvement. For the LAR measure, consistent improvement was observed for WGN and F'LN noise sources. For some narrowband noise (HWY, PS2), a wide range of objective quality resulted; while others (SUN, HEL) gave more consistent results across SNR. In general, a more consistent level of improvement was observed for narrowband noise sources at lower SNR's, with a steady increase in measure variance as SNR increased. Similar results were obtained for WSSM, though measure variance levels were notably lower for most low frequency noise sources.
IEEE TRANSACTIONS ON SPEECH AND AUDIO PROCESSING, VOL. 3, NO. 3, MAY 1995
"UT
VI.
IN"m,FEATUREENHANCED NIST SNR: KN
FEATURE E " C E D MST SNR:WGN
6or-----l *r '
50
~
,/'
40-
30 -
20 -
10 -
I INPUT NIST SNR (dB)
(a) INPUTm. FEA711REI?NHANCEDNISTSNR: HWY NOISE
6 o r - - - - P I
-0
IO
'
20
I
I
30
40
50
60 INPUTMST SNR (dB)
(d)
1
4
CREDIT CARD DATABASE ENHANCEMENT R E S r m S T S N R dB) Avn. Inout I WGN I FLN I HWY I
Fig. 7. Improvement in NIST SNR for (a) WGN, (b) FLN,(c) HWY Noise, (d) HEL using 60 Credit Card sentences across 11 noise sources and three average input SNR levels. AVG-7 indicates average NIST SNR value for the seven nonspeech noise sources (i.e., LCR large crowd noise, and BAB: multiple speaker babble noise scores were excluded).
If statistics are collected for degraded and feature-enhanced recognition scores across the eight nonspeech noise sources (excluding BAB), and three SNR's (i.e., 24 degrading noise conditions), average recognition increased by +9.22% (27.9 to 37.1%), with a corresponding decrease in variability as represented by standard deviation in recognition from 12.4 to 6.5. These findings suggest that (Auto:I,LSP:T)can be used
to increase speaker independent continuous speech recognition performance in a wide range of noise conditions. It should be noted that the particular HMM recognizer was quite basic. If triphone models, and/or multiple Gaussian mixtures per state were included in the recognizer formulation, higher overall recognition rates could be achieved for an actual working system in adverse conditions.
~
HANSEN AND ARSLAN NOISY SPEECH RECOGNITION USING THE CREDIT CARD CORPUS
INPUT vs. FEATURE ENHANCED IS MEASURE: WON
181
INPUT va. FEATURE ENHANCED IS MEASURE: FLN
1 , 0
/
+
/
/
/
0
/
*
*
/
*
/
*
0
/
,'
/
1
+*
+ / / '
/ /
+
/
I
/
9:
I
*
O
/
I
/
+
/
+
/
1 0
I I
/
,+'
/
/ /
+
/ /
0
+
/
/
m lOdB
1
2
3
4
5
6
7
1
INPUT ITAKURA-SATTO MEASURE
2
3
w
7
a
/
5
O
/ /
+
t
/
,/
/
/
i
zU 4
/ +
5
+
9
/ '
+
/
/
/
* -
+
*
1 6
/
,
*
v)
/
,
o
a
/
*
7
(b)
/
°
6
INPUT va. FEATURE ENHANCED IS MEASURE: BAB
INPUT vs. FEATURE ENHANCED IS MEASURE: HWY
0
5
INPUT ITAKURA-SATTO MEASURE
(a)
$ 4 1
4
I
2
t
fi3 Z 0
U $ 2
w
INPUT SNR
W
a
n lOdB
5
lOdB
1
U W
0
1
2
3
4
5
6
INPUT ITAKURA-SATTO MEASURE
(c)
7
0
1
2
3
4
5
6
7
INPUT TTAKURA-SAITO MEASURE
(4
Fig. 8. Scatter plots of smple input degraded (DE) and Auto-LSP feature-enhanced (FE) [takura-Saito ( d l s ) objective quality measures using 60 Credit Card sentences across three average input SNR levels: (a) WGN, (b) FLN, (c) HWY, (d) BAB.
vu. EVALUATION OF OBJECTIVE MEASURE RECOGNITION ESTIMATOR
average mean-square error for each objective measure and NIST SNK were computed and summarized in Table V. Objective speech quality measures and NIST SNR have The results show that across the degraded speech conditions been used to illustrate the change in speech quality as addi- (nine noise: sources, 5-15 dB SNR band), the WSSM based tive background noise conditions are varied. These measures MAP estimator provides the best estimate of recognition have also been used to quantify the change in quality after performance. After (Auto;I,LSP:T) processing, the IS based (Auto:I,LSP:T) feature processing. Next, the recognition rate MAP estimator proved to be the best, while the WSSM MAP estimator is evaluated for each of the nine noise sources, based estimator lost performance. The NIST SNR measure for each of the three objective speech quality measures and consistently came in last across the nine noise sources in NIST SNR. Fig. 10 shows an example of recognition rate both degraded and feature-enhanced conditions. If we wish versus IS objective quality measure for degraded and feature- to determine the best MAP estimator using either degraded enhanced white Gaussian noise CCDATA conditions. Note that or feature-enhanced parameters for recognition, then the IS only mean values for degraded and feature-enhanced IS and based estimator is the best overall predictor of recognition rate, recognition rate are shown. Clearly, there exists a relationship while the NISTSNR estimator is the poorest predictor. Since between the IS measure and recognition performance. The the IS measure proved to be the better estimator, we choose
IEEE TRANSACTIONS ON SPEECH AND AUDIO PROCESSING, VOL. 3, NO. 3, MAY 1995
182
NOISY CCDATA SPEECH RECOGNITION (Effect of Constrained Feature Enhancement) DEGRADE0 CCDATA SPEECH with A W S P FEATURE ENHANCEMEW
50 Y
40
Z
30
2 0
20
'?
=
10
5
10 15
MUI
5
10 15 FLU
5
in WN
15
_ i _n i _s
s
s. i n .
I(LL
15_
C E A
BACKGROUND NOSE DlSTORllON (dB)
Fig. 9. Mean monophone recognition rate across three input SNR levels ( 5 , 10, 15 dB), for degraded input and with (Auto:I,LSPT) feature enhancement. The noise-free monophone rate U as 54.2%. The nine noise sources are as follows: WGN-white Gaussian; FLN-flat communications channel; SUN-Suncomputer fan; PS2-IBM PS-2 computer fan; LCR-large crowd noise; LCI-large city noise; HEL-helicopter noise; HWY-automobile highway noise; BAB-multiple speaker hahble noise. Calculation of niHI,:(.oC; (NOISES. SNR,). ORECOG(NOISES; SNR,), ~ R E C O G ( N O I S ESNR), S. and -ECOG(NOISES, SNR) excluded BA9 noise results.
MEASURE IS drs LAR d L i R KLATT dwssM NIST S N R
DEGRADED AVG. ERROR 0.7620 1.0656 0.6193 1.4730
to summarize its performance across the nine noise sources in Table VI. In this table, entries a and 6 correspond to terms in the MAP estimator (13). Consistent performance is observed for the IS based MAP estimator for most noise sources under degraded speech conditions. A notable loss in performance is seen for BAB and LCR noise conditions, a result attributed to the nonstationarity of the noise source. For feature-enhanced conditions, uniform performance also results, with a decrease in error for all but WGN and HEL noise sources. Though we conclude that the IS based estimator provides good performance for recognition rate estimation, it is hypothesized that a composite estimator based on several measures may result in a better overall prediction of recognition rate.
0.8828
4.7050
3.0890
VIII. CONCLUSION
In order to improve the environmental robustness of speech recognition in adverse conditions, a constrained iterative feature-estimation algorithm (Auto:I,LSP:T), previously employed for speech enhancement, is considered which is shown to produce improved speech characterization in a wide range of actual noise conditions such as various computer fan noises, large crowd noise, and voice communications channel noise. A MAP estimation process was also formulated using one of four measures as a means of predicting changes in recognition performance at the signal extraction phase. The four measures considered included,
HANSEN AND ARSLAN: NOISY SPEECH RECOGNITION USING THE CREDIT CARD CORPUS
RECOGNITION
* 50.
VI.
ITAKURA-SAITO MEASURE : WON
NOISE FREE FEATURE ENHANCED
40
-
E
d
zB
$
* 1 5 dB DEQRADED
3020-
a 10
-
0 -
0.5
I
’
2 ITAKURA-SAITO MEASURE 1.5
2.5
3
Fig. 10. Context-independent monophone recognition rate versus ItakuraSaito objective quality measures for degraded and feature-enhanced (Auto:I,LSP:T) processing. Results are for WGN at 5-15 dB SNR.
TABLE VI SUMMARY OF MAPESTIMATION PARAMETERS FaOM (13) FOR THE ITAKURA-SAW0 d15 BASEDRECOGNITIO~ ESTIMATOR ACROSSNINENOISE SOURCES. CORRESPOND IN(^ TERMS FOR THE MAPESTIMATDR ACROSSEACH AND FEATURE-ENHANCED CONDITIONS ARE NOISESOURCE FOR DEGRADED FOR EACHESTIMATOR SHOW. MEANSQUARE ERRORIS SUMMARIZED RATE ESTIMATION NOISE TYPE h
WGN FLN HWY
I
LCR SUN
53.4970 54.6390
-16.4400 -31.2130 -10.4020
60.9210
11
64.4680
I
I
-36.9620
error . .
I
0.8350
ENHANCED I b I error
I
94.1970
0.6350 0.2290 0.0750
-20.4380 -54.9940 -11.6310
60.5080 86.6220 59.5780
0.0080 0.6900 0.1370
I
n
I
-41.9160
I
0.6770
i) NIST SNR ii) Itakura-Saito log-likelihood iii) log-area-ratio iv) weighted-spectral slope measure. A context-free, continuous distribution, monophone based hidden Markov model algorithm was used for recognition valuation and objectke measure analysis. Evaluations based on the Credit Card cc)rpus showed that feature enhancement provides a consistent level of recognition improvement for broadband, and low-frequency colored noise sources. As the assumption of stationarity breaks down for a given noise source, the ability of fcature enhancement to improve recognition performance decreases. Finally, the log-likelihood based MAP estimator for output recognition rate was found to be the best predictor of recognition performance, while the NIST SNR based MAP estimator was found to consistently be the poorest recognition predictor across the nine noise sources under consideration. The results show that robust front-end feature enhancement can contribute to improved recognition performance in a variety of adverse recognition conditions, and that a measure of recognition performance can be derived at the feature extraction stage based on an objective measure.
183
REFERENCES
[I] “Getting started with the DARPA TIMIT CD-ROM: An acoustic phonetic continuous speech database.” National Institute of Standards and Technology (NIST), Gaithersburg, MD, (prototype as of Dec. 1988). [2] L. M. Arslan and J. H. L. Hansen, “A minimum cost based phoneme class detector for improved iterative speech enhancement,” in IEEE ICASSP-94. Adelaide, Australia, Apr. 1994, pp. 4 5 4 8 , vol. 2. [3] S. F. Holl, “Suppression of acoustic noise in speech using spectral subtraciion,” in IEEE Trans. Acoust.. Speech, Signal Processing, vol. ASSP-:!7 pp. 113-120, Apr. 1979. [4] Z. S. Btmd and T. J. Moore, “A note on Loud and Lombard Speech,” in Proc. I990 Int. Con$ Spoken Language Processing, Kobe, Japan, Nov. 1990, pp. 969-972. [5] S. E. Bou-Ghazale and J. H. L. Hansen, “Duration and spectral based stress token generation for HMM speech recognition under stress,” in IEEE ICASSP-94. Adelaide, Australia, Apr. 1994, pp. 413416, vol. 1. [6] P. Brei:kopf and T. P. Barnwell, “Segmentation preclassification for improvcd objective speech quality measures,” in Proc. I981 IEEE ICASSF’, Atlanta, GA, Mar. 1981, pp 1101-1104. [7] D. A. Cairns and J. H. L. Hansen, “ICARUS: A n Mwave based real-time speech recognition system in noise and lombard effect,” in ICSLP-92. Int. Cot$ Spoken Language Processing, Alberta, Canada, Oct. 1992, pp. 703-706. [8] B. Carlson and M. Clements, “Speech recognition in noise using a projectism-based likelihood measure for mixture density HMM s,” in Proc. 1092 IEEE ICASSP, San Francisco, CA, Mar. 1992, pp. 237-240, vol. I. [9] Y. CherL, “Cepstral domain talker stress compensation for robust speech recognition,” IEEE Trans. Acoust., Ypeech, Signal Processing, vol ASSP-36, pp. 433-439, Apr. 1988. [lo] P. L. Chu and I). G. Messerschmitt. “A weighted Itakura-Saito spectral distance measure,’’ IEEE Trans. Acoust., Speech, Signal Processing, vol ASSP-30, no. 4, pp. 545-560, Aug. 1982. [ l l ] H. J. C’oetzee and T. P. Barnwell, “An LSP based speech quality measure,” in Pmc. 1989 IEEE ICASSP, Glasgow, Scotland, May 1989. pp. 596-599. [I21 J. R. Cchen, “Application of an auditory model to speech recognition,” J. A c o u ~ tSoc. . Am., vol. 85 no. 6, pp. 2623-2629, June 1989. [13] P. V. de Souza, ,‘Statistical tests and distance measures for LPC coefficicnts,” IEEE Trans. Acousr., Speech, Signal Processing, vol. ASSP-25. no. 6, pp. 5 5 6 5 5 9 , Dec. 1977. [14] B. A. Dautrich. L. R. Rabiner, and T. B. Martin, “On the effects of varying filter bank parameters on isolated word recognition,” IEEE Trans. fwoust., Speech, Signul Pmcewing, vol. ASSP-31, no. 4, pp. 793-80h Aug. 1983. [I51 J. Deller, J. Proakis, and J. H. L. Hansen, Discrete Time Processing oj’ Speech Signals. New York: Macmillan, 1993 (Macmillan Series for Prentice -Hall). [I61 A. P. Dempster, N. M. Laird, and D. B. Rubin, “Maximum likelihood from incomplete data via the EM algorithm,” Ann. Royal Srat. Soc., pp. 1-38, Dec. 1977. [I71 Y. Ephriim, D. Malah, and B. H. Juang, “Speech enhancement based upon hiclden markov modeling,” in Pruc. 1989 IEEE ICASSP, Glasgow, Scotland, May 1989, pp. 353-356. [ 181 Y. Ephraim, “Statistical-model-based speech enhancement systems,’‘ Proc. IEEE, vol. 80, no. 10, pp. 1526-1555, Oct. 1992. [19] M. B. Gxdner, “Effect of noise system gain, and assigned task on talking levels in loudspeaker communication,” J. Acoust. Soc. Amer., vol. 40, pp. 955--965, 1966. [20] A. H. Gray and J. D. Markel, “Distance measures for speech processing,” IEEE Trans. Avousi., Speech. Signal Processing. vol. ASSP-24, pp. 380-391, 1976. [21] R. M. Gray, A. Buzo, A. H. Gray, and Y. Matsuyama, “Distortion measure:, for speech processing,” IEEE Trans. Acousr., Speech, Signal Processi,ig, vol. ASSP-28, no. 4, pp. 367-376, Aug. 1980. [22] F. Gurgen, S. Sagayama, and S. Furui, “Line spectrum pair frequencybased distance measures for speech recognition,” in Int. Con$ Spoken Language Processing, Kobe, Japan, Nov. 1990, pp. 521-524. 1231 C. N. Himley and D. G. Harvey, “Quantifying the Lombard effect,” J. Hearing Speech Disorders, vol. 30, pp. 274-277, Aug. 1965. [24] J. H. L. Hansen and M. A. Clements. “Iterative speech enhancement with spectral constraints,” in Proc. IY87 IEEE ICASSP, Dallas, TX. Apr. 1917, pp. 189-192. ‘ Evaluation of speech under stress and emotional conditions,” [25] -, presented at P m c . .4coust. Soc. Amer.. 114th Meeting. H15, Miami. FL, Nov. 1987.
I84
IEEE TRANSACIlONS ON SPEECH AND AUDIO PROCESSING,VOL. 3, NO. 3, MAY 1995
[26] __, “Constrained iterative speech enhancement with application to automatic speech recognition,” in Proc. 1988 IEEE ICASSP, New York, NY, Apr. 1988, pp. 561-564. “Constrained iterative speech enhancement with application to [27] -, speech recognition,” IEEE Tram. Signal Processing, vol. 39, no. 4, pp. 795-805, Apr. 1991. [28] J. H. L. Hansen, “Analysis and compensation of stressed and noisy speech with application to robust automatic recognition,” Ph.D. Dissertation, Georgia Institute of Technology, p. 428, July 1988. “Evaluation of acoustic correlates of speech under stress for [29] -, robust speech recognition,” in IEEE Pmc. of the Fijfeenfh Annual Northeas1 Biuengineeriiig Conf , Boston, MA, Mar. 27-28, 1989, pp. 3 1-32. [30] J. H. L. Hansen and M. A. Clements, “Stress compensation and noise reduction algorithms for robust speech recognition,” in Proc. 1989 IEEE ICASSP, Glasgow, Scotland, May 1989, pp. 26C269. [?I] J. H. L. Hansen and 0. N. Bria, “Lombard effect compensation for robust automatic speech recognition in noise,” in Proc. I990 Inf. Conf Spoken Language Procrssing, Kobe, Japan. Nov. 1990, pp. 1125-1 128. [32] J. H. L. Hansen, “Detection and recognition of key words under noisy, stressful conditions,” Duke Univ. Tech. Rep. DSPL-92-2, Grant no. NSF-IRI-90-10536, Nai. Sci. Found., p. 248, Mar. 1992. [?3] J. H. L. Hansen and 0. Bria, “Improved automatic speech recognition in noise and Lombard effect,” in EURASIP-92. Sixth Eump. Signal Processing Cun8, Heverlee, Belgium, Aug. 1992, pp. 403406. [?4] J. H. L. Hansen, “Morptiological constrained enhancement with adaptive cepstral compensation (MCE-ACC) for speech recognition in noise and Lombard effect,” IEEE Truns. Speech Audio Processing, vol. 2, no. 4, pp. 598-614, Oct. 1991. 1351. __, “Adaptive souwe generator compensation and enhancement for . speech recognition in noisy stressful environments,” in IEEE ICASSP93, Minneapolis, MN, ,Apr. 1993, pp. 95-98. [?6] B. A. Hanson and H. N’aluta, “Spectral slope based distortion measures with linear prediction analysis for word recognition in noise,” in Proc. I986 IEEE ICASSP, Tokyo, Japan, Apr. 1986, pp. 757-760. ~371 B. A. Hanson and T. Applebaum, “Robust speaker-independent word recognition using instantaneous, dynamic and acceleration features: Experiments with Lorrtbard and noisy speech,” in Proc. 1990 IEEE ICASSP, Albuquerque, NM, Apr. 1990, pp. 857-860. H. Hermansky, N. Morgan, and H. G. Hirsch, “Recognition of speech in additive and convolutional noise based on RASTA spectral processing,” in PXJC.1993 IEEE ICASSP, Minneapolis, MN, Apr. 1993, pp. 83-86. M. J. Hunt and C. Iefebvre, “A comparison of several acoustic representations for speech recognition with degraded and undegraded speech,“ in Pruc. 1989 IEEE ICASSP, Glasgow, Scotland, May 1989, nn. r r - 262-265. --[40] F. Itakura, ‘‘Line spectrum representation of linear predictive coefficients of speech signals,” J. Acousf. Soc. Am., vol. 57, S35(A), 1975. [4 11 F. Jelinek, “Continuous speech recognition by statistical methods,” Proc. IEEE, vol. 64, pp. 532-556, Apr. 1976. [42] B. H. Juang, “Speech recognition in adverse environments,” Compuf. Speech Language, vol. 5 , pp. 275-294. 1991. [43] J. C. Junqua, ‘The Lombard reflex and its role on human listeners and automatic speech rccognizers,” J. Acousf. Soc. Amer., vol. 93, pp. 51&524, Jan. 1993. [44] D. Matt, “Prediction of perceived phonetic distance from critical-band spectra: A first step,” in Proc. 1982 1EEE ICASSP, Paris, France, 1982, pp. 1278-1281. [45] J. S. Lim and A. V. Oppenheim, “All-Pole modeling of degraded speech,” IEEE Trans. Acoust.,Speech. Signal Processing, vol. ASSP-26, pp. 197-210, June 1978. [46] R. P. Lippmann, E. A. Martin. and D. B. Paul, “Multi-style training for Robust isolated-word speech recognition.” in Pmc. 1987 IEEE ICASSP, Apr. 1987. pp. 705-708. [47] F. H. Liu, A. Acero, and R. M. Stem, “Efficient joint compensation of speech for the effech of additive noise and linear filtering,” in Proc. 1992 IEEE ICASSP, San Francisco, CA, Mar. 1992, pp. 257-260, vol. I. [48] E. Lombard, “Le Signe de 1’Elevation de la Voix,” Ann. Maladies Oreille, Larynx, Nez, Pltatyvnx, vol. 37, pp. 101-119, 1911. [49] D. Mansour and B. H. Juang, “A family of distortion measures based upon projection operation for robust speech recognition,” IEEE Trans. Acuusf., Speech, Signal Processing. vol. ASSP-37, pp. 1659-1671, 1988. [50] S. Nandkumar, J. H. I,. Hansen, and R. Stets, “A new dual-channel speech enhancement technique with application to CELP coding in noise,” in ICSLP-92, lilt. Con& Spoken Language Processing, Alberta, Canada, Oct. 1992, pp. 527-530. [51] D. B. Paul, “A speaker-stress resistant HMM isolated word recognizer,” in Proc. 1Y87 IEEE I G t S S P , Dallas, TX. Apr. 1987, pp. 713-716.
[52] S. R. Quackenbush, T. P. Barnwell, and M. A. Clements, Objecfive Measures of Speech Quality. Englewood Cliffs, NJ: Rentice-Hall, 1988. [53] P. K. Rajasekaran, G. R. Doddington, and J. W. Picone, “Recognition of speech under stress and in noise,” in Proc. 1986 IEEE ICASSP, Tokyo, Japan, Apr. 1986, pp. 733-736. [54] B. J. Stanton, L. H. Jamieson, and G. D. Allen, “Acoustic-phonetic analysis of Loud and Lombard speech in simulated cockpit conditions,” in Proc. 1988 IEEE ICASSP, New York. NY, Apr. 1988, pp. 331-334. “Robust recognition of Loud and Lombard speech in the fighter [55] -, cockpit environment,” in Proc. 1989 IEEE ICASSP, Glasgow, Scotland, May 1985, pp. 675-678. [56] W. V. Summers, D. B. Pisoni, R. H. Bernacki, R. I. Pedlow, and M. A. Stokes, “Effects of noise on speech production: Acoustic and perceptual . Amer., vol. 84, pp. 917-928, Feb. 1988. analyses,” J. A c o u ~ tSoc. [57] W. D. Voers, “Diagnostic acceptability measure for speech communication sys.ems,” in Proc. 1977 IEEE ICASSP, Hartford, CT, May 1977, pp. 204-207. [58] S. Wang, A. Sekey, and A. Gersho, “Auditory distortion measure for speech coding,” in Proc. 1991 IEEE ICASSP, Toronto, Canada, May 1991, pp. 493496. [59] M. Wang and S. Young, “Speech recognition using hidden Markov model decomposition and a general background speech model,” in Pruc. 1992 IEEE ICASSP, San Francisco, CA, Mar. 1992, pp. 253-256, vol. I. [60] B. Widrow, et al. “Adaptive noise canceling: Principles and applications,” P n x . IEEE, vol. 63, no. 12, pp. 1692-1716, Dec. 1975.
John H. L. Hansen (S’81-M’82-SM’93) was born in Plainfield, NJ. Hc received the B.S.E.E. degree with highest honors from Rutgers University, New Brunswick, NJ, in 1982. He received the M.S. and Ph.D. degrees in electrical engineering from Georgia Institute of Technology, Atlanta, in 1983 and 1988, respectively. In 1988. he joined the faculty of Duke University, as an Assistant Professor in the Department of Electrical Engineering, and received a secondary appointment in the Department of Biomedical Engineering in 1993. He is the coordinator of Robust Speech Processing Laboratory in the Department of Electrical Engineering. Prior to joining the Duke faculty, he was employed by the RCA Solid State Division, Somerville, NJ (1981-82). and Dranetz Engineering Laboratories, Edison, NJ (1978-81). He has served as a technical consultant to industry, including AT&T Bell Laboratories and I.B.M., in the areas of voice communications, wireless telephony, and robust speech iecognition. His research interests span the areas of digital signal processirig, analysis and physical modeling of speech under stress or pathology, speech enhancement and featbre estimation in noise, robust speech recognition with a current emphasis on auditory-based constrained speech enhancement, and source generator based speech modeling for robust recognition in noise, stress. and Lombard effcct. Dr. Hansen i,; the author of numerous papcrs and technical reports in the field of speech processing, and is coauthor of the textbook Discrete-Eme Processing of Speech Si,ynuls (Prentice-Hall, 1993). He was the recipient of a National Scicnce Foundation’s Research Initiation Award in 1990, and has been named a Lilly Foundation Teaching Fellow. He has served as Chairman for the IEEE Communications and Signal Processing Society of North Carolina, Advisor for the Duke University IEEE Student Branch, and ON SPEECH is presently seriing as Associate Editor for IEEE TRANSACTIONS AND AUDIOPROCESSING. He has also served as co-editor of the Oct. 1994 special issue on Robust Speech Recognition for that publication.
Levent M. Arslan was born in Besni, Turkey on September 2, 1968. He received the B.S. degree in electrical engineering from Bogazici University, Istanbul, Turkey in 1991, and the M.S. degree in electrical engineering from Duke University, Durham, NC, in 1993. During the summer of 1994, he was a visiting speech researcher at Texas Instrumcnts, Dallas, TX. He is currently working towards the Ph.D. degree in electrical engineering at Duke University. His research interests Include digital signal processing, speech enhancement. speech analysis, and speech recognition in noisy environments.