AIA-DAGA 2013 Merano
Robust force identification for complex technical structures with single degree of freedom excitation using an adaptive algorithm in time domain Michael Sturm1,3, Andy Moorhouse1, Wolfgang Kropp2, Thomas Alber3 1
University of Salford, Acoustics Research Centre, Salford M5 4WT, UK, E-Mail:
[email protected] 2 Chalmers University of Technology, Applied Acoustics, 41296 Göteborg, Sweden 3 ZF Lenksysteme GmbH, Basic Development Acoustics, 73527 Schwäbisch Gmünd, Germany
Introduction Many situations require the knowledge of dynamic forces acting on technical structures. One example is the determination of the exciting forces generated inside of machinery during operation. Since the internal sources usually are not accessible for direct force measurements, the internal loadings have to be inferred from the structural responses. Commonly, this ill-posed inverse problem is addressed in frequency domain where matrices containing measured frequency response functions (FRFs) have to be inverted. However, these methods are well known to be highly sensitive to measurement noise and suffer from poor conditioning. Usually, the robustness of such solutions has to be improved by applying some form of regularisation (see amongst many examples [1]). In this paper, a time domain solution to the inverse problem is presented. The motivation for this approach is threefold. First, the approach should be applicable for transient excitations. Second, the challenges in the inverse problem are manifested differently in time domain so that more accurate and robust solutions may be found. Finally, the approach should be capable of continuously processing operational data of arbitrary length as in large data sets. A number of time domain approaches can be found in literature including inverse methods, Kalman filters, state-space methods, inverse filtering, and sensitivity methods, as summarised in [2]. However, most of them lack in generality with respect to the underlying assumptions or the way they describe the physical system for which reason they are not practicable for sophisticated structure-borne sound problems. Kropp and Larsson [3] introduced a time domain force identification technique based on an adaptive algorithm that seems to be less restrictive. The physical system is modelled by means of measured FRFs that are first transformed into time domain before the obtained impulse response functions (IRFs) are used to filter estimated input forces so as to predict a set of estimated responses. The error between the estimated and true responses is then used to update the input force estimation recursively. In this paper, the practicability of the method for complex technical structures with single degree of freedom excitations is discussed. The robustness and accuracy of the time domain (TD) inversion routine will be demonstrated using numerical and experimental examples.
Derivation of the TD inversion routine The main idea of the presented time domain force identification method is based on the Least Mean Square (LMS) algorithm, devised by Widrow and Hoff [4]. An application of the LMS algorithm, which may be readily
1730
thought of, is the problem of single-input single-output (SISO) system identification in the context of adaptive filtering, as depicted in Fig. 1(a).
Figure 1: Block diagram of adaptive system modelling (a) and adaptive input reconstruction (b)
An adaptive filter with a finite number of adjustable coefficients, hi(n) for i=[0, 1,…, I-1], provides a linear model of an unknown system. Let their respective impulse response functions be denoted by h(n)=[h0(n), h1(n),…, hI-1(n)]T and hu where n denotes discrete time and the superscript T stands for vector transpose. Both systems are driven by the same (real-valued) input signal, x(n), in the following considered to be a dynamic force applied to a mechanical structure. The error signal, e(n), required for adaption is defined as the difference between the desired response, d(n), considered as structural response, and the output, y(n), provided by the adaptive filter I −1
y ( n ) = ¦ hi ( n ) x ( n − i )
(1)
e ( n ) = d ( n ) − hT ( n ) x ( n )
(2)
i=0
where x(n)=[x(n), x(n-1),…, x(n-I+1)]T is the input vector at time n containing the current and delayed values of the dynamic force. The aim is to minimize the error with respect to the tap-weight vector h(n) so as to achieve a set of FIR filter coefficients that best approximates the true system.
Force reconstruction for SISO systems In the following we strive for modifying the conventional LMS algorithm in such a way that it allows for reconstructing the input signal instead of modelling the system’s impulse response. The above system identification problem thus turns into an inverse problem in which the time history of a dynamic force applied to a mechanical structure is to be identified, assuming the FIR of the system is known and time-invariant. Inspecting equation (1), at each time step n, the convolution considers I FIR coefficients and an equal number of input samples. Since convolution is commutative the FIR vector and the tap-input vector can be interchanged. Accordingly, the block diagram from Fig. 1(a), which is closely related to this filtering process, may also be rear-
AIA-DAGA 2013 Merano ranged and depicted as the schematic in Fig. 1(b). Clearly, the time-invariant FIR sequence, hi for i=[0, 1,…, I-1], now assumes the role of an input signal whereas the new adaptive tap-weight vector, x(n), accounts for the I most recent time samples of the force applied to the physical system. Note the obtained block diagram depicts the filtering process at a specific time n. In order to derive a convergent adaption algorithm, further constraints need to be put on the involved signals which is indicated by apostrophes and will be explained later. However, most important at this point is that the block diagram in Fig. 1(b) is essentially the same as the one of the conventional LMS algorithm and so are the basic mathematical relations, as elaborated in [2]. Thus, the error in (2) remains unchanged but now has to be minimised with respect to the force input vector, x(n). In this respect, the mean-square error ξ ( n ) = E ª¬ d 2 ( n ) º¼ − 2hT E ª¬ d ( n ) x ( n ) º¼ + hT E ª¬ x ( n ) xT ( n ) º¼ h
(3)
where E[Â] denotes statistical expectation has turned out to be an advantageous criterion for minimisation. It is clear that the obtained performance surface, Ʈ(n), is a quadratic function of the tap-weight vector x(n). For real physical systems Ʈ(n) must be concave upward with a single global minimum at which the tap-weight vector assumes its optimum value [5]. The minimum can be found by employing the gradient-based iterative method of steepest descent (SD)
x ( n + 1) = x ( n ) − μ∇ξ ( n ) = x ( n ) + 2μ E ª¬ e ( n ) h º¼ (4) where ȝ is the step size parameter and ∇ȟ(n) is the gradient vector with respect to the current tap-weights. However, the SD recursion contains the ensemble average of the gradient, expressed by the rightmost term in (4), which, in practice, must be estimated. In the conventional LMS algorithm, the accordant ensemble average can be replaced by its instantaneous sample values and convergence in the mean square is achieved by averaging over the corrections at each time step applying a sufficiently long input signal. When adjusting the input signal, i.e. the dynamic input force x(n), instead, the ensemble average cannot be reached in the same manner since the adaptive filter considers a different sequence of the unknown input process at each time. At the time n, the values [x(n), x(n-1),…, x(n-I+1)] of the weight vector x(n) are adjusted. At the next time step n+1, the subset is first modified by shifting forward by one sample before its most recent values, [x(n+1), x(n),…, x(n-I+2)], are updated. In consequence of the shifting process each value of the unknown input signal x(n) can at most be updated I times. Since this is not sufficient to bring x(n) about converging towards its optimum values, Kropp and Larsson [3] introduce constraints for the sequences involved in the adaptive process. (i) By considering only N values of the unknown input signal x(n) and the desired response d(n) the progressional shifting process is restricted to a finite number (N-I+1) of modifications. (ii) The required ensemble average is then achieved by applying a synthesised arbitrarily long input signal to the adaptive filter. For this purpose, the FIR
1731
sequence hi is assumed to be periodically repeated with period length N. Hence, the desired signal d(n) also needs to be repeated with period length N. Considering (i) and (ii), the final recursion
x ( n + 1) = x ( n ) + 2μ e ( n ) h ( n ) for I ≤ n ≤ N ∀ N ≥ 2 ⋅ I
(5)
can be derived from (5), allowing to reconstruct input forces for structures with single DOF excitation. The analogy to the conventional LMS algorithm is given by the equations (1), (2) and (5) which, in this order, are required to complete each iteration cycle k. When n reaches N the process is repeated again from n = I and the next iteration cycle k = k+1 is started. To indicate that the adaptive algorithm relies on a cyclic iterative process the time variables n and i will be indexed by k in the following. The condition N 2ÂI in Eq. (5) accounts for the first I values of the desired signal that are influenced by values of the input signal outside of the observation window [1, …, N]. Thus, reliable reconstruction of the input signal is only possible for values at times nk I+1 [2],[3].
Force reconstruction for SIMO systems It is known that over-determining the system, i.e. by considering a larger number of operational responses than forces to be identified, can reduce the extreme sensitivity of frequency domain (FD) inverse methods to measurement errors [1]. Sufficient over-determination is achieved if the number of modes contributing to the considered responses at a given frequency exceeds the number of applied forces. Thus, selection of suitable measurement positions is significant in order to improve the condition of the FRF matrix. Since the proposed TD inverse routine does not require solution of an equation system by inversion of a possibly ill-conditioned FRF matrix, the choice of measurement positions is less crucial than for common FD inverse methods. Difficulties with FRF matrices near to singularity will not emerge. Still, noise in the measured impulse response functions (IRFs) or the operational responses will affect the instantaneous gradient of a particular measurement position resulting in erroneous force reconstructions if only one response position is considered, as done in (5). However, under the general assumption that measurement errors at different positions are uncorrelated, spatial averaging over the instantaneous gradients of multiple response positions will compensate for the inherent noise. The mean over all instantaneous gradients will converge towards the gradient expected without the influence of noise, thus leading to the required minimum squared error, as suggested in [3] and proved sufficient in [2]. Hence, taking over-determination into account the above SISO inversion routine (equations (1),(2),(5)) can be modified as follows. An individual error for each response position is introduced. Referring to each response signal by means of the variable m, equation (2) expressed in terms of (1) gives the individual error signals I −1
em ( nk ) = d m ( nk ) − ¦ x ( nk − ik ) hm ( ik ) . i =0
(6)
AIA-DAGA 2013 Merano Correspondingly, the instantaneous gradient in (5) needs to be replaced by the average over all m instantaneous gradients, given for each response position as the error in (6) weighted with the respective IRF between the location of excitation and response. The adaption equation (5) thus can be rewritten as
x ( nk + 1) = x ( nk ) + 2μ m em ( n ) h m ( nk ) for I ≤ nk ≤ N ∀ N ≥ 2 ⋅ I
(7)
In the following, the presented adaptive algorithm will be used to identify unknown input forces applied to a complex technical structure.
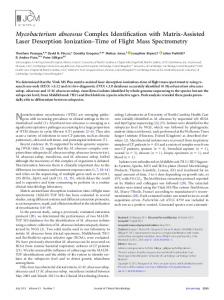
Application of the TD inversion routine An electrical steering system mounted on a front axle carrier is considered as test structure. The assembly is depicted in Figure 2.
where the angle brackets indicate the averaged error gradient. As discussed above, the averaged error gradient compensates for uncorrelated noise inherent in the measured data. So far we have neglected specifying the step size parameter ȝm which is a convergence factor controlling the stability and the rate of adaption at each time step nk. In order to achieve convergence it has been found [2] that the step size parameter, in practice, needs to satisfy the stability bound 2 · § M I −1 0 < μm < M ⋅ ¨ ¦ ¦ hm ( i ) ¸ © m =1 i =0 ¹
−1
(8)
where M is the total number of response positions considered by the adaptive algorithm.
Summary of the time domain inversion routine Table 1 summarises an implication of the achieved time domain inversion routine facilitating reconstruction of the dynamic force signature applied to technical structures with single degree of freedom excitation. Table 1: Adaptive algorithm for identification of forces in single input multiple output systems
Figure 2: Steering system mounted on front axle carrier with single source s(z ) and multiple response points (Pm ).
For the experiment it is assumed that the Steering system comprises an ideally point-like structure-borne sound source s(z) exciting the assembly in a single degree of freedom (DOF). The source is located inside the Steering system, thus it is only accessible for measurements through a cut-out in the housing. Structural responses are measured in M = 32 DOFs, as indicated by the points Pm. The dynamic properties of the structure are measured in terms of accelerances by applying impact testing methods using a sample frequency of fs = 12 kHz. An impulse response functions for each of the measured FRFs is calculated by inverse Fourier transform. In a subsequent step all IRFs are truncated to an equal length of I = 2048 samples, where I is chosen with respect to the slowest decaying IRF. This set of impulse response functions is considered to fully describe the system under test, being aware of possible inconsistencies caused by unavoidable errors and noise in the measurements.
Numerical example
According to the numbering given in the curly brackets (Table 1) the adaptive algorithm can be described as follows: Starting with an initial guess of the unknown input force, at each time step nk, the measured IRFs (hm) are used to filter the current force estimate x(nk) so as to predict a response, ym(nk), for each measurement position, m {2}. An individual error, em(nk), between each of the estimated filter outputs and the desired responses, dm(nk), is calculated {3}. The average over all instantaneous errors weighted with the corresponding IRF is then used to update the current force estimate recursively {4}. In order to achieve an iterative procedure these steps are to be repeated at each iteration cycle k according to the constraints given in equation {1}. To ensure convergence the step size parameter, ȝm, needs to be chosen according to the stability bound in equation {5}.
1732
In a first example a virtual vibration test is conducted for this structure. Operational responses are calculated by convolving a numerical excitation force with the measured IRFs. Thus, inconsistencies in the measured IRFs become part of the modelled system whilst the generated responses are free from any further errors. To simulate noisy response measurements, uncorrelated white noise with magnitudes corresponding to 10% of the respective RMS values, can be added to the responses. This allows for evaluating the robustness of the adaptive inversion process for known amounts of noise. A simulated transient force is to be recovered from the noisy structural responses by applying the adaptive algorithm from Table 1. Results are illustrated in Figure 3. Although the set of measured IRFs has been shown to comprise severe inconsistencies [2], the force signature can be reconstructed precisely if over-determination (OD) and noise free responses are assumed. Negative effects caused by
AIA-DAGA 2013 Merano random errors in the system description are sufficiently suppressed. In Fig. 3, the recovered force for the noise free state is not illustrated since it is indistinguishable from the exact curve and the spectral estimation error is close to zero. (a)
8
orig rec / OD (10% noise) rec / P10 (10% noise)
10
(b)
orig rec / OD (10% noise) rec / P10 (10% noise)
6
0 -10
t
4
d
-20 0
0.1
0.2
9.5
0.3
0.4 0.5 Time [s]
0.6
0.7
0.8
error / OD (10% noise) error / P10 (10% noise)
(c)
Force [N]
Force [N]
20
2
0
1 0 -1
-2
Δ X [dB]
5
0
500
1000 1500 Frequency [Hz]
2000
2500
0.195
0.196 Time [s]
0.197
Figure 3: Original and reconstructed force signature in full length (a), close-up (b) and spectral estimation error (c): exact ņņ; over-determined ņ ņ; from single response ƒƒƒƒƒ.
Uncorrelated noise added to all responses affects the overdetermined inversion process only slightly, even if a considerable amount of noise is added. The force signature can be identified accurately (Fig. 3,(a,b)). Only the first 170 ms, corresponding to the decay time td .= .I / fs of the IRFs, cannot be recovered from the available data. In this range the responses are influenced by forces applied to the structure outside the observed time window. The spectral force estimation error seldom exceeds |1 dB| as evidenced in Fig. 3,(c). In contrary, attempts to recover the impulsive force from a single noisy response fail, as shown for measurement point ‘P10’ (see Fig. 2) to which the source contributes well. The recovered transient force signature, in this case, is buried in noise and large spectral estimation errors (max. |ǻX| § 10 dB) prevail.
Experimental example The practicability of the force identification method for reallife measurement scenarios was tested by applying a long duration (20 seconds) impulsive force signal to the assumed source region using an instrumented hammer. The exciting forces and the structural responses were measured in parallel. Errors included in the obtained data are considered to be representative for typical measurement scenarios. The adaptive algorithm from Table 1 was used to recover the input force from the noisy measurements. Results are shown in Figure 4. (a)
(b)
meas rec
200
meas rec
100 0
200
0
5
10 Time [s]
15
20
ΔX [dB]
(c)
error in force 0
1 0 -1 -100
-5 0
500
1000 1500 Frequency [Hz]
2000
2500
Conclusions An adaptive algorithm [3] has been presented that is capable of reconstructing the time signature of a single dynamic force applied to complex technical structures, given the structure’s impulse response functions and operational response time histories. The time domain inversion routine does not rely on inversion of a possibly ill-conditioned FRF matrix nor requires extensive regularisation techniques to improve the solution as often required in frequency domain inverse methods. In frequency domain inverse methods, ‘weak’ paths bring about dominant contributions after inversion, which are highly susceptible to noise. Instead, the time domain method is always dominated by the strongest signal so that the choice of measurement positions is generally not very critical. Robust and accurate solutions have been achieved for a complex structure even in the presence of considerable defective measurement data. Therefore, the time domain approach is an interesting complement to established frequency domain methods.
References [1] Thite, A.N., Thompson, D.J.: The quantification of structure-borne transmission paths by inverse methods. Part 1: Improved singular value rejection methods Journal of Sound and Vibration, 264 (2003), 411-431.
[3] Kropp, W., Larsson, K.: Force estimation in the time domain by applying an LMS algorithm. Proceedings of NOVEM, Saint-Raphaël, France, (2005)
100
5
However, uncorrelated noise in the responses and considerable errors in the measured IRFs are significantly suppressed by the over-determined approach. The time signature of the applied force can be reconstructed with satisfying accuracy for the full length of the signal (Fig. 4,(a)). An arbitrarily selected impulse is magnified in (b) to evidence the good estimation accuracy. The spectral estimation error (c) is less than |1dB| for most frequencies. At low frequencies the estimation accuracy drops. It is likely that only a few modes contribute to the measured responses at these low frequencies.
[2] Sturm, M., Moorhouse, A.T., Alber, T., Li, F.F.: Force reconstruction using an adaptive algorithm in time domain. Proceedings of ISMA, Leuven, Belgium, (2012), 3617-3630
300
Force [N]
Force [N]
300
Note, the FRF measurements showed generally poor coherence at frequencies below 100 Hz and above 2.5 kHz, thus accurate force identification has not been possible at these frequencies. In order to allow comparing the measured and recovered force signatures, all time series data has been band-pass filtered according to the valid frequency range. It is also stressed that the actual excitation force was measured so that the benchmark force (meas) may also contain errors.
3.841
3.842 Time [s]
[4] Widrow, B., Hoff, M.E.: Adaptive Switching Circuits. Proceedings of IRE WESCON, Los Angeles, California (1960), 96-104
3.843
Figure 4: Identified force signature in full length (a) and close-up (b): measured ņņ; recovered from responses ņ ņ. Spectral estimation error of reconstructed force (c).
[5] Farhang-Boroujeny, B.: Adaptive Filters: Theory and Applications, John Wiley & Sons, New York, 1999.
1733