Hindawi Publishing Corporation Advances in Decision Sciences Volume 2013, Article ID 961501, 5 pages http://dx.doi.org/10.1155/2013/961501
Research Article Robust Monitoring of Contaminated Multivariate Data Eric B. Howington Department of Management, Valdosta State University, 1500 N. Patterson Street, Valdosta, GA 31698, USA Correspondence should be addressed to Eric B. Howington;
[email protected] Received 23 July 2013; Accepted 4 November 2013 Academic Editor: Fernando Beltran Copyright © 2013 Eric B. Howington. This is an open access article distributed under the Creative Commons Attribution License, which permits unrestricted use, distribution, and reproduction in any medium, provided the original work is properly cited. Monitoring a process that suffers from data contamination using a traditional multivariate T 2 chart can lead to an excessive number of false alarms. A diagnostic statistic can be used to distinguish between real control chart signals due to assignable causes and signals due to contamination from a single outlier. In phase II analysis, a traditional T 2 control chart augmented by a diagnostic statistic improves the work stoppage rates for multivariate processes suffering from contaminated data and maintains the ability to detect process shifts.
1. Introduction Davis and Adams [1] consider the problem of dealing with contaminated data in univariate control charts. They consider monitoring a process for which measurement systems are problematic or unreliable, leading to occasional unusual measurements for key quality characteristics. These atypical measurements do not reflect the true state of the process and are referred to as outliers. A sample containing an outlier is said to be contaminated. Contaminated data can be troublesome for practitioners monitoring a process because a control chart signal could indicate a true process shift or could simply be the result of an outlier. Thus, Davis and Adams distinguish two types of signals: signals that indicate a process problem and signals that reflect a data problem. They propose use of a diagnostic statistic that allows the practitioner to distinguish between the two types of signals. When the control chart signals, a diagnostic statistic is calculated for that sample. If the value of the diagnostic statistic exceeds a threshold, then the signal could have been caused by contaminated data and further investigation is warranted before stopping the process. If the value of the diagnostic statistic does not exceed the threshold, then the signal is interpreted as a process problem and appropriate action is recommended. The benefit of such a scheme is clearoccurrence of unwarranted work stoppage is reduced and detrimental process adjustments are avoided.
Davis and Adams restrict their analysis to the univariate case, but it is likely that many processes suffering from contamination issues are not characterized by a single quality characteristic, but by several correlated quality characteristics. A common tool for monitoring several quality characteristics simultaneously is the Hotelling T 2 control chart. If the T 2 chart is used to monitor a process that is known to occasionally generate contaminated samples and the chart signals, the analyst must determine if the process is out of control or if a contaminated sample has caused the chart to signal. We propose an extension of the diagnostic statistic technique for use in conjunction with phase II multivariate process monitoring via the Hotelling T 2 chart.
2. Multivariate Process Control 2.1. Phase I and Phase II Analysis. Applications of control charting schemes involve two phases of analysis: phase I and phase II. Phase I is exploratory analysis of historical process data for the purpose of identifying a set of incontrol data that is free of outliers. This data is then used to estimate the parameters of the process to be monitored. Phase II consists of continuous monitoring of the process using control charts whose chart parameters are treated as known values but which are, in reality, the estimates derived from the phase I analysis. The better the estimates derived
2
Advances in Decision Sciences
from phase I analysis are, the better the phase II control chart will perform. Further discussion of phase I analysis and phase II monitoring can be found in [2]. 2.2. The T2 Control Chart. A multivariate process is characterized by a mean vector 𝜇 and covariance matrix Σ which describes the quality characteristics and their interrelations. During phase I analysis, an in-control and outlier-free set of data is identified and used to estimate process parameters. The mean vector is estimated by the vector of sample means x and the covariance matrix is estimated by the sample covariance matrix S. During phase II analysis, the process is periodically sampled and monitored by plotting one or more statistics on control charts. The upper control limit of the T 2 chart is a multiple of a critical value of an F distribution depending on p being the number of quality characteristics, n the subgroup sample size, m the number of phase I samples, and the desired 𝛼. The phase II upper control limit is given by the following expression: 𝑝 (𝑚 + 1) (𝑛 − 1) × 𝐹∝,𝑝,𝑚𝑛−𝑚−𝑝+1 . UCL = 𝑚𝑛 − 𝑚 − 𝑝 + 1
(1)
Typically, there is no lower control limit in a T 2 chart. The statistic that is plotted is often called Hotelling’s T 2 statistic:
𝑇2 = 𝑛(x − x) S−1 (x − x) .
(2)
This statistic is calculated using the phase I estimates x and S. This statistic is essentially the Mahalanobis distance between the mean vector of the sample, x, and the incontrol mean vector, x. Values of T 2 that fall above the UCL indicate potentially out-of-control or special cause variation and warrant further investigation. Comprehensive treatment of T 2 control charting is given by Mason and Young [3]. 2.3. Outliers in Phase I Analysis. If the analyst fails to identify an in-control and outlier-free sample of process data during phase I analysis; the performance of the control charting scheme during phase II will be degraded. Several authors have discussed solutions to this issue for univariate control charting schemes [1, 4, 5]. It is well known that the sample mean vector and covariance matrix (x and S) are not resistant to the effects of even a single outlying value in the data [6]. The issue of dealing with multivariate outliers during phase I analysis has recently been addressed by a number of authors. According to Vargas, the regular T 2 statistic is not effective in detecting more than one outlier during phase I analysis [7]. Alfaro and Ortega note that multiple phase I outliers can have a “masking” effect on x and S resulting in a phase II chart that is incapable of detecting out-of-control observations [8]. Various methods of dealing with outliers in phase I analysis based upon using robust estimates of x and S have been proposed [7–10]. Vargas [7] and Jensen et al. [9] consider using the minimum volume ellipsoid (MVE) or minimum covariance determinant (MCD) as
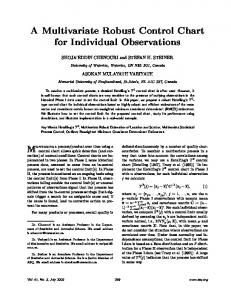
robust estimates of x and S during phase I analysis. Use of the MVE or MCD derived estimates allows for detection and deletion of outliers during the phase I analysis. The parameters used for phase II can then be estimated using outlier-free data. Alfaro and Ortega [8] and Chenouri et al. [10] consider simply replacing x and S with robustly estimated counterparts, thus avoiding having to actually remove the outliers from the phase I data. Alfaro and Ortega suggest using “trimming” to robustly estimate x and S, while Chenouri et al. considers reweighted MVE (RMVE) and reweighted MCD (RMCD) estimates. Chenouri and Variyath [11] assess the performance of RMVE and RMCD-based charts during phase II process monitoring. Variyath and Vattathoor [12] compare performance of traditional, MVEbased, MCD-based, RMVE-based, and RMCD-based charts. These methods are aimed at overcoming the challenges of outliers in phase I estimation of process parameters and do not address how to deal with data contamination (occasional outliers) during phase II monitoring. 2.4. Outliers in Phase II Monitoring. We will define “contamination” as a sample of size n containing 1 outlying observation and 𝑛 − 1 typical observations. Consequently, contaminated samples can cause a T 2 control chart to signal when, in reality, the process is still “in-control” and there is no assignable cause. The average run length (ARL) of the T 2 control charting scheme would be reduced in this scenario. This also holds true for charts generated using robust methods in phase I analysis—the robust methods overcome the impact of outliers in phase I estimation but not in subsequent phase II monitoring. Consider a process that occasionally produces a contaminated sample as described above. Suppose that contamination occurred in sample number 10. Figure 1 displays the T 2 chart for the first 10 samples and 25 additional samples after the signal. The manager monitoring the control chart may call for work stoppage after observing the signal from sample number 10, but, in reality the process is still in-control and there is no assignable cause. The signal is caused by 1 outlying observation within sample number 10.
3. The Diagnostic Statistic Technique We propose a secondary diagnostic statistic (DS) that is calculated after the T 2 chart signals. The purpose of the DS is to distinguish between signals caused by real changes in the process parameters and signals caused by a single outlying value (contamination) within the sample. The value of a DS should reflect the presence or absence of an outlier in the sample under consideration. Contaminated samples should result in large values of the DS and “clean” samples should result in small values of the DS. If the T 2 chart signals, the DS is calculated and compared to a decision value. If the DS exceeds the decision value, the sample is diagnosed as contaminated data. If the DS does not exceed the decision value, then the signal is judged to represent a real process change and appropriate action should
Advances in Decision Sciences
3
Initialize nsig = 0 Do until nsig signals generated Generate multivariate normal (x, S) sample of size 𝑛 Calculate 𝑇2 statistic If 𝑇2 greater than UCL Calculate DS value and record Increment nsig by 1 Return (1-alpha) percentile of recorded DS values Pseudocode 1: Pseudocode for simulation.
Phase II T2 chart
3.2. Diagnostic Statistic Number 2. Use a “leave-one-out” approach to calculate n sets of Mahalanobis distances. The approach is similar to Cook and Weisberg’s deleted residuals in regression analysis [13]. For samples of size n, calculate n sets of “deleted Mahalanobis distances” where the ith set of MDs is calculated by excluding the ith observation from the mean vector and covariance matrix calculation. If the ith observation is contaminated, it should stand out as the largest value in the ith set of MDs. Let MD(𝑖),𝑗 represent the Mahalanobis distance of observation j when observation i is the observation left out. Choose the maximum of these n2 distances:
25
T2
20 15 10 5
DS2 = max (MD(1),1 , MD(1),2 , . . . MD(𝑛),𝑛 ) .
0
If the maximum value of DS2 exceeds a designated decision value, conclude that the sample suffers a data contamination problem.
0
5
10
15 20 Sample
25
30
35
Figure 1: Sample number 10 is contaminated with one outlying observation, but the process is actually in-control, as demonstrated by in-control statistics charted for samples 11–35.
be initiated. In the next section, we propose two possible diagnostic statistics for use in conjunction with the T 2 chart. It is possible that a sample is both contaminated and in an out-of-control state. We suggest that when the DS signals a data problem, analyze the subsample to identify the outlying observation, delete the value, and recalculate the T 2 statistic with the outlying observation deleted. Compare the recalculated T 2 value to an appropriately adjusted control limit. 3.1. Diagnostic Statistic Number 1. Calculate the mean vector and covariance matrix of the subsample of data and use these values to calculate the Mahalanobis distance (MD) of each observation in the subsample to the mean vector of the subsample. Choose the maximum of these distances: DS1 = max (MD1 , MD2 , . . . , MD𝑛 ) .
(3)
If the maximum value of DS1 exceeds a designated decision value, conclude that the subsample suffers a data contamination problem.
(4)
3.3. Sample Sizes. These proposals have sample size requirements. Titterington notes that 𝑝 + 1 data points uniquely determine an ellipsoid such that these 𝑝 + 1 data points are all exactly the same Mahalanobis distance from the mean vector [14]. DS1 requires subsamples of size at least 𝑛 ≥ 𝑝 + 2. DS2 requires subsamples of size at least 𝑛 ≥ 𝑝 + 3. Larger sample sizes are required for DS2 because if 𝑝 + 1 data points were situated in such a way as to form an elongated, narrow ellipsoid, then the data point that is “left out” could artificially appear as if it were an outlier. At least one additional data value is needed to make this scenario unlikely. 3.4. Choosing the Decision Value. Since the DS will only be calculated in the event of a signal, the DS technique should use a decision value from the conditional distribution of the DS given a T 2 chart signal. We suggest using simulation to calculate an appropriate decision value for use in any given control charting scheme and choice of diagnostic statistic. The objective is to find a decision value (dv) such that 𝑃(DS > dv | 𝑇2 signal) = 1− ∝. Since different processes and sampling schemes will be characterized by different values of n, p, and ∝, an appropriate decision value will be unique to the process under consideration. Rather than give lengthy tables that may or may not cover the scenario relevant to any given practitioner, we have chosen to provide pseudocode, which can be implemented by the practitioner in any appropriate software. In Pseudocode 1, nsig is the number
4
Advances in Decision Sciences DS1 values
Phase II T2 chart
40 Diagnostic statistic number 1
8
T2
30
20
10
0
6
4
2
0 0
10
20 Sample
30
40
Figure 2: Sample number 10 is contaminated with one outlying observation. The signals at samples 36–40 are due to a shift in the process mean vector.
of signals desired, n is the subsample size, alpha is the desired ∝, x and S are the process parameters estimated in phase I analysis, and UCL is the upper control limit of the T 2 chart. The practitioner should use simulation to generate a set of tables reflecting the characteristics of their process data and T 2 charting scheme. Computer code for running these simulations in the R statistical computing environment is available from the author upon request. 3.5. An Example. Consider monitoring quality of a product with 𝑝 = 3 interrelated quality characteristics. Phase I analysis has been successfully completed and results in the following in-control process parameter estimates: 3.034 x = [3.556] , [2.788] 1.521 1.131 1.170 S = [1.131 1.562 1.180] . [1.170 1.180 1.315]
(5)
The phase I estimates are used to establish the formula for the T 2 statistics charted during phase II monitoring of future process data. The UCL for the chart is calculated as detailed in Section 2.2 and results in a value of 12.04. This T 2 chart is going to be augmented with a diagnostic statistic. Simulations have been conducted and the decision values for DS1and DS2 for 𝑝 = 3, 𝑛 = 10, and ∝= .01 have been determined as 7.484 for DS1 and 99.6 for DS2. Subsamples of size 𝑛 = 10 are periodically collected from the production process and the T 2 statistics are calculated and plotted in Figure 2. The chart signals at sample number 10. Both DS1 and DS2 are calculated and both diagnostic statistics exceed the
0
10
20 Sample
30
40
Figure 3: Values of DS1 for signaling samples. Only sample number 10 exceeds the decision value.
decision values. The analyst monitoring the process can conclude that the signal for sample number 10 is due to data contamination, not a shift in the process mean vector and the process is allowed to continue running. The chart signals again at samples 36–40. DS1 and DS2 are calculated for these samples, but the values fall below the decision values, indicating that a real shift in the process parameters is responsible for the signals—appropriate action should be taken. The DS is only calculated for samples that signal in the T 2 chart. Figure 3 displays the DS1 calculations for all signaling samples and Figure 4 displays the values of DS2 for all signaling samples. In both figures, the horizontal line is plotted at the decision value. 3.6. Limitations of the T2 -Diagnostic Statistic Scheme. The proposed scheme is more expensive in terms of data collection than popular T 2 schemes based upon individual’s data [15]. The proposed process monitoring scheme requires collection of subsamples of process data rather than individual’s data. DS1 requires samples of size 𝑛 ≥ 𝑝 + 2. DS2 requires samples of size 𝑛 ≥ 𝑝 + 3. Another limitation is the number of outliers that the scheme can accommodate. The T 2 -DS scheme is designed for the specific situation of occasional samples containing a single outlying value. If the measurement system is so problematic that samples are contaminated with multiple outlying values, the proposed scheme will be less effective. The scheme, as proposed here, is based upon the assumption of multivariate normality (as are most multivariate control charting schemes). The scheme could possibly be adapted to other distributions by adjusting the simulation used to generate the decision value.
Advances in Decision Sciences
5
DS2 values
Diagnostic statistic number 2
500
400
300
200
100
0 0
10
20 Sample
30
40
Figure 4: Values of DS2 for signaling samples. Only sample number 10 exceeds the decision value.
4. Conclusions Phase II monitoring of multivariate process data in the presence of occasional data contamination using the T 2 chart can be effectively augmented by a secondary diagnostic statistic. If subsamples are used in the T 2 charting scheme, then the DS can help the analyst distinguish between true shifts in the process parameters and signals caused by single outliers. The technique can be combined with robust estimation of process parameters in phase I. The overall effectiveness of a scheme combining robust methods in phase I with a diagnostic statistic scheme in phase II is a topic for future research.
Conflict of Interests The author declares that there is no conflict of interests regarding the publication of this paper.
References [1] C. M. Davis and B. M. Adams, “Robust monitoring of contaminated data,” Journal of Quality Technology, vol. 37, no. 2, pp. 163– 174, 2005. [2] G. Vining, “Technical advice: phase I and phase II control charts,” Quality Engineering, vol. 21, no. 4, pp. 478–479, 2009. [3] R. L. Mason and J. C. Young, Multivariate Statistical Process Control with Industrial Applications, SIAM, Philadelphia, Pa, USA, 2002. [4] D. M. Rocke, “Robust control charts,” Technometrics, vol. 31, no. 2, pp. 173–184, 1989. [5] L. G. Tatum, “Robust estimation of the process standard deviation for control charts,” Technometrics, vol. 39, no. 2, pp. 127–141, 1997. [6] P. J. Rousseeuw and B. C. van Zomeren, “Unmasking multivariate outliers and leverage points,” Journal of the American Statistical Association, vol. 85, pp. 633–639, 1990.
[7] J. A. N. Vargas, “Robust estimation in multivariate control charts for individual observations,” Journal of Quality Technology, vol. 35, no. 4, pp. 367–376, 2003. [8] J. L. Alfaro and J. F. Ortega, “A robust alternative to Hotelling’s T2 control chart using trimmed estimators,” Quality and Reliability Engineering International, vol. 24, no. 5, pp. 601–611, 2008. [9] W. A. Jensen, J. B. Birch, and W. H. Woodall, “High breakdown estimation methods for phase I multivariate control charts,” Quality and Reliability Engineering International, vol. 23, no. 5, pp. 615–629, 2007. [10] S. Chenouri, S. H. Steiner, and A. M. Variyath, “A multivariate robust control chart for individual observations,” Journal of Quality Technology, vol. 41, no. 3, pp. 259–271, 2009. [11] S. Chenouri and A. M. Variyath, “A comparative study of phase II robust multivariate control charts for individual observations,” Quality and Reliability Engineering International, vol. 27, no. 7, pp. 857–865, 2011. [12] A. M. Variyath and J. Vattathoor, “Robust control charts for monitoring process means of phase I multivariate individual observations,” Journal of Quality and Reliability Engineering, vol. 2013, Article ID 542305, 14 pages, 2013. [13] R. D. Cook and S. Weisberg, Residuals and Influence in Regression, Chapman & Hall, New York, NY, USA, 1982. [14] D. M. Titterington, “Optimal design: some geometrical aspects of D optimality,” Biometrika, vol. 62, no. 2, pp. 313–320, 1975. [15] N. D. Tracy, J. C. Young, and R. L. Mason, “Multivariate control charts for individual observations,” Journal of Quality Technology, vol. 24, pp. 88–95, 1992.
Advances in
Operations Research Hindawi Publishing Corporation http://www.hindawi.com
Volume 2014
Advances in
Decision Sciences Hindawi Publishing Corporation http://www.hindawi.com
Volume 2014
Journal of
Applied Mathematics
Algebra
Hindawi Publishing Corporation http://www.hindawi.com
Hindawi Publishing Corporation http://www.hindawi.com
Volume 2014
Journal of
Probability and Statistics Volume 2014
The Scientific World Journal Hindawi Publishing Corporation http://www.hindawi.com
Hindawi Publishing Corporation http://www.hindawi.com
Volume 2014
International Journal of
Differential Equations Hindawi Publishing Corporation http://www.hindawi.com
Volume 2014
Volume 2014
Submit your manuscripts at http://www.hindawi.com International Journal of
Advances in
Combinatorics Hindawi Publishing Corporation http://www.hindawi.com
Mathematical Physics Hindawi Publishing Corporation http://www.hindawi.com
Volume 2014
Journal of
Complex Analysis Hindawi Publishing Corporation http://www.hindawi.com
Volume 2014
International Journal of Mathematics and Mathematical Sciences
Mathematical Problems in Engineering
Journal of
Mathematics Hindawi Publishing Corporation http://www.hindawi.com
Volume 2014
Hindawi Publishing Corporation http://www.hindawi.com
Volume 2014
Volume 2014
Hindawi Publishing Corporation http://www.hindawi.com
Volume 2014
Discrete Mathematics
Journal of
Volume 2014
Hindawi Publishing Corporation http://www.hindawi.com
Discrete Dynamics in Nature and Society
Journal of
Function Spaces Hindawi Publishing Corporation http://www.hindawi.com
Abstract and Applied Analysis
Volume 2014
Hindawi Publishing Corporation http://www.hindawi.com
Volume 2014
Hindawi Publishing Corporation http://www.hindawi.com
Volume 2014
International Journal of
Journal of
Stochastic Analysis
Optimization
Hindawi Publishing Corporation http://www.hindawi.com
Hindawi Publishing Corporation http://www.hindawi.com
Volume 2014
Volume 2014