can be formulated as the above Integer Linear Program (ILP). .... Improvement through more sophisticated conflict-free and robust operations planning? -2ex ... Vessels have weekly periodic schedule and guaranteed service times [-2ex].
Lecture Notes
Robust Planning and Optimization Course 351-0860-00, Spring Semester 2011
PD Dr. Marco Laumanns Spring Semester 2011
ETH Zurich Institute for Operations Research
Contents 1 Introduction 1.1 Model-based Planning . . . 1.2 Focus and Contents . . . . 1.3 Planning under Uncertainty 1.4 Examples and Organization
. . . .
. . . .
. . . .
. . . .
. . . .
. . . .
2 Decision Theory 2.1 Stochastic Order Relations . . . . . . . 2.2 Utility Functions . . . . . . . . . . . . 2.3 Performance Measures for Robustness 2.4 Simple Supply Risk Example . . . . .
. . . .
. . . .
. . . .
. . . .
. . . .
. . . .
. . . .
. . . .
. . . .
. . . .
. . . .
. . . .
. . . .
. . . .
. . . .
. . . .
. . . .
. . . .
. . . .
. . . .
. . . .
. . . .
. . . .
5 5 6 8 12
. . . .
. . . .
. . . .
. . . .
. . . .
. . . .
. . . .
. . . .
. . . .
. . . .
. . . .
. . . .
. . . .
. . . .
. . . .
. . . .
. . . .
. . . .
. . . .
16 17 19 21 22
3 Stochastic and Robust Optimization 3.1 Terminology . . . . . . . . . . . . . . . . . . . . 3.2 Feasibility Robustness and Chance Constraints 3.3 Outcome and Optimality Robustness . . . . . . 3.4 Parametric Analysis . . . . . . . . . . . . . . .
. . . .
. . . .
. . . .
. . . .
. . . .
. . . .
. . . .
. . . .
. . . .
. . . .
. . . .
. . . .
. . . .
. . . .
. . . .
. . . .
. . . .
. . . .
24 24 26 27 30
Measures: Quantiles and CVaR Risk Measures . . . . . . . . . . . . . . . . . . . . . . . . . . . . . . . . . . . . Quantiles and Value-at-Risk . . . . . . . . . . . . . . . . . . . . . . . . . . . . . Conditional Value-at-Risk . . . . . . . . . . . . . . . . . . . . . . . . . . . . . .
33 33 33 35
4 Risk 4.1 4.2 4.3
5 Recourse Models for Adaptive Planning 5.1 Motivation and Idea . . . . . . . . . 5.2 Structure and Classification . . . . . 5.3 Example . . . . . . . . . . . . . . . . 5.4 Value of Flexibility and Information
. . . .
. . . .
. . . .
. . . .
. . . .
. . . .
. . . .
. . . .
. . . .
. . . .
. . . .
. . . .
. . . .
. . . .
. . . .
. . . .
. . . .
. . . .
. . . .
. . . .
. . . .
. . . .
. . . .
. . . .
38 38 39 41 43
6 Multi-Stage Stochastic Programming 6.1 Further Two-stage Examples . . . . . . . . . 6.1.1 Capacitated Facility Location Problem 6.2 Three-Stage Models and Scenario Trees . . . 6.2.1 Three-Stage WLP . . . . . . . . . . . 6.2.2 Scenario Tree Formulation . . . . . . .
. . . . .
. . . . .
. . . . .
. . . . .
. . . . .
. . . . .
. . . . .
. . . . .
. . . . .
. . . . .
. . . . .
. . . . .
. . . . .
. . . . .
. . . . .
. . . . .
. . . . .
. . . . .
. . . . .
45 45 45 49 49 50
7 Stochastic Dynamic Programming 7.1 Stochastic Decision Trees . . . . . . . . . . . . . . . . . . . . . . . . . . . . . . 7.1.1 Project Management Example . . . . . . . . . . . . . . . . . . . . . . .
51 51 51
. . . .
2
. . . .
. . . .
. . . .
7.2
. . . . . . .
53 53 53 54 55 55 55
. . . . . . . .
58 58 58 59 62 62 63 64 65
9 Infinite Horizon Problems 9.1 Introduction . . . . . . . . . . . . . . . . . . . . . . . . . . . . . . . . . . . . . . 9.2 Discounted Cost Problems . . . . . . . . . . . . . . . . . . . . . . . . . . . . . . 9.3 Average Cost per Stage Problems . . . . . . . . . . . . . . . . . . . . . . . . . .
66 66 66 68
10 Robust Project Planning 10.1 Project Planning and Event-Activity Networks 10.2 Robust Project Scheduling . . . . . . . . . . . . 10.3 Time-Cost Tradeoff Problem . . . . . . . . . . 10.4 Robust Railway Scheduling . . . . . . . . . . . 10.4.1 Operations Planning for Railways . . . 10.4.2 Periodic Event Scheduling Problem . . .
. . . . . .
70 70 72 74 75 76 77
7.3
Generl State-based Model . . . . . . . . . . . . 7.2.1 Concept and Notation . . . . . . . . . . 7.2.2 Example: Inventory Management . . . . 7.2.3 The Basic Problem . . . . . . . . . . . . Stochastic Dynamic Programming . . . . . . . 7.3.1 Principle of Optimality . . . . . . . . . 7.3.2 The Dynamic Programming Algorithm .
. . . . . . .
8 Finite Horizon Problems 8.1 Parametric Dynamic Programming . . . . . . . . 8.1.1 DP step using parametrics LPs . . . . . . 8.1.2 Parametric DP with multiple performance 8.2 Convex Value Functions . . . . . . . . . . . . . . 8.2.1 Optimality of Base-Stock Policies . . . . . 8.3 Optimal Stopping Problems . . . . . . . . . . . . 8.3.1 A Simple Stopping Problem . . . . . . . . 8.4 Summary . . . . . . . . . . . . . . . . . . . . . .
11 Scheduling in Container Terminals 11.1 Robust Capacity Allocation . . . 11.2 Markov Decision Model . . . . . 11.3 Adaptive Robust LP Formulation 11.4 Multi-Level Planning . . . . . . .
. . . . . .
. . . . . . .
. . . . . . .
. . . . . . .
. . . . . . .
. . . . . . .
. . . . . . .
. . . . . . . . . . . . measures . . . . . . . . . . . . . . . . . . . . . . . . . . . . . .
. . . . . .
. . . . . .
. . . . . .
. . . . . .
. . . . . .
. . . . . .
. . . . . . .
. . . . . . . .
. . . . . .
. . . . . . .
. . . . . . . .
. . . . . .
. . . . . . .
. . . . . . . .
. . . . . .
. . . . . . .
. . . . . . . .
. . . . . .
. . . . . . .
. . . . . . . .
. . . . . .
. . . . . . .
. . . . . . . .
. . . . . .
. . . . . . .
. . . . . . . .
. . . . . .
. . . . . . .
. . . . . . . .
. . . . . .
. . . . . . .
. . . . . . . .
. . . . . .
. . . . . . .
. . . . . . . .
. . . . . .
. . . .
. . . .
. . . .
. . . .
. . . .
. . . .
. . . .
. . . .
. . . .
. . . .
. . . .
. . . .
. . . .
. . . .
. . . .
. . . .
. . . .
. . . .
80 81 83 85 87
12 Planning under Compliance Risk 12.1 Single-period Models . . . . . . . . . . . . . . . . 12.1.1 Worst-case . . . . . . . . . . . . . . . . . 12.1.2 Worst-case expectation . . . . . . . . . . 12.2 Multi-period Models . . . . . . . . . . . . . . . . 12.2.1 Non-adaptive decisions . . . . . . . . . . . 12.2.2 Stochastic Programming Model . . . . . . 12.2.3 Stochastic Dynamic Programming Model 12.3 Conclusions . . . . . . . . . . . . . . . . . . . . .
. . . . . . . .
. . . . . . . .
. . . . . . . .
. . . . . . . .
. . . . . . . .
. . . . . . . .
. . . . . . . .
. . . . . . . .
. . . . . . . .
. . . . . . . .
. . . . . . . .
. . . . . . . .
. . . . . . . .
. . . . . . . .
. . . . . . . .
. . . . . . . .
. . . . . . . .
90 91 91 93 94 94 95 96 97
. . . .
. . . .
. . . .
3
. . . .
. . . .
. . . .
. . . .
. . . .
13 Further Topics 13.1 State Augmentation . . . . . . . . . . . . . . . . . . . . . . . . . . . . . . . . .
4
99 99
1 Introduction 1.1 Model-based Planning This course is about Quantitative, model-based methods for robust planning and optimization Things to clarify 1. What is a planning? → What is a plan? 2. What is robustness? → What is a robust plan? 3. What are quantitative, model-based methods? → Model? → Methods? To clarify the concepts we are dealing with in this lecture, we give the following working definitions. Planning (in this course) Definition 1.1.1 (Planning). Process (procedure) to find (good) plans. Definition 1.1.2 (Plan). Collection of (related) decisions. Definition 1.1.3 (Decision). Choice of a particular alternative out of a given set of (mutually exclusive) alternatives. ... a future-oriented, generally systematic and rational process for solving decision problems, performed by decision makers, based on incomplete information and subjective goals. [Scholl 2001, p.9]
5
Model-based planning: the process
1.2 Focus and Contents The role of planning in management The classical management process 1. Planning 2. Organizing 3. Staffing 4. Directing 5. Controlling ’primacy of planning’ Critique This management concept is only adequate if • the environment’s causal relationships can be understood and its development predicted • the firm is entirely controllable so that plans can be implemented
6
Scope and focus Our scope within a general planning process We focus on • quantitative decision (optimization) models and the related • algorithmic solution methods but not on other relevant aspects (organizational, psychological) of the planning process or other planning methods. Relation to operations management We apply these methods to • typical, but stylized examples and • real-world case studies from operations management, but this is not a course on OM, nor on the role of planning in the management process. Relevant areas and techniques • Decision theory • Optimization techniques - Linear programming - (Mixed) integer programming - Stochastic programming - Robust optimization • Stochastic control - Stochastic dynamic programming - Markov decision processes • Operations management / industrial engineering - Applications to typical planning problems from OM / IE Motivation of this course Unified treatment of methods for decision making under uncertainty
7
Learning goals Knowledge in quantitative methods for model-based planning under uncertainty • Awareness of - the effects of uncertainty in the dynamics of a system, - the concept of a plan, and - the necessity to express preferences regarding uncertain outcomes • Ability to formally state decision problems under uncertainty • Knowledge of the fundamental solution techniques based on robust optimization and stochastic dynamic programming • Ability to apply the methods to practical planning problems from production and operations management. • Ability to understand relevant articles from academic journals - Management Science - Manufacturing and Service Operations Management - Production and Operations Management
1.3 Planning under Uncertainty As a first example for robust planning, we introduce the Warehouse Location Problem (WLP), a simultaneous location and transportation planning model. The problem is to choose a number of warehouses (binary variables xi ) and transportation quantities (continuous variables uij ) so that total costs are minimized and given customer demands dj are satisfied. Example: Capacitated Facility Location Problem Problem data • n possible locations with - capacities bi and - operating costs fi • m customers with demand dj • Transportation costs cij Task Decide location of warehouses minimizing the sum of • operating costs • transporation costs
8
Optimal plan π = (x, u)
0 0 1 30 π = ( , 0 0 1 0 | {z } | x
0 0 0 20
0 0 0 80
{z u
0 70 ) 0 0 }
Minimize g(x, u) =
n X
fi xi +
i=1
subject to
m X
uij ≤ bi xi
j=1 n X
m X n X
cij uij
j=1 i=1
i = 1, . . . , n
uij = dj
j = 1, . . . , m
xi ∈ {0, 1}
i = 1, . . . , n
i=1
uij ≥ 0 cij i=1 i=2 i=3 i=4 dj
j=1 5 1.2 1.5 2.2 30
j=2 3 4.1 2 4 20
j=3 4.5 3 6.4 1 80
j=4 1 1.7 1.9 4 70
fi 120 130 100 125
i = 1, . . . , n and j = 1, . . . , m bi 70 140 81 118
In the deterministic case, where all data is assumed to be known, this capacitated WLP can be formulated as the above Integer Linear Program (ILP). In the case of data uncertainty, different types of planning problems under uncertainty can be devised, as we will see during the course. Uncertainty can in principle affect any of the problem data, the warehouse fixed costs fi and capacities bi , the customer demands dj , or the transportation costs cij . Planning under Uncertainty The role of randomness — and how we will model it • Outcomes g(π, w) depend on chosen plan π and data w. • Data w might not be fully known when fixing plan π. • Thus, the data w is to be modeled as a realization w ∈ W ⊂ Rm of a random variable W : S −→ W defined on some underlying probability space (S, A, P) – We will mainly use discrete random variables with S = {1, 2, . . .} whose elements s are called scenarios or states of nature. – Interpretation: W (s) is the value of the data in scenario s. • Consequently, the outcome is also a random variable
Z(s) ≡ g(π, W (s))
• We need to find ways to compare outcome distributions to be able to evaluate and compare different plans.
9
Robustness Definition 1.3.1 (informal). Outcomes or properties of a plan not (significantly) affected by realization of uncertain (random) data (the states of nature). To define (when looking for robust plans) • Which outcomes or properties would we like to be robust? −→ Define attributes of interest • How to quantify ’not significantly affected’ ? −→ Define robustness measures (decision criteria) • Which uncertainties would we like to be robust against? −→ Define Uncertainty sets (scenarios) Robustness aspects Types of robustness [Scholl 2001] • Outcome robustness (absolute) - Feasibility robustness • Optimality robustness (relative to other plans) - Regrets • Information robustness - Sensitivity to probability distribution (stochastic information) • Plan(ning) robustness - Changes of decisions (e.g. in rolling horizon planning) • Valuation robustness - Sensitivity to choice of decision criteria (weights) In this course, we will mainly consider outcome robustness (with feasibility robustness as a special case) and optimality robustness. The role of time • In many situations, decisions are made in stages. - Here, stages are discrete time steps t = 0, 1, 2 . . . • A plan π can therefore be a sequence of decisions π = (u0 , u1 , . . . , uT ) • Planning horizon can be finite (T fixed) or infinite (T → ∞).
10
Flexible and adaptive planning • Uncertainty might also be revealed in stages: (Wt )t=0,1,...
random process
• Decisions at time t should take into account what has happened until then: ht = ((u0 , w0 ), (u1 , w1 ), . . . , (ut−1 , wt−1 ))
history
• An adaptive (flexible) plan can incorporate this information: π = (u0 (h0 ), u1 (h1 ), . . .) Temporal and logical interdependencies • Strategic (decisions with long-term impact) • Tactical (mid-term range, 6 month to two years) • Operational (days to weeks) • Real-time or on-line control Hierarchical (multi-level) planning • Data of planning problem are higher-level decisions. • The optimal higher-level decision should be made assuming implementation of an optimal plan of the lower level. • Simultaneous versus successive planning. • Essentially used in all three case studies. The longer the impact of a decision, the more important are robustness considerations, in general. While long ranging decisions are more of a ’one shot’ or ’one of a kind’ decisions, operational decisions are often repeated over and over so that deviations from the ’average behavior’ (bad scenarios) become less probable (law of large numbers). We will consider this in the chapter on infinite horizon problems. Nevertheless, operational decisions are often based on some kind of tactical plan (e.g., a train timetable), and it is often beneficial to consider such planning situations jointly in a hierarchical planning setup. In this case, robustness is primarily considered on the tactical level, for instance by introducing buffers to absorb disturbances on the operational level, or to devise a tactical plan that allows for easy recovery of disruptions on the operational level.
11
1.4 Examples and Organization Examples and case studies Examples Traditional operations management areas like • Production planning and control (PP&C) • Logistics • Inventory management Case studies Operations management in infrastructure networks • Robust train scheduling in highly utilized railway networks • Crane capacity allocation in container terminals • Resource management in power grids Motivation of case studies In liberalized infrastructure systems, the network operators have strong incentives for cost reduction → strive for efficiency (resource usage) But operating closer to capacity limits makes the system more vulnerable to disturbances. → focus on reliability (quality of service) Key trade-off: efficiency (resource usage) vs. reliability (quality of service) zug-zu-spaet Robust train scheduling Project with SBB Infrastructure (Bern) • Operation at stability margin → Delays propagate • Few available track slots → Hard to satisfy further increase in demand • Infrastructure extension? → difficult in cities → expensive Improvement through more sophisticated conflict-free and robust operations planning? -2ex Bottlenecks
12
• geographically: major hubs • service-related: integrated clock-face timetable Bienne 1000 1500
2500
Fribourg
1000
Berne
Weyermannshaus
2500
2500
4000 Grauholz
Neuchatel 2500
Wankdorfdreick
500
2500
500 3000
Belp
Thun
Results: Flexible timetable
Robust crane capacity allocation PSA-MSC Home Terminal, Antwerp • 2,900 m of quay length • 23 Ship-to-shore cranes • Throughput: 3.5 million containers in 2007
13
Olten
Robust Planning Task • Vessels have weekly periodic schedule and guaranteed service times [-2ex] • Delays and short-term schedule deviations common [-2ex] • Given arrival window in weekly period for every vessel [-2ex] → Determine min number of quay cranes needed to handle all vessels
Resource management in power grids Project with RWE Energy (Germany)
Random incidents Demand of resources
Grid operator
Resources / organization
Availability of resources
Restoration process
Regulator Quality standards
Cost
Optimal balance?
Quality of supply
Goal Find an organization (spatial/temporal availability) of resources that
14
1. guarantees required quality of supply and 2. minimizes costs.
15
2 Decision Theory Decision theory Systematic study of decision situations (choice of most preferable alternative from a given set) Normative decision theory - Prescriptive: how decisions should be made (based on certain assumptions/axioms that reasonable decisions should fulfill)
Descriptive decision theory - Empirical: how decisions are actually made... Kinds of decisions (that need a theory) • Decisions under uncertainty (here) • Decisions under multiple objectives
Decision under uncertainty: the set-up state of nature s ∈ S
W
data
Π3π
w = W (s) ∈ W
z = g(π, w) ∈ Z ⊆ Rm
g
plan
outcome
Decision under uncertainty: example and goal Π Set of plans (alternatives) S Set of “states of nature”
16
Z Set of possible outcomes (with preference relation ≤) g Mapping Π × S −→ Z, (π, s) 7→ y = g(π, s)
Example 2.0.1.
g(πi , sj ) π1 π2 π3 π4 π5
s1 8 4 6 8 4
s2 5 7 2 6 3
s3 3 5 6 4 8
s4 7 6 5 7 4
Which plan is most preferable? Goal: Determine a preference relation (ranking) � on set of plans Π. Note: a rational preference relation is assumed to be transitive and complete.
2.1 Stochastic Order Relations Stochastic dominance (zeroth-order) Definition 2.1.1 (State-wise dominance). Let π 0 �0 π
: ⇐⇒
g(π 0 , s) ≤ g(π, s) for all s ∈ S
A plan π is called (state-wise) dominated if there is some π 0 ∈ Π with π 0 �0 π and π 6�0 π 0 . Example 2.1.2. In the example, π4 is state-wise dominated by π1 : g(π, w) π1 π4
w1 8 8
w2 5 6
w3 3 4
w4 7 7
Decision under uncertainty: probability Probability space (S, F, P) state of nature s ∈ S S – sample space (elementary events) F – collection of subsets of S (events) P : F → [0, 1] – probability measure
W
data
Π3π plan
w = W (s) ∈ W
g
Finite case S = {s1 , s2 , . . . , sk } with probability mass function over S p(s) := P({s}) and probability mass function over W p(w) := P({s ∈ S | W (s) = w})
z = g(π, w) ∈ Z ⊆ Rm outcome
Random variable Zπ (s) :≡ g(π, W (s)) with (cumulative) distribution function Fπ (z) := P({s ∈ S | Zπ (s) ≤ z})
17
Decision under uncertainty: example Π Set of plans (alternatives) S Set of “states of nature” Z Set of possible outcomes (with preference relation ≤) g Mapping Π × S −→ Z, (π, s) 7→ y = g(π, s) p Mapping S −→ [0, 1] (probability mass function) g(πi , sj ) π1 π2 π3 π4 π5 p(sj )
Example 2.1.3.
s1 8 4 6 8 4 0.1
s2 5 7 2 6 3 0.2
s3 3 5 6 4 8 0.5
s4 7 6 5 7 4 0.2
Which plan is most preferable? Note: this definition of stochastic order relations assumes, without lack of generality, that smaller outcomes g(·, ·) are preferred (so that the order relations on the set of outcomes �Y is equivalent to the standard less-or-equal relation ≤). If larger outcomes are preferred (e.g., if outcome means profit or gains), then the order relations have to be re-defined accordingly. Stochastic dominance (first-order) Definition 2.1.4 (Stochastic dominance). Let π 0 �1 π : ⇐⇒ Zπ0 �1 Zπ ⇐⇒ P(Zπ0 ≤ z) ≥ P(Zπ ≤ z) ∀z ∈ Z A plan π is called stochastically dominated if there is π 0 ∈ Π with π 0 �1 π and π 6�1 π 0 . π1
Fπ (z)
π5
Example 2.1.5.
1
2
3
4
5
6
7
8
z
... although π5 is scenario-optimal for w4 ! Order extensions by performance measures • Obviously, �1 extends �0 since π �0 π 0 =⇒ π �1 π 0 . • But both are still only partial orders with more than one non-dominated alternative.
18
Question How can we derive a total order � on Π or their respective outcome random variables Ψ := {Zπ : π ∈ Π} Idea Find a function φ : Ψ −→ R (scalar performance measure) and define Z � Z0
if φ(Z) ≤ φ(Z 0 )
Interpretation: φ “compresses” each random variable (including its probability distribution) into a scalar “performance” value. Expected value as typical performance measure Definition The expected value of a discrete random variable Z : S → R with probability mass function p : S → [0, 1] is X E[Z] := p(s) · Z(s) s∈S
Example 2.1.6.
Zπ (s) = g(π, s) π1 π2 π3 π4 π5 p(sj )
s1 8 4 6 8 4 0.1
s2 5 7 2 6 3 0.2
s3 3 5 6 4 8 0.5
s4 7 6 5 7 4 0.2
E[Zπ ] 4.7 5.5 5.0 5.4 5.8
Variance as typical performance measure Definition The variance of a discrete random variable Zπ = S → R with probability mass function p : S → [0, 1] is X Var[Z] := p(s) · (Z(s) − E[Z])2 s∈S
Example 2.1.7.
Zπ (s) π1 π4 π6 p(sj )
s1 8 8 8 0.1
s2 5 6 8 0.2
s3 3 4 8 0.5
s4 7 7 8 0.2
E[Zπ ] 4.7 5.4 8
Var[Zπ ] 3.61 2.25 0
Caution! Can lead to irrational decisions.
2.2 Utility Functions Lotteries Assume a bounded outcome set Z = {z1 , z2 , . . . , zn }.
19
E[Zπ ] + Var[Zπ ] 8.31 7.65 8
Definition 2.2.1 (Lottery). A lottery is a probability distribution on the set of outcomes Z represented as an n-vector P = (p1 , p2 , . . . , pn )T with pi := p(zi ) ∈ [0, 1] and
n X
pi = 1
i=1
Example 2.2.2 (Plans as lotteries). The outcome distributions of the plans π1 , π2 , π3 , and π5 from the previous example can be represented as lotteries on Z = {2, 3, 4, 5, 6, 7, 8} Pπ 1 = Pπ 2 =
1 10 1 10
· (0, 5, 0, 2, 0, 2, 1)T
Pπ 3 =
· (0, 0, 1, 5, 2, 2, 0)T
Pπ 5 =
1 10 1 10
· (2, 0, 0, 2, 6, 0, 0)T · (0, 2, 2, 0, 0, 0, 5)T
Utility theory: assumptions A.1 There exists a complete and transitive relation � on the set of lotteries X P = {P ∈ [0, 1]n | pi = 1} i
A.2 If P1 ∼ P2 then for all α ∈ [0, 1] αP1 + (1 − α)P ∼ αP2 + (1 − α)P
∀P ∈ P
A.3 If P1 ≺ P2 then for all α ∈ (0, 1] αP1 + (1 − α)P ≺ αP2 + (1 − α)P
∀P ∈ P
A.4 If P1 ≺ P ≺ P2 then there exists α ∈ (0, 1) with P ∼ αP1 + (1 − α)P2 Existence of a unique utility function Expected Utility Theorem Under assumptions A.1 – A.4 there exists a function u : Z −→ R (called utility function) such that for all P, P 0 ∈ P n n X X 0 P �P ⇐⇒ pi u(zi ) ≤ p0i u(zi ) i=1
i=1
Furthermore, u is unique up to linear transformations. ConventionP Let u(P ) := ni=1 pi u(zi ) denote the utility of lottery P .
20
Pros and cons of utility functions The continuity assumption A.4 is the crucial point in utility theory Advantages: • Utility of any lottery (outcome distribution) is weighted sum (expectation) of utilities of individual outcomes. • A decision maker is called risk averse if E[u(Z)] ≥ u(E[Z])
disutility function is convex
Disadvantages: • Due to continuity, utility functions can in general not express - Decision criteria based on worst cases (fundamental for robust planning) - Lexicographic preference orderings (important when multiple decision criteria are used)
2.3 Performance Measures for Robustness Typical performance measures φ and corresponding decision rules Expected value: E[Z] Bayes rule: min E[Zπ ] π
Worst case: maxs g(π, s) Minimax rule: min max g(π, s) π
s
Best case: mins g(π, s) Minimin rule: min min g(π, s) π
s
Typical performance indicators φ and corresponding decision rules Linear combination of best and worst case h i Hurwicz rule: min λ min g(π, s) + (1 − λ) max g(π, s) s
π
s
Linear combination of average and worst case h i Hodges-Lehmann rule: min λ E[g(π, s)] + (1 − λ) max g(π, s) s
π
21
Regret-based indicators We can take into account that some states of nature might be more beneficial for us than others (focus on optimality robustness): Definition 2.3.1 (Regret). Let the regret Rπ0 of a plan π 0 be defined as the random variable Rπ0 = r(π 0 , s) := g(π 0 , s) − min g(π, s) π
Maximal regret: max r(π, s) s
Minimax regret or Savage-Niehans rule: min max r(π, s) π s h i Linear combination: min λ E[r(π, s)] + (1 − λ) max r(π, s) π
s
2.4 Simple Supply Risk Example A simple example for multiple sourcing Problem setting from [Berger 2006] • How many suppliers x to select? • Cost: - Linear operating cost: c(x) = a + bx - Financial loss L if all suppliers fail • States of nature: - Presence of ’mega-event’: probability p - Independent individual failure probabilities q Berger example in our notation • Set of plans Π = {1, 2, . . . , N }
(N : max number of suppliers)
• Set of states of nature S = {0, 1} × | {z } mega-event
{0, 1}N | {z }
individual failures
• Data W0 (s) = s0 W1 (s) =
N Y i X
denotes the presence of the mega-event sj
is the number of failed suppliers
i=1 j=1
with P(W0 (s) = 1) = q and P(W1 (s) ≤ w) = 1 − q w+1 [1ex] • Outcome ( 0 if w0 = 0 and w1 < x g(x, w) = a + bx + L else
22
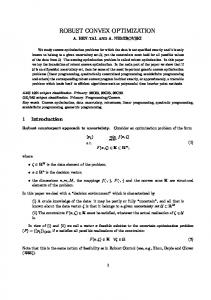
Berger example: analytical solution Goal Minimize the expected total cost E[g(x, w)]. Let f (x) = E[g(x, w)] = a + bx + L(p + (1 − p)q x ) 32 10 + 2*x + 20*(0.05+0.95*0.5**x)
30
28
26
24
22
20
18 0
2
4
6
Taking derivatives with respect to x gives f 0 (x) = b + L(1 − p)q x ln(q) and f 00 (x) = L(1 − p)q x ln2 (q) > 0 Thus the function f (x) is convex in x and its minimum is x∗ =
ln(−b/(L(1 − p)q x ln(q)) ln(q)
23
8
10
3 Stochastic and Robust Optimization 3.1 Terminology Optimization under uncertainty g Mapping Π × W −→ Z, (π, w) 7→ z = g(π, w) where Π is the set of plans (alternatives) W is the uncertainty set (image W (S) of the states of nature S) Z is the set of possible outcomes (Z ⊆ Rm ) Stochastic Programming min E[g0 (π, W )] subject to P[g(π, W ) ≤ 0] ≥ 1 − α π∈Π
Robust Optimization min max {g0 (π, w)} subject to g(π, w) ≤ 0 ∀w ∈ W π∈Π w∈W
Terminology Stochastic Programming expected cost
chance constraints
z }| { z }| { min E[g0 (π, W )] subject to P[g(π, W ) ≤ 0] ≥ 1 − α π∈Π
Robust Optimization guaranteed feasibility
worst-case cost
z }| { z }| { min max {g0 (π, w)} subject to g(π, w) ≤ 0 ∀w ∈ W π∈Π w∈W
The basic (historic) difference is that stochastic programming takes the actual probability distribution into account while robust optimization doesn’t. For our purposes, we will often formulate models that combine both features (e.g., by examining the trade-off of expected value versus worst-case).
24
Example 2: production program planning Production planning as a typical task in operations management Task Planning the production program of n products. π = (x1 , x2 , . . . , xn )T Problem data c with cj = profit contribution of product j b with bi = capacity of resource i A with aij = consumption of resource i per product j d with dj = maximal sales volume of product j
LP formulation
Max cT x s.t. A x ≤ b x ≤ d x ≥ 0
(or Minimize −cT x)
As in the WLP before, all problem data can in principle be subject to uncertainty at the time of planning (decision making). We introduce different example scenarios and their corresponding LP models. Example: scenarios Scenario 1 Max
10x1 + 5x2 4x1 + 5x2 ≤ 90
s.t.
x1 ≤ 18 x2 ≤ 16 x2
c(1) = (10, 5)T z ∗(1) = 198 x1
Scenario 2
25
Max
4x1 + 8x2
s.t.
4x1 + 4x2 ≤ 80 x1 ≤ 15 x2 ≤ 15
x2
c(2) = (4, 8)T z ∗(2) = 140
x1
x2 c(2) = (4, 8)T
c(1) = (10, 5)T
x1
3.2 Feasibility Robustness and Chance Constraints Feasibility robustness Robust feasibility If for each s ∈ S the set of feasible plans Πs := {π ∈ Π | g(π, W (s)) ≤ 0} is convex, then the set of robust feasible plans (feasible for all scenarios) \ ΠS := {π ∈ Π | g(π, W (s)) ≤ 0 ∀s ∈ S} = Πs s∈S
26
is convex as well. Example 3.2.1 (here W (s) = (A(s) , b(s) , c(s) , d(s) ) for scenario s). A(1) x − b(1) ≤ 0 , x − d(1) ≤ 0
A(2) x − b(2) ≤ 0 , x − d(2) ≤ 0
x ≥ 0
Feasibility robustness – relaxed Chance Constraints The set of plans that are feasible with probability at least 1 − α Πα := {π ∈ Π | P[g(π, W ) ≤ 0] ≥ 1 − α} is in general not convex! Reformulation using auxiliary variables (for Min cT x s.t. A(s) x − b(s) ≤ P (s) · y (s) ≤ s∈S p y (s) ∈ x ≥ Max s.t.
x2 (2)
c
= (4, 8)
T
50 % 50 % 0%
LP case) M · y (s) ∀s ∈ S α {0, 1} ∀s ∈ S 0
... 4x1 + 5x2 x1 x2 4x1 + 4x2 x1 x2 1 (1) 1 (2) y + y 2 2 y (1) , y (2)
≤ ≤ ≤ ≤ ≤ ≤ ≤ ∈
100 %
90 + M y (1) 18 + M y (1) 16 + M y (1) 80 + M y (2) 15 + M y (2) 15 + M y (2) α {0, 1}
c(1) = (10, 5)T 50 % x1
3.3 Outcome and Optimality Robustness Expected value as objective Linearity of expectation In stochastic LPs, due to linearity of expectation: E[cT x] = E[cT ]x
27
Example 3.3.1. Max E[cT ]x = 7x1 + 6.5x2 s.t. 4x1 + 5x2 x1 x2 4x1 + 4x2 x1 x2
≤ ≤ ≤ ≤ ≤ ≤
90 18 16 80 15 15
x2 c(2) = (4, 8)T
T
E[c(s) ] = (7, 6.5)T c(1) = (10, 5)T
x1
Worst case as objective Reformulation by lifting Introduction the auxiliary variable ν and formulating max s.t.
ν 4x1 + 8x2 10x1 + 5x2 4x1 + 5x2 4x1 + 4x2 x1 x2
≥ ≥ ≤ ≤ ≤ ≤
ν ν 90 80 15 15
leads to ν taking the largest value that can be guaranteed over all scenarios, and a corresponding worstcase optimal plan ∗ πWC = (x∗1 , x∗2 ) ∈ arg min max g0 (π, W (s)) π∈Π s∈S
where in this case g0 (π, W (s)) ≡ −c(s)T x.
28
x2
T
x2 = 2x1 c(2) = (4, 8)T
c(1) x 10x1 + 5x2 6x1 2x1
= = = =
T
c(2) x 4x1 + 8x2 3x2 x2
∗ zWC = 128.6
T
E[c(s) ] = (7, 6.5)T c(1) = (10, 5)T
x1
Maximum regret as objective Reformulation by lifting Introduction the auxiliary variable r and formulating min s.t.
r 4x1 + 8x2 + r 10x1 + 5x2 + r 4x1 + 5x2 4x1 + 4x2 x1 x2
≥ ≥ ≤ ≤ ≤ ≤
z ∗(1) z ∗(2) 90 80 15 15
(= 198) (= 140)
leads to r taking the smallest maximum regret over all scenarios, and a corresponding max-regret optimal ∗ plan πSN = (x∗1 , x∗2 ).
29
T
x2 c(2) = (4, 8)T
z ∗(1) − c(1) x 198 − 10x1 − 5x2 58 + 3x2 x2
T
z ∗(2) − c(2) x 140 − 4x1 − 8x2 6x1 − 58 + 2x2 3
= = = =
∗ zWC = 128.6
x2 = 2x1 −
58 3
r∗ = 32.5 T
E[c(s) ] = (7, 6.5)T c(1) = (10, 5)T
x1
Of course, if we knew which scenario will realize, we would just solve the corresponding LP. If we instead assume that both scenarios will occur, for example, with probability 1/2 then we could come up with the following robust planning formulation, in which we maximize the expected profit contribution subject to guaranteed feasibility (with respect to resource usage) and guaranteed bounds for the worst-case profit contribution as well as for the worst-case regret.
3.4 Parametric Analysis Parametric robust formulation
max
7x1 + 6.5x2 4x1 + 5x2 ≤ 90
s.t.
4x1 + 4x2 ≤ 80 x1 ≤ 15 x2 ≤ 15 10x1 + 5x2 ≥ ν 4x1 + 8x2 ≥ ν 10x1 + 5x2 ≥ 198 − r 4x1 + 8x2 ≥ 140 − r ν: given worst-case bound (outcome robustness parameter) r: given max-regret bound (optimality robustness parameter) Note: the scenario-optimal values of 198 and 140 are obtained by first solving the two scenario-dependent deterministic LPs introduced above.
30
When solving such a robust planning model one could of course simply fix the desired values for µ and r. Alternatively, one could leave these parameters open and use a solver for parametric LPs to automatically explore how the objective value (in our case the expected profit contribution) depends on the parameters. The solver will basically perform an automatic multi-dimensional sensitivity analysis to achieve this. Parametric linear programming When optimizing one performance indicator subject to a (chance) constraint for another performance indicator, their trade-offs can be analyzed via a parametric optimization formulation min cT x
z(r) :=
x
s.t. Gx ≤ b + Er ˆ ≤ ˆb Ar where • z(r) is the optimal value for given parameter vector r ∈ R` • the matrix E ∈ Rm·` expresses how the parameter(s) jointly affect the right-hand sides Parametric linear programs can be solved numerically in MATLAB with the Multi-Parametric Toolbox (MPT) from control.ee.ethz.ch/~mpt.
LP sensitivity: regions of optimality Checking sensitivity of optimal solution x with respect to parameter r. Gx ≤ b
| use slack variables
Gx + IxS = b � � x A =b xS
| A := (G|I)
AB x B + AN x N = b
| ·D := A−1 B
| B : optimal basis
| b = w + Er
xB + DAN xN = Db xB = D(w + Er) − DAN xN
This parameterized basic solution xB = Dw + DEr, xN = 0) remains primal and dual feasible (and thus optimal) as long as xB ≥ 0: =⇒
{r | (DE)r ≥ −Dw}
is region of optimality.
LP sensitivity: parametric solution and value • Optimal solution x as a function of parameter r: x(r) = Dw + (DE)r
31
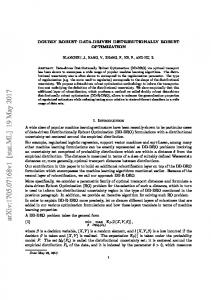
• Optimal value z(r) as a function of state r z(r) = cT x(r) = (cT Dw) + (cT DE)r • Valid in region R = {r : (DE)r ≥ −Dw} Subdivision of the parameter space into regions with same optimal basis (polyhedral partition). • Both x(r) and z(r) are continuous, and z(r) is convex. Trade-off results from parametric analysis 138 137 136 135 134
expected profit 133 132 131 130 129 128 0
20
40
60
80
guaranteed minimum profit (worst-case)
32
100
120
140
4 Risk Measures: Quantiles and CVaR 4.1 Risk Measures Risk measures • scalar performance measures used in mathematical finance • relevant for robust planning (capturing risk of bad outcomes) Definition 4.1.1 (Coherent risk measures). A coherent risk measure ρ is a function that maps random variables Z (outcomes) to real values with the following properties. Monotonicity: Z �0 Z =⇒ ρ(Z) ≤ ρ(Z 0 ) [1ex] 0
(not contradicting statewise dominance)
0
Subadditivity: ρ(Z + Z ) ≤ ρ(Z) + ρ(Z ) Positive Homogeneity: ∀λ ∈ R+ 0 Translation Invariance: ∀c ∈ R
(portfolio effect)
ρ(λZ) = λρ(Z)
(risk scales linearly)
ρ(Z + c) = ρ(Z) + c [1ex]
(addition of constant risk-free amount c)
4.2 Quantiles and Value-at-Risk Quantiles revisited Definition 4.2.1 (Quantiles). A value zβ ∈ R is called a β-quantile of a random variable Z if P[Z ≤ zβ ] ≥ β
and P[Z ≥ zβ ] ≥ 1 − β
The set of all β-quantiles of Z is denoted as Qβ [Z]. P[Z ≤ z]
P[Z = z] 0.5 0.3
0.2
Example 4.2.2.
2
3
4
z
2
3
4
z
Value-at-Risk and quantiles Value-at-Risk as a special quantile If a random variable Z denotes cost, its Value-at-Risk at level α is its smallest 1 − α quantile: VaRα [Z] = min Q1−α [Z]
33
P[Z ≤ z]
P[Z = z] 0.5 0.3
0.2
Example 4.2.3.
2
3
z
4
2
3
4
z
Incoherence of Value-at-Risk Properties of Value-at-Risk For the Value-at-Risk at any level α it holds 1. VaRα [Z] ≤ VaRα [Z 0 ] if Z �0 Z 0 (monotonicity) 2. VaRα (λZ) = λVaRα [Z] ∀λ ∈ R+ 0 (positive homogeneity) 3. VaRα (Z + c) = VaRα [Z] + c ∀c ∈ R (translation invariance) but it is not subadditive (not even convex)! Example 4.2.4 (VaR is not subadditive). Zπ1 Zπ2 Zπ1 + Zπ2 p(sj )
s1 8 4 12 0.1
s2 5 7 12 0.2
s3 3 5 8 0.5
s4 7 6 13 0.2
VaR0 8 7 13
VaR0.05 8 7 13
VaR0.15 7 7 13
VaR0.3 5 6 12
Quantiles as objectives Recall: Definition (Value-at-Risk) The Value-at-Risk (VaR) for a given parameter α is the worst of the best (1 − α) fraction of the outcomes (the lower 1 − α quantile), i.e. VaRα [Z(s)] := min{z ∈ R | P[Z(s) ≤ z] ≥ 1 − α} (assuming Z denotes costs or losses to be minimized). VaR objective: reformulation for LP case min ν (s) (s) subject to c x − M · y P (s) · y (s) s∈S p Ax y (s) x
34
≤ ≤ ≤ ∈ ≥
ν ∀s ∈ S α b {0, 1} ∀s ∈ S 0
Quantiles as objectives Recall: Definition (Value-at-Risk) The Value-at-Risk (VaR) for a given parameter α is the worst of the best (1 − α) fraction of the outcomes (the lower 1 − α quantile), i.e. VaRα [Z(s)] := min{z ∈ R | P[Z(s) ≤ z] ≥ 1 − α} (assuming Z denotes costs or losses to be minimized). VaR objective: reformulation for LP case (here max ν subject to c(s) x + M · y (s) ≥ P (s) · y (s) ≤ s∈S p Ax ≤ y (s) ∈ x ≥
maximization) ν ∀s ∈ S α b {0, 1} ∀s ∈ S 0
4.3 Conditional Value-at-Risk Conditional Value-at-Risk A typical coherent risk measure with desirable properties that can be seen as a generalization of expected value and worst case. Definition 4.3.1 (Conditional Value-at-Risk). For a random variable Z and α ∈ (0, 1], the conditional value-at-risk CVaRα [Z] is the average over the α · 100 percent worst outcomes. [1.5ex] Thus, if Z denotes costs, it can be defined as CVaRα [Z] :=
� 1 E[Z · 1Z≥zβ ] − zβ · (P[Z ≥ zβ ] − α) α {z } | correction term
where β = 1 − α and zβ is a β-quantile of Z, which is any value with P[Z ≤ zβ ] ≥ β
and P[Z ≥ zβ ] ≥ 1 − β = α
The correction term is necessary when P[Z ≥ zβ ] > α.
Conditional Value-at-Risk Definition 4.3.2 (Conditional Value-at-Risk). CVaRα [Z] :=
� 1 E[Z · 1Z≥zβ ] − zβ · (P[Z ≥ zβ ] − α) α | {z } correction term
Example 4.3.3 (CVaR: subadditivity holds). Zπ1 Zπ2 Zπ1 + Zπ2 p(sj )
s1 8 4 12 0.1
s2 5 7 12 0.2
s3 3 5 8 0.5
s4 7 6 13 0.2
VaR0.05 8 7 13
VaR0.3 5 6 12
CVaR0.3 7 13 6 23 12 23
E[Zπ2 · 1Z≥6 ] = 0.1 · 4 · 0 +0.2 · 7 · 1 +0.5 · 5 · 0 +0.2 · 6 · 1 +0.4 · 6
35
( 1 Note: the indicator function is defined as 1A (s) = 0
if s ∈ A else
Conditional Value-at-Risk Conditional Value-at-Risk: alternative representation 1 CVaRα [Z] := E[max{Z − zβ , 0}] + zβ α where zβ is a β-quantile of Z and β = 1 − α. LP formulation for given zβ 1 X (s) (s) p u + zβ α
min
s∈S (s)
s.t. u
(s)
u
≥ z (s) − zβ
∀s ∈ S
≥0
∀s ∈ S
This will ensure that u(s) = max{z (s) − zβ , 0}. Do we have to know a β-quantile zβ to compute the CVaRα ? Conditional Value-at-Risk Conditional Value-at-Risk: alternative representation 1 CVaRα [Z] := E[max{Z − zβ , 0}] + zβ α where zβ is a β-quantile of Z and β = 1 − α. LP formulation for treating zβ as a variable (primal and dual) min
1 X (s) (s) p u + zβ α s∈S (s)
s.t. u
+ zβ ≥ z (s)
∀s ∈ S
u(s) ≥ 0
∀s ∈ S
zβ ∈ R
max
X
y (s) z (s)
s∈S
p(s) ∀s ∈ S s.t. y (s) ≤ α X y (s) = 1 s∈S (s)
y
≥0
36
∀s ∈ S
Conditional Value-at-Risk: LP Example Conditional Value-at-Risk: alternative representation 1 CVaRα [Z] := E[max{Z − zβ , 0}] + zβ α where zβ is a β-quantile of Z and β = 1 − α. Example 4.3.4 (Production planning). 1 (0.5u(1) + 0.5u(2) ) + zβ α s.t. u(1) + zβ ≥ −10x1 − 5x2
min
x1 ≤ 15
u(2) + zβ ≥ −4x1 − 8x2
x2 ≤ 15
4x1 + 5x2 ≤ 90
u(1) , u(2) ≥ 0
4x1 + 4x2 ≤ 80
x1 , x2 ≥ 0
37
5 Recourse Models for Adaptive Planning 5.1 Motivation and Idea S Motivation Single-stage models Fixed here-and-now plan (decision). • Example: production and sales as one decision Problems: • Guaranteed feasibility (over all scenarios) can be quite restrictive. • Limited modeling power (degrees of freedom). Multi-stage models Allow to express dynamic and adaptive plans. • Example: separate production and sales decisions 1. First stage decision: production quantities 2. Second stage decision: sales quantities • Reaction to realization of uncertain data is called recourse. In the production planning example, we have modeles production and sales as one decision. Why not separate them? Overproduction should not be entirely infeasible, but has to be modeled (and priced) appropriately. Recourse model for production planning: idea Sequence of decisions and random events: 1. Produce x items
first-stage decision
2. Observe scenario s with demand W (s)
random event
3. Sell u(s)
second-stage decision
Example 5.1.1 (1 product, uncertain demand: newsvendor problem). Production cost c = 4, sales price p = 9, uncertainty set for demand W = {10, 20, 50} each with probability 1/3. 1 1 1 max −4x + 9 ( u(1) + u(2) + u(3) ) 3 3 3 s.t. u(s) ≤ x s = 1, 2, 3 u(s) ≤ W (s) x≥0
38
s = 1, 2, 3
Example: newsvendor recourse via the dual LP Primal two-stage LP max −4x +3u1 +3u2 +3u3 −x +u1 u1
s.t.
−x
≤0 ≤ 10
−x x,
≤0 ≤ 20
+u2 u2
+u3 ≤ 0 u3 ≤ 50 u1 ,
u3 ≥ 0
u2 ,
Primal optimal solution: • (x, u1 , u2 , u3 ) = (20, 10, 20, 20)
Dual LP min
10y1
s.t. y˜1
+20y2 +˜ y2
+50y3 +˜ y3
y˜1 + y1 y˜2 + y2 y˜3 + y3 y˜1 , y1 ,
y˜2 , y2 ,
≤4 ≥3 ≥3 ≥3
y˜3 , y3 ≥ 0
Dual optimal solution: • (˜ y1 , y˜2 , y˜3 ) = (0, 1, 3) • (y1 , y2 , y3 ) = (3, 2, 0) Objective value: 70
5.2 Structure and Classification S Two-stage problem: general structure Ax
=b
E (1) x +G(1) u(1) E (2) x +G(2) u(2) E (3) x +G(3) u(3) .. . E (S) x
= d(1) = d(2) = d(3) .. . +G(S) u(S)
= d(S)
Definition 5.2.1 (Random recourse). If G(s) , the effect of the recourse decision u(s) , is scenario-dependent, this is called a two-stage problem with random recourse.
39
Fixed recourse Ax
=b
E (1) x +Gu(1) E (2) x +Gu(2) E (3) x +Gu(3) .. . E (S) x
= d(1) = d(2) = d(3) .. . +Gu(S)
= d(S)
Definition 5.2.2 (Fixed recourse). If G(s) ≡ G (the effect of the recourse decision is fixed and does not depend on the scenario), this is called a fixed recourse model. Complete fixed recourse Ax
=b
E (1) x +Gu(1) E (2) x +Gu(2) (3) E x +Gu(3) .. . E (S) x
= d(1) = d(2) = d(3) .. . +Gu(S)
= d(S)
Definition 5.2.3 (Complete recourse). If any constraint violation can be compensated by recourse, i.e., {r | r = Gu, u ≥ 0} = Rm where m = dim(d) this is called a model with complete fixed recourse. Simple recourse Ax
=b
Ex +ˆ u(1) − u ˇ(1) Ex +ˆ u(2) − u ˇ(2) Ex +ˆ u(3) − u ˇ(3) .. .
= d(1) = d(2) = d(3) .. . +ˆ u(S) − u ˇ(S)
Ex
= d(S)
Definition 5.2.4 (Simple recourse). If a complete fixed recourse model simplifies further to � � u ˆ G = (I, −I) and u = u ˇ and recourse costs are linear in u then this is called simple recourse.
40
Relatively complete recourse Ax
=b
E (1) x +G(1) u(1) E (2) x +G(2) u(2) (3) E x +G(3) u(3) .. . E (S) x
= d(1) = d(2) = d(3) .. . +G(S) u(S)
= d(S)
Definition 5.2.5 (Relatively complete recourse). If there is a feasible recourse for any feasible x in every scenario, i.e., Ax = b =⇒ ∀s ∈ S ∃u ≥ 0 : G(s) u(s) = d(s) − E (s) x this is called a model with relatively complete recourse. The recourse function Ax E (1) x
=b
+G(1) u(1)
E (2) x E (3) x .. .
= d(1) = d(2) = d(3) .. .
+G(2) u(2) +G(3) u(3)
E (S) x
+G(S) u(S)
= d(S)
Recourse function Q(x; E (s) , G(s) , d(s) , q (s) ) := min q T (s) u(s) u (s) (s)
G
u
= d(s) − E (s) x
u(s) ≥ 0
5.3 Example S Production planning example Scenario 1 Max
10x1 + 5x2 4x1 + 5x2 ≤ 90
s.t.
x1 ≤ 18 x2 ≤ 16
41
x2
c(1) = (10, 5)T z ∗ (1) = 198 x1
Scenario 2 Max
4x1 + 8x2
s.t.
4x1 + 4x2 ≤ 80 x1 ≤ 15 x2 ≤ 15
x2
c(2) = (4, 8)T z ∗ (2) = 140
x1
x2 c(2) = (4, 8)T
Which constraint violations shall be compensated?
c(1) = (10, 5)T
x1
Recourse model for production planning example
42
max − c1 x1 − c2 x2 +
(10 + c1 ) (1) (5 + c2 ) (1) (4 + c1 ) (2) (8 + c2 ) (2) u1 + u2 + u1 + u2 2 2 2 2
s.t. 4x1 + 5x2 ≤ 90 4x1 + 4x2 ≤ 80
(1)
u1 ≤ x1 (1)
u2 ≤ x2 (1)
u1 ≤ 18 (1)
u2 ≤ 16
(2)
u1 ≤ x1 (2)
u2 ≤ x2 (2)
u1 ≤ 15 (2)
u2 ≤ 15
(s)
xj , uj ≥ 0 for all j = 1, 2 and s = 1, 2
5.4 Value of Flexibility and Information Rigid vs adaptive plans Let π = (u0 , u1 , . . . , uN −1 ) be a plan (sequence of decisions). • In a rigid plan, all decisions uk are fixed at initial time k = 0. • In a flexible (adaptive) plan, each decision uk can be adapted to the situation (known information) at time k. Definition 5.4.1 (Value of flexibility / adaptability). The value of flexibility with respect to some performance indicator φ is the improvement in φ of the best adaptive plan vs the best rigid plan.1
1
In [Ber, p.14] this is called value of information.
43
Value of the stochastic solution (VSS) Idea Compare stochastic (rigid or flexible) solution to a solution of the expected-value formulation πE ∈ arg minπ∈Π g(π, E[W (s)]) VSS := E[g(πE , W (s))] − min E[g(π, W (s))] π∈Π
Interpretation Amount that I would spend to develop a more complicated model • data estimation • solution procedure Important question in model building phase. Value of perfect information (VPI) Idea • Concept of a clairvoyant • Compare clairvoyant solution to stochastic solution VPI := min E[g(π, W (s))] − E[min g(π, W (s))] π
π
Interpretation Amount that I am willing to spend to ’see the cards’ (know the uncertain data) Important question in contract design and data collection.
44
6 Multi-Stage Stochastic Programming 6.1 Further Two-stage Examples 6.1.1 Capacitated Facility Location Problem Example: Capacitated Facility Location Problem Problem data • n possible locations with - capacities bi and - operating costs fi • m customers with demand dj • Transportation costs cij Task Decide location of warehouses minimizing the sum of • operating costs • transporation costs Optimal plan π = (x, u) 0 0 1 30 π = ( , 0 0 1 0 | {z } | x
0 0 0 20
0 0 0 80
{z u
0 70 ) 0 0 }
Minimize g(x, u) =
n X
fi xi +
i=1
subject to
m X
uij ≤ bi xi
j=1 n X
m X n X
cij uij
j=1 i=1
i = 1, . . . , n
uij ≥ dj
j = 1, . . . , m
xi ∈ {0, 1}
i = 1, . . . , n
i=1
uij ≥ 0 cij i=1 i=2 i=3 i=4 dj
j=1 5 1.2 1.5 2.2 30
j=2 3 4.1 2 4 20
j=3 4.5 3 6.4 1 80
j=4 1 1.7 1.9 4 70
fi 120 130 100 125
i = 1, . . . , n and j = 1, . . . , m bi 70 140 81 118
45
(s)
dj
s=1
s=2
s=3
s=4
60 80 50 30 220 0.1
40 30 50 70 190 0.2
30 20 80 70 200 0.4
80 30 50 30 190 0.3
customer j = 1 j=2 j=3 j=4 total demand probability p(s) x∗(1) x∗(2) x∗(3) x∗(4)
= (0, 1, 1, 0) = (1, 0, 1, 1) = (0, 1, 0, 1) = (0, 0, 1, 1)
663 585 570 553
Facility Location Problem: scenarios Demand scenarios and scenario-optimal solutions (first stage): Data taken from [Scholl 2001, p.188–185].
FLP: static robust model and solution
Minimize
subject to
n X i=1 m X
fi xi +
m X n X
cij uij
j=1 i=1
uij ≤ bi xi
i = 1, . . . , n
j=1 n X
(s)
uij ≥ dj
j = 1, . . . , m and ∀s ∈ S
i=1
xi ∈ {0, 1} i = 1, . . . , n uij ≥ 0
i = 1, . . . , n and j = 1, . . . , m
FLP: static robust solution compared Static robust solution totally outcome- and feasiblity-robust, but how about optimality robustness? FLP: two-stage adaptive robust model
46
(s)
dj
s=1
s=2
s=3
s=4
customer j = 1 j=2 j=3 j=4 total demand probability p(s)
60 80 50 30 220 0.1
40 30 50 70 190 0.2
30 20 80 70 200 0.4
80 30 50 30 190 0.3
x∗(1) = (0, 1, 1, 0) x∗(2) = (1, 0, 1, 1) x∗(3) = (0, 1, 0, 1) x∗(4) = (0, 0, 1, 1) x = (0, 1, 1, 1)
663
(s)
dj
customer j = 1 j=2 j=3 j=4 total demand probability p(s) x∗(1) = (0, 1, 1, 0) x∗(2) = (1, 0, 1, 1) x∗(3) = (0, 1, 0, 1) x∗(4) = (0, 0, 1, 1) x = (0, 1, 1, 1)
Minimize
585 570 819
819
819
553 819
s=1
s=2
s=3
s=4
60 80 50 30 220 0.1
40 30 50 70 190 0.2
30 20 80 70 200 0.4
80 30 50 30 190 0.3
663 716 749 infeas 688
611 585 592 594 632
673 580 570 infeas 630
591 625 572 553 612
n X
fi xi + r
i=1
r ≥ z (s)
subject to n m X X
∀s ∈ S
(s)
∀s ∈ S
(s)
i = 1, . . . , n and ∀s ∈ S
cij uij = z (s)
j=1 i=1 m X j=1 n X
uij ≤ bi xi (s)
(s)
uij ≥ dj
j = 1, . . . , m and ∀s ∈ S
i=1
xi ∈ {0, 1} (s) uij
≥0
i = 1, . . . , n i = 1, . . . , n and j = 1, . . . , m and ∀s ∈ S
FLP: adaptive robust solution compared
47
(s)
dj
customer j = 1 j=2 j=3 j=4 total demand probability p(s) x∗(1) = (0, 1, 1, 0) x∗(2) = (1, 0, 1, 1) x∗(3) = (0, 1, 0, 1) x∗(4) = (0, 0, 1, 1) x = (0, 1, 1, 1)
s=1
s=2
s=3
s=4
60 80 50 30 220 0.1
40 30 50 70 190 0.2
30 20 80 70 200 0.4
80 30 50 30 190 0.3
663 716 749 infeas 688
611 585 592 594 632
673 580 570 infeas 630
591 625 572 553 612
E[Z]
635 608 592 629
FLP: two-stage adaptive model, expected cost Minimize
n X
fi xi +
i=1
subject to
X
p(s) z (s)
s∈S
m X n X
(s)
∀s ∈ S
(s)
i = 1, . . . , n and ∀s ∈ S
cij uij = z (s)
j=1 i=1 m X j=1 n X
uij ≤ bi xi (s)
(s)
uij ≥ dj
j = 1, . . . , m and ∀s ∈ S
i=1
xi ∈ {0, 1} (s) uij
≥0
i = 1, . . . , n i = 1, . . . , n and j = 1, . . . , m and ∀s ∈ S
FLP: adaptive robust solution compared FLP: two-stage model with incomplete recourse
48
Minimize
n X
fi xi +
i=1
subject to
n X
X
p(s) z (s)
s∈S
hi vi(s) +
i=1
m X
(s) cij uij = z (s)
∀s ∈ S
j=1 m X j=1 n X
(s)
(s)
uij ≤ bi xi + vi (s)
(s)
uij ≥ dj
i = 1, . . . , n and ∀s ∈ S
j = 1, . . . , m and ∀s ∈ S
i=1
xi ∈ {0, 1}
i = 1, . . . , n
(s) uij
≥0
∀i, j and ∀s ∈ S
(s)
≥0
i = 1, . . . , n and ∀s ∈ S
M i x i ≥ vi
6.2 Three-Stage Models and Scenario Trees 6.2.1 Three-Stage WLP Three-stage example for the FLP Sequence of decisions and random events 1. Decide facilities xi
first-stage decision (s )
2. Observe transportation costs cij 1
random event
(s1 )
3. Decide facility capacities vi
second-stage decision
(s1 ,s2 )
random event
(s ,s2 )
third-stage decision
4. Observe demands dj
5. Decide shipments uij 1 FLP: three-stage model
49
Minimize
n X
fi xi +
i=1
subject to
n X
X
p(s1 ,s2 ) z (s1 ,s2 )
s∈S
hi vi(s1 ) +
i=1
m X
(s ) (s ,s2 )
cij 1 uij 1
= z (s1 ,s2 )
∀s = (s1 , s2 ) ∈ S
j=1 m X j=1 n X
(s ,s2 )
≤ bi x i + v i
(s ,s2 )
≥ dj
uij 1 uij 1
(s1 )
(s1 ,s2 )
∀i and ∀s ∈ S
∀j = 1 and ∀s ∈ S
i=1
xi ∈ {0, 1} (s ) M i x i ≥ vi 1 (s ,s ) uij 1 2
∀i
≥0
∀i and ∀s1 ∈ S1
≥0
∀i, j and ∀s ∈ S
6.2.2 Scenario Tree Formulation General multi-stage stochastic LP
Minimize
T X
! ct xt
t=1
subject to
A1 x1 = b1 t−1 X
Brt xr + At xt = bt ∀t ∈ {2, 3, . . . , T }
r=1
xt ≥ 0 ∀t ∈ {2, 3, . . . , T } Brt : (random) effect of decision xr on the feasible set for choosing decision xt . Multi-stage LP based on a scenario tree
Minimize
X
pv cv xv
v∈V
subject to
X
Brv xr + Av xv = bv ∀v ∈ V
r ∈ pred(v)
xv ≥ 0 ∀v ∈ V V : nodes of the scenario tree pv : probability to reach node v ∈ V pred(v) : set of nodes from which v is reachable
50
7 Stochastic Dynamic Programming 7.1 Stochastic Decision Trees 7.1.1 Project Management Example Example: project management Decision situation: sequence of building project offers. Stage 1 • Project A is offered, yields a revenue of 40 Stage 2 • If A accepted, then offered B (0.6), b (0.4); else B (0.3), b (0.4) - Capacity investment: 70 (AB), 30 (Ab), 50 (B), 25 (b) - Revenues: B (200), b (120) • C is offered, revenue 35 (only possible with A or b alone) • Nonperformance penalty for missed deadline: B (50), b (30) - Probabilities: 0.4 (AB), 0.2 (Ab), 0.2 (B), 0.1 (bC) Question: should project A be accepted in stage 1? Stochastic decision trees Representation of the decision situation as a graph (tree): • Each path is an alternating sequence of decision nodes (squares) and stochastic nodes (circles) – outgoing arcs from decision nodes: decisions – outgoing arcs from stochastic nodes: possible future states Things to think about • What is a plan? - and how can it be specified? • How many different plans are there? • What is the outcome of a plan?
51
Outcome distribution for different plans Any given plan π gives rise to a probability distribution on the paths through the decision tree. Example (construction project management) Consider the plan of accepting A, and then B regardless of its size (and thus not doing C at all). [1ex] The resulting total profit Z is a random variable with distribution 0.6 · 0.6 = 0.36 for z = 40 − 70 + 200 = 170, 0.6 · 0.4 = 0.24 for z = 40 − 70 − 50 = −80, P[Zπ = z] = 0.4 · 0.8 = 0.32 for z = 40 − 30 + 120 = 130, 0.4 · 0.2 = 0.08 for z = 40 − 30 − 30 = −20. Is this a rigid or a flexible plan? Is it optimal? Computing an optimal plan For certain performance indicators (expected value, worst case), an optimal adaptive plan can be computed recursively by the roll-back scheme by iterating the steps 1. Annotate stochastic nodes with conditional cost-to-go (or reward-to-go). 2. Find optimal decision in decision nodes from the leaves backwards to the root. Example 7.1.1 (Construction project management). Optimal plan is a flexible (adaptive) plan! • Decision on C is deferred • If large B is offered then C is refused. 100 35 large B
45
0.6
accept B do o -7 nl0y C 0
35
1 35 90
0.4
A
pt
e acc
60 small b
40
accept b do o -3 nl0y C
0.6 0.4 200 -50
35
0.8 0.2 120 -30 1 35
0
86.5
OK missed OK OK missed OK
start
150
no t
100
ac ce
large B
pt
accept B do o -5 nl0y C
35
0
A
120
0.3 86.5
115 0.4
small b
0.3
b accept accept b-2an 140 5 d do C do -2 on5l y C 35 0
35 none
35 do only C 0
52
0.8 0.2 200 -50 1 35 1 120
0.9 0.1 155 5 1 35 1 35
OK missed OK OK OK missed OK OK
7.2 Generl State-based Model 7.2.1 Concept and Notation The general state-based model Idea All information that is relevant for the future (evolution of the system and decisions) is compressed in a state variable xt (t is the time index) that evolves according to xt+1 = ft (xt , ut , wt ) Ingredients • State transition function ft (xt , ut , wt ) where – xt ∈ Xt the set of feasible states – ut ∈ Ut (xt ), the set of feasible actions (decisions) – wt ∈ Wt is a realization of a random variable Wt with given conditional distribution P(Wt = w | xt , ut ) • Cost function gt (xt , ut , wt ) called stage cost or immediate cost
7.2.2 Example: Inventory Management Example: inventory control Example 1.1.1 from [Bertsekas 2005] • xt — stock at beginning of period t • ut — stock ordered (and delivered) at beginning of period t • wt — demand during the t-th period • State transition: xt+1 = xt + ut − wt • Cost: gt (xt , ut , wt ) = f (ut ) + r(xt + ut − wt ) where ( K + cu u > 0 f (u) = 0 u=0 ( −b˜ x x ˜ αt+1 }E[w | w > αt+1 ]) = 1+r =: F (αt+1 )
αt =
Fixed point iteration: sequence is bounded, and since αt ≥ αt+1 also monotonous. Stopping problems: further remarks • Famous example: The Secretary Problem (or the Sultan’s Dowry Problem): maximize probability to stop with the best offer. • Threshold policy also optimal in case of price correlations.
8.4 Summary Stochastic dynamic programming: how to use it? Numerical solution (beware: curse of dimensionality) • Explicit enumeration of all states - if number of states is finite (example: bus tickets), or - if state space can be sensibly discretized (example: inventory) • Parametric respresentation of value function - via parametric LPs (if dynamics, constraints and costs are linear) - as linear combination of a set of basis functions Analytic solution • Using DP algorithm to prove properties of the optimal policy or the value function - convexity: base-stock policies are optimal for the single-warehouse inventory control problem with linear order cost - K-convexity: (S, s) policies are optimal for the single-warehouse inventory control problem with fixed order cost
65
9 Infinite Horizon Problems 9.1 Introduction Infinite horizon problems Assumptions • Number of stages is infinite (T → ∞) - Never satisfied in practice, but a good approximation for large T . • System is stationary (transition and cost function, uncertainties) - Sometimes satisfied in practice, often reasonable approximation. Quantity of interest: limit of the expected total cost "T −1 # X Jπ (x0 ) = lim E g(xt , µ(xt ), wt ) , π = (µ, µ, . . .) stationary T →∞
t=0
First question: Does this limit exist? Convergence of limit cost (value function) Options (assuming costs per stage are bounded): [1ex] 1. Discounting Jπ (x0 ) = lim E T →∞
where α =
1 1+r
"T −1 X
# αt g(xt , µ(xt ), wt )
t=0
< 1 is the discount factor and r the interest rate [2ex]
2. Taking the time average (average cost per stage) "T −1 # X 1 Jπ (x0 ) = lim E g(xt , µ(xt ), wt ) T →∞ T t=0
9.2 Discounted Cost Problems Value iteration For infinite horizon problems, the DP iteration1 Ji+1 (x) = D[Ji (x)] := min E [g(x, u, w) + α · Ji (f (x, u, w))] u∈U (x)
1
By convention, the time index is reversed (i := T − t), and J0 (·) ≡ 0.
66
is called value iteration. Theorem (Convergence of value iteration) If the number of states and decisions is finite (also called a controlled Markov chain), the sequence of value functions converges to the optimal costs J ∗ (x) = lim Ji (x) i→∞
(but not necessarily in a infinite number of steps). Limit case of DP: Bellman’s Equation Theorem The optimal costs J ∗ satisfy the Bellman equation J ∗ (x) = min E [g(x, u, w) + α · J ∗ (f (x, u, w))] u∈U (x)
for all states x ∈ X . In other words, the limit costs are a fixed point of the DP iteration J ∗ (·) ≡ D[J ∗ (·)] and typical fixed-point theorems apply (contraction mapping). Policy evaluation (no optimization) • As a special case of Bellman’s equation, the costs for any given stationary policy π = (µ, µ, . . .) have to satisfy Jπ (x) = E [g(x, u, w) + α · Jπ (f (x, µ(x), w))] for all x ∈ X [3ex] • Jπ (x) is the limit of the DP iteration “without optimization” Ji+1 (x) := E [g(x, u, w) + α · Ji (f (x, µ(x), w))] Policy iteration Determining the sequence µi+1 (x) := arg min E [g(x, u, w) + α · Jπi (f (x, u, w))] u∈U (x)
is called policy iteration and generates an improving sequence of policies, terminating with an optimal policy, in a finite number of iterations2 of the following steps: 1. Policy evaluation to determine the value Jπi of the current policy πi = (µi , µi , . . .) 2. Policy improvement to find an improved policy µi+1 as the minimizer of the DP step. 2
Reason: there are only a finite number of policies
67
9.3 Average Cost per Stage Problems Average cost Theorem For each policy π that results in a Markov chain with only one recurrence class (called a unichain policy), the limit average cost "T −1 # X 1 Jπ (x0 ) = lim E g(xt , µ(xt ), wt ) T →∞ T t=0
is a constant λ∗ , independent of the initial state x0 . Reason: The sum of costs until a given recurrent reference state is reached for the first time is finite, thus their average (when dividing by T ) goes to zero. Bellman’s equation for average cost Theorem (Bellman’s equation) Let λ∗ be the optimal average cost. [2ex] Then there is a differential cost vector h∗ (x) such that λ∗ + h∗ (x) = min E [g(x, u, w) + h∗ (f (x, u, w))] u∈U (x)
for all x. [2ex] If µ(x) attains the minimizer in the above equation for all x, then the stationary policy (µ, µ, . . .) is optimal. [2ex] Conversely, if a scalar λ together with some vector h satisfy Bellman’s equation, then λ is the optimal cost. Policy evaluation The policy evaluation step can be carried out by solving Bellman’s equations, when all decisions are restricted to the policy π at hand. Policy evaluation using Bellman’s equation For any stationary policy π = (µ, µ, . . .) there exists a scalar λµ and values hµ (x) so that λµ + hµ (x) = E [g(x, µ(x), w) + hµ (f (x, µ(x), w))] for all states x. For the case of finitely many states, this is just a system of linear equations. Policy improvement step Policy improvement using current differential cost function hµ : Policy improvement The policy improvement step now consists of finding an improved action µ0 (x) for each state x by solving µ0 (x) ∈ arg min E [g(x, u, w) + hµ (f (x, u, w))] u∈U (x)
68
Summary: infinite horizon problems Performance measures 1. Total discounted cost 2. Average cost per stage
Solution techniques 1. Value iteration 2. Policy iteration 3. LP formulation (not covered here)
69
10 Robust Project Planning 10.1 Project Planning and Event-Activity Networks Program Evaluation and Review Technique PERT chart for a project with [1ex]
(PERT)
• five events (milestones) and • six activities. Program Evaluation and Review Technique
(PERT)
• Method to analyze the involved tasks in completing a project - their dependencies (precedence structure) - the minimum time needed to complete the total project 2
1
4 b 3 a
3 c 2 e
3
1
2
5
d
f 4
Purpose and properties • developed to simplify planning and scheduling of large projects • able to incorporate uncertainty • time (rather than cost or other resources) is the major factor
2 3d
ays
4d
b
2 days
3
5
e 1
da ys
a
da y
d
2
1
3 days
ays
c
f
4
70
Different names for same approach • Program Evaluation and Review Technique (PERT) – Booz Allen Hamilton / US Navy 1957 - Polaris project • Critical path method (CPM) – DuPont / Remington Rand 1950s - Maintenance planning of chemical plants • Metra potential method (MPM) – Roy 1958 - Cruiseship France and first French nuclear power plant Typical software • Microsoft Project (first DOS version in 1984) • SAP RPM (Resource and Portfolio Management) • Oracle Project Portfolio Management
Event-activity networks Definition An event-activity network is a weighted directed acyclic graph N = (E, A, `) where • E is the set of events • A ⊆ E × E is the set of activities • ` : A → R+ 0 is the arc weight function denoting the duration for each activity 2
1
4 b 3 a
3 c 2 e
3
1
2
5
d
f 4
Note: Event-activity networks usually have • a unique start event (minimum node) labeled 1 and • a unique end event (maximum node) labeled |E|.
71
Event schedule Definition An event schedule is the assignment of event times xi to each event i of an event-activity network (E, A, `). [2ex] An event schedule is feasible if xj ≥ xi + `(i,j) for all activities (i, j) ∈ A. 2
1
4 b 3 a
3 c 2 e
3
1
2
5
d
f 4
Event scheduling problem Definition An event scheduling problem is the task to find a feasible event schedule that minimizes the makespan: Minimize
x|E| − x1
s.t.
xj ≥ xi + `(i,j)
∀(i, j) ∈ A
xi ∈ R
∀i ∈ E
4 2
4
3
1
3
3
3
7
2
1
4
5
2
0
4
Observation (critical path) The minimum makespan is equal to the longest path in the event-activity network.
10.2 Robust Project Scheduling Event scheduling with uncertain durations Assume the durations are stochastic, given as joint random variables (s)
`ij
for each activity (i, j) ∈ A
where s ∈ S denotes the scenario. Robust single-stage event schduling problem
72
Minimize
x|E| − x1
s.t.
xj ≥ xi + `ij
∀(i, j) ∈ A, ∀s ∈ S
xi ∈ R
∀i ∈ E
(s)
(s)
Since the S constraints involving `ij can be replaced by a single constraint using `max = ij (s)
maxs∈S {`ij }, this approach is very conservative. Event scheduling with uncertain durations Assume the durations are stochastic, given as joint random variables (s)
`ij
for each activity (i, j) ∈ A
where s ∈ S denotes the scenario. PERT deterministic formulation Use `PERT := ij
ML max `min ij + 4 · `ij + `ij 6
as deterministic durations. Probability of infeasibility cannot directly be controlled. Relaxed feasibility with joint chance constraints Assume the durations are stochastic, given as joint random variables (s)
`ij
for each activity (i, j) ∈ A
where s ∈ S denotes the scenario. Single-stage event schduling problem with chance constraints Minimize
x|E| − x1
s.t.
xj ≥ xi + `ij − M y (s) X y (s) ≤ α · S
(s)
∀(i, j) ∈ A, ∀s ∈ S
s∈S
xi ∈ R
∀i ∈ E
y (s) ∈ {0, 1}
∀s ∈ S
Simple recourse model with delay costs Event schduling problem with simple recourse
73
! x|E| − x1 +
Minimize
X
p(s)
s∈S
s.t.
xj +
(s) uj
≥ xi +
X
(s) ci ui
i∈E (s) + `ij
(s) ui
∀(i, j) ∈ A, ∀s ∈ S
xi ∈ R (s)
ui
∀i ∈ E
≥0
∀i ∈ E, ∀s ∈ S
where (s)
• ui
is the delay of event i in scenario s.
• ci is the unit delay cost of event i.
10.3 Time-Cost Tradeoff Problem Deterministic time-cost tradeoff problem Linear time-cost tradeoff problem (LTCTP) X dij vij Minimize x|E| − x1 + (i,j)∈A
s.t.
xj ≥ xi + `ij (1 − vij )
∀(i, j) ∈ A
xi ∈ R
∀i ∈ E
0 ≤ vij ≤ v¯ij
∀(i, j) ∈ A
where • vij is the relative acceleration of activity ij • dij is the cost of acceleration Two-stage model with acceleration and delay Two-stage event schduling problem with acceleration and delay X X (s) X (s) � Minimize x|E| − x1 + p(s) ( ci ui + dij vij ) s∈S
s.t.
xj +
(s) uj
≥ xi +
i∈E (s) ui
+
(s) `ij (1
ij∈A
−
(s) vij )
xi ∈ R 0≤
(s) vij
(s)
≥0
ui
∀i ≤ v¯ij
∀(i, j), ∀s ∀i, ∀s
where (s)
• vij is the acceleration of activity ij in scenario s at cost dij (s)
• ui
∀(i, j), ∀s
is the delay of event i in scenario s at cost ci
74
Observations for a numerical study [Scholl 2001] Solution quality (optimality and outcome robustness) • Recourse models lead to more robust plans than plans obtained with deterministic models • Deterministic models with worst-case data (equivalent to robust single-stage model) far too pessimistic • Chance-constraint models not as good, because they don’t measure the extent of constraint violation Model complexity • Deterministic and single-stage models fastest to solve • Recourse models grow with the number of scenarios, but even already few representative scenarios can lead to good solutions • Models involving chance constraints hard to solve due to additional binary variables
10.4 Robust Railway Scheduling Train scheduling in highly utilized rail networks Project with SBB Infrastructure (Bern), PhD G.Caimi, M.Fuchsberger • Operation at stability margin → Delays propagate • Few available track slots → Hard to satisfy further increase in demand • Infrastructure extension? → difficult in cities → expensive Improvement through more sophisticated conflict-free and robust operations planning? Bottlenecks • geographically: major hubs • service-related: integrated clock-face timetable Bienne 1000 1500
2500 2500 Fribourg
2500
2500
1000
Berne 2500 Belp
4000 Grauholz
Neuchatel
Weyermannshaus
Olten
Wankdorfdreick
500 500 3000 Thun
75
10.4.1 Operations Planning for Railways The task of the railway infrastructure manager From the service intention to the production plan
Train scheduling
Service Intention
Train Schedule
• Specification of product • Relevant for customers • Interface to train operating companies (external) • Production plan • Relevant for operations • Frame for the operational processes (internal) Macroscopic model
Macroscopic Scheduling (“Timetabling”) Find passing times at critical locations under • commercial requirements (connections) • simplified dynamics (constant speed) and safety model (headway)
76
10.4.2 Periodic Event Scheduling Problem Macroscopic scheduling model Constraints from the service intention
i
(`ij , uij )
j
Periodic Event Scheduling Problem (PESP) Find feasible periodic event times ti for all events i `ij ≤
[tj − ti ]T | {z }
≤ uij
time difference modulo T
Model: a mixed-integer linear program (MIP)
T : period length (60 min) Serafini & Ukovich 1989, Schrijver & Steenbeck 1994
Flexible event scheduling: model Idea Targeted placement of time reserves: time windows [ti , ti + δi ] j
t ime
i
`ij ≤ [tj − ti ]T ≤ uij becomes `ij + δi ≤ [tj − ti ]T ≤ uij − δj
Flexible event scheduling: result
77
Zeit
Flexible periodic schedule
Periodic schedule
Goldau
Erstfeld
Goldau
Erstfeld
Flexible schedule Z¨ urich – Bern 60
EC7 EC7
S
EC7 IC731 E
45
IC91 IC830 S
IC91 EC7
N
ICN530 E CIS44 S
IC830 N IC978 N
S
N
IC830 N
CIS44 S
S
N
ICN2127 W
IC2526 E IC577 S
IC91 IC731 W
N
IC577 N
IC731 E
IC91
S
EC7
S
ICN530 E IC1078 N
ICN530 W
IC830 N ICN530 E
30 IC577 N
EC7
N
IC91
N
IC731 W IC731 W
ICN530 W
IC731 E
IC830 N ICN2127 W IC830 S
ICN2127 E
IC731 W
IC577 S
15
CIS44 N
IC731 E
ICN2127 W IC731 W
ICN530 E
ICN530 W
IC830 S IC830 N IC978 S IC978 N IC2526 W
IC978 S
ICN2127 E
ICN530 W
IC1078 S
IC830 S IC1078 S
ICN2127 W
IC1078 N
IC577 S IC830 S
0 ZUE
IC91
S LB
CIS44 N IC577 N
ICN2127 E
EC117 ICN2127 E
AA
DU
OL
Price of robustness: flexibility vs. travel time
78
IC731 E BN
Efficient frontier for central Switzerland scenario 400
350
300
Flexibility
250
200 POSTOPT 150 POSTOPT 48 trains per hour 50 trains, flexibility everywhere 50 trains, flex only in LZ-GD-ZUG
100
50
0 1900
POSTOPT
1950
2000
2050
2100
2150 Trip time
2200
2250
2300
2350
2400
Lower bound: “inherent” flexibility Upper bound: maximize flexibility by replanning the events
79
11 Scheduling in Container Terminals Operation of transportation systems: trade-offs Transportation network operators have strong incentives for cost reduction: • strive for efficiency (resource usage) But operating closer to capacity limits makes the system more vulnerable to disturbances: • focus on reliability (quality of service) Key trade-off: efficiency (resource usage) vs. reliability (quality of service) Example: Robust scheduling and crane PSA-MSC Home Terminal, Antwerp [3ex] allocation • 2,900 m of quay length [-2ex] • 23 Ship-to-shore cranes [-2ex] • Throughput: 3.5 million containers in 2007
Robust planning task
80
• Vessels have weekly periodic schedule and guaranteed service times [-2ex] • Delays and short-term schedule deviations common [-2ex] • Given contractual arrival window in weekly period for every vessel [-2ex] → Handle all vessels with the minimum the number of quay cranes
11.1 A Robust Capacity Allocation Model Crane capacity allocation: nominal model Given (for each vessel v) Arrival time av ∈ {1, . . . , T } Service time σv Load λv Decision variables Allocated crane capacity xtv ≤ ρv for all v and t ∈ {av , . . . , av + σv − 1} Minimize installed crane capacity c such that allocated capacity doesn’t exceed installed capacity X xtv ≤ c for all t ∈ {1, . . . , T } v
and each vessel is served before its deadline [av +σv −1]T
X
xtv ≥ λv
for all v
t=av
Crane capacity allocation: robust model Given (for each vessel v) Arrival time av , max delay Uv Service time σv Load λv Decision variables Allocated crane capacity xtv ≤ ρv for all v and t ∈ {av , . . . , av + Uv + σv − 1} Minimize installed crane capacity c such that allocated capacity doesn’t exceed installed capacity X xtv ≤ c for all t ∈ {1, . . . , T } v
and each vessel is served before its deadline [α+σv −1]T
X
xtv ≥ λv
for all v and α ∈ {av , . . . , av + Uv }
t=α
81
Upper-level price (and value) of robustness Upper-level problem Find “optimal” arrival times (within some bounds). Capacity needed for increasing delays
Dashed: Arrival plan • optimized with nominal model • evaluated with robust model for increasing Uv . Solid: Arrival plan • optimized with robust model using Uv = 4. • evaluated with robust model for increasing Uv .
time time solution time Nominal vs robust solution vs adaptive λv /ρv
1 2 3 4 5 0 3 3
7 7
0 0 3 3 4 c=7
1 2 3 4 5 6/4
14/8
10/4
1 2 3 4 5
0 4 2 4 2 0
1 1 4
6 8 8 6 6 8 8 6
7 7
4 2 0 0 4
4 0 0 2 4
c = 10
c=8
82
Non-reachable States
Terminal State
k
k+1
k+2
k+3
11.2 A Markov Decision Process Model A periodic Markov Decision Process • State vector x expresses configuration of container terminal at a given time: – berthed and waiting vessels – loading operation progress of vessels – elapsed processing time of vessels – global time counter k ∈ {1, . . . , T } • Control actions u(x) are the allocated cranes capacities. • Transitions between states depend on u and have a given transition probability (e.g. due to uncertain vessel arrivals): P(u)
(periodic transition probability matrix)
• Immediate costs g(x, u). State space enumeration and reduction • Constraints lead to infeasible states in Markov Decision Process 1. Available resources: total installed crane capacity, quay length 2. Maximum cranes per vessel at a time step 3. Vessel service time agreements • Iterative reduction by deleting invalid states and control actions (result is the set of feasible states and policies) Restriction of action set to heuristic policies Problem If all possible combinations of crane allocation for vessels were considered, the state space becomes too large. Remedy: Restrict action space to certain heuristics • Vessels in terminal are assigned a priority with remaining time, load and crane capacity as weights
83
• Resources are allocated according to priority, for different fixed values of slack variables → Captures trade-off between feasibility and optimality Computation times • Model construction: state space generation and reduction • Model solution: LP formulation of MDP versus policy iteration
3
10
State generation Removal of invalid states Linear Program Policy Iteration
2
algorithm runtime [s]
10
1
10
0
10
-1
10
-2
10
-3
10
6
8
10
12
14 Vessels in schedule
16
18
20
11.3 Adaptive Robust LP Formulation Periodicity: information sets in scenario graph time 1 2 3 4
t=3 1 → ←
t=4 ← 4 →
t=1 1 ← →
t=2 1 → 2
1 → 3
← → →
1 1 →
2 → ←
2 4 →
→ ← →
→ 1 →
2 → 3
2 → →
Scenario graph with node set S =
ST
t=1
1 → →
2 → 2
2 → →
S(t)
84
22
Crane capacity allocation: adaptive robust model Given (for each vessel v) Arrival time av , max delay Uv Service time σv Load λv Decision variables Allocated crane capacity xsv ≤ ρv for all v and s ∈ S(t) where t ∈ {av , . . . , av + Uv + σv − 1} Minimize installed crane capacity c such that allocated capacity doesn’t exceed installed capacity X xsv ≤ c for all s ∈ S v
and each vessel is served before its deadline X xsv ≥ λv for all v and all paths P ∈ Πv s∈P
(Let Πv be set of paths of length σv originating in arrival nodes of v)
Some (T = 15) V computational LP construction results LP solution variables 3 4 5 6 7 8 9 10 11 12 13 14 15 16 17 18 19 20
6 28 180 395
s s s s
2s 2s 12 s 12 s 22 s 4 min 16 min 2h
59 89 129 203 377 531 1252 1598 3412 6652 9292 14’592 28’812 39’060 69’300 137’312 317’576 462’704
constraints 41 123 214 282 561 848 2056 2062 6922 13’834 21’502 36’140 77’564 119’744 239’264 539’392 1’225’984 2’471’512
The value of adaptability
85
c 2 4 4 4 41 6 7 7 7 7 9 13 9 13 11 12 12 12 12 13 23 13 23
Necessary crane capacity c 1.58
static robust solution
1.39 adaptive robust solution 1
capacity usage of nominal solution
0
1
2
3
4
5
6
7
8
9
10 11 12 Arrival uncertainty Uv
Summary of case study 1. Operation of transportation infrastructure networks faces the key conflict between efficiency and service quality • Robust planning (optimization) necessary 2. Adaptivity • can be seen as a permanent recovery strategy (reaction) • helps to reduce the price of robustness (on the cost of more complex models!) 3. Adaptive robustness in periodic capacity allocation problems using LPs on scenario graphs: can be interpreted as • Markov Decision Processes with infinite action space • Infinite-stage Stochastic Linear Programs Joint work with: • M. Hendriks, E. Lefeber (TU Eindhoven), J. Udding (PSA-HNN) [-1.5ex] • J. Jung, J. Paefgen, K. Sch¨ upbach, R. Zenklusen (ETH Zurich)
11.4 Hierarchical and Multi-Level Planning Interdependence of planning problems Problem considered so far Model-based planning methods mostly for a particular, concrete planning situation. But: A planning problem usually does not exist in isolation, but is interrelated with other planning problems
86
Interdependence of planning problems Example 11.4.1 (Two planning problems A and B). The chosen plan πA for problem A might influence • set of feasible plans ΠB ≡ ΠB (πA ) out of which a particular plan πB can be chosen, in particular – the sets of feasible actions U (x) ≡ U(x, πA ) • the outcomes g(πB , w) ≡ g(πB , w, πA ), in particular – the state transition function f (x, u, w) ≡ f (x, u, w, πA ) – the distribution of the uncertain parameters P{W = w | x, u} ≡ P{W = w | x, u, πA } – the cost function g(x, u, w) ≡ g(x, u, w, πA ) Coordination of plans Central question: How to coordinate different plans? Two extreme approaches: • Successive planning: different problems solved successively one after the other, ignoring effects on subsequent problems (often bad results) • Simultaneous planning: all problems solved simultaneously in one large, joint planning problem (often intractable) =⇒ Need for ’intermediate’ approaches that account for interdependencies with a good approximation (no textbook solution) Structuring the planning situation Definition 11.4.2 (Hierarchical planning). Decomposition into different levels of planning / decision making. Hierarchical planning is a useful conceptual modeling aid and reasonable first step in structuring the planning situation. Defining a hierarchy According to different aspects: 1. temporal range of decisions 2. degree of abstraction or detail 3. organizational structure or management tasks • typically a top-down approach
87
Management level upper middle lower
planning horizon strategic tactical operational
level of detail low intermediate high
Temporal Range Hierarchy Textbook classification • Strategic planning (long range: 2–10 years) • Tactical planning (medium range: 6 month – 2 years) • Operational planning (short range: day – 6 months) • On-line control (immediate: in real time)
Level-of-detail hierarchy Successive fine-graining of • Available production capacities • Available resources Example 11.4.3 (Multi-level Railway Operations Planning). Different aggregation levels of the infrastructure (physical railway network) 1. Commercial service intention on different stations 2. Macro timetable on aggregated topology 3. Detailed micro timetable 4. On-line rescheduling Solutions to lower levels needed to certify feasibility on upper level. Hierarchy along organizational structure • Upper management • Middle management • Lower management Summary: correlation of planning hierarchies
88
Classical example: production planning Hierarchical planning was ’invented’ in the context of production planning. Temporal hierarchy in production planning • Strategic planning: Production Capacity build-up • Tactical planning: Capacity allocation: factories to products (level of detail: product range to product type) • Operational planning: Production process plan (schedule, lot sizing, shipments, inventory management) • Online planning: Production control Traditional PPC (production planning and control) systems based on successive planning approach, e.g. • COPICS (Communications Oriented Production Information and Control System, IBM 1972)
Summary: hierarchical (multi-level) planning • Data of planning problem are higher-level decisions • The optimal higher-level decision should be made assuming implementation of an optimal plan of the lower level • Essentially used in all three case studies
89
12 Planning under Compliance Risk Production planning case in the pharma industry Assignment of products (pi ) to production sites over time (epochs ei ).
Compliance with Good Manufacturing Practices Product revenue rp
r1
r2
Products p ∈ P = {1..P }
1
2
rP ... h2S
h11
Product hazard hps Sites s ∈ S = {1..S}
h21
1
P
hP 1
h1S
hP S
...
S
Compliance risks • A regulatory agency (e.g. FDA) checks procution sites for compliance with Good Manufacturing Practices (GMPs) • If a site fails inspection, it is temporarily suspended and revenue is lost → risk depends of the product hazard hps of products at a given site s • The agency might not be able to inspect every site at any time Shah (2004) Need to move from value-oriented supply chains to risk considerations, caused by increasing regulatory pressure and eroding margins.
90
Decision sequence and outcome Revenue is lost if inspection is failed. Company
Adversary Randomness Production Realized Inspections Plan Revenue
(assign products to sites)
(choose K out of S)
1 1
inspect
r1 + r2 w.prob 1 − max{h11 , h21 }
2
inspect
r3 with prob 1 − h32
2 3
r4 with prob 1
3 4 S Sites
P Products
K Bernoulli trials
12.1 Single-period Models 12.1.1 Worst-case Worst-case single period model XX
max x∈X
rp,s xp,s − L
L: “Loss”
s∈S p∈P
L≥
s.t.
X s∈S
ws
X
∀w ∈ W
rp,s xp,s
p∈P
Decision set X xp,s ∈ {0, 1} X xp,s ≤ 1
∀s ∈ S, ∀p ∈ P ∀p ∈ P
s∈S
(plus further production constraints)
Uncertainty set W ws ∈ {0, 1} X ws ≤ K
∀s ∈ S
s∈S
“Inspection scenarios” Bi-level formulation max x∈X
XX
rp,s xp,s − L(x)
s∈S p∈P
91
Decision set X xp,s ∈ {0, 1} X xp,s ≤ 1
∀s ∈ S, ∀p ∈ P ∀p ∈ P
s∈S
(plus further production constraints)
L(x) = max w∈W
X
ws
s∈S
X
rp,s xp,s
p∈P
Uncertainty set W ws ∈ {0, 1} X ws ≤ K
∀s ∈ S
s∈S
“Inspection scenarios” Hardness Complexity • Upper-level (company) problem is NP-hard already for S = 2 and K = 1. Proof: by reduction from HALF-PARTITION. [1ex] • Lower-level (adversary) problem can be solved greedily.
Dualization gives a compact formulation L(x) = max w
s.t.
X
ws
s∈S
X
X
rp,s xp,s
= min Kz + z,y
p∈P
ws ≤ K
s.t.
s∈S
X
ys
s∈S
z + ys ≥
X
rp,s xp,s
∀s ∈ S
p∈P
ws ≤ 1
∀s ∈ S
ws ≥ 0
∀s ∈ S
Compact worst-case model max x,z,y
s.t.
XX
rp,s xp,s − Kz −
s∈S p∈P
z + ys ≥
X
ys
s∈S
X
rp,s xp,s
∀s ∈ S
p∈P
X
xp,s ≤ 1
∀p ∈ P
s∈S
xp,s ∈ {0, 1}
∀s ∈ S, ∀p ∈ P
z ≥ 0, ys ≥ 0
∀s ∈ S
92
12.1.2 Worst-case expectation Single-period model for worst-case expectation Maximizing the worst-case expected revenue XX X max rp,s xp,s − Kz − ys x,z,y,f
s∈S p∈P
s∈S
z + ys ≥
s.t.
X
∀s ∈ S
rp,s fp,s
p∈P
(1 − xp,s ) + fp,s ≥ hq,s xq,s
∀s ∈ S, ∀p ∈ P, ∀q ∈ P
0 ≤ fp,s ≤ xp,s
∀s ∈ S, ∀p ∈ P
X
∀p ∈ P
x
≤1
p,s fp,s : hazard that product p experiences at site s s∈S
xp,s ∈ {0, 1}
∀s ∈ S, ∀p ∈ P
Some computational results Case 1 3 5 6 7 8 9 10 11 12
S 6 7 8 8 9 9 10 10 12 12
P 12 14 16 16 18 18 20 20 24 24
K 3 3 3 4 3 5 3 5 3 6
z≥0 WC-D WC-F ys ≥ 0 6.62 0.54 7.54 -
WC-P 3.72 -
E-D 3.37 20.91 -
E-F 0.25 0.93 4.52 1.97 8.84 8.93 14.85 18.08 -
E-P ∀s ∈ S 0.24 1.04 3.46 1.44 4.52 3.69 6.54 5.04 37.95
Computation times in seconds. -: not finished within 120 seconds. [1ex] D: direct formulation (not covered here) F: constrained formulation P: compact dualized bi-level formulation
A MINLP for maximizing the CVaR when K = S max
x,u,f,v,Uβ
s.t.
i Yh 1 X uQ fs(1−IQ (s)) (1 − fs )IQ (s) + Uβ β s∈S Q⊆S X uQ ≤ vs − Uβ
∀Q ⊆ S
s∈S\Q
vs ≤
X
∀s ∈ S
rp,s xp,s
p∈P
fs ≥ hp,s xp,s
∀s ∈ S, ∀p ∈ P
0 ≤ fs ≤ 1
∀s ∈ S
X
∀p ∈ P
xp,s ≤ 1
s∈S
xp,s ∈ {0, 1}
∀s ∈ S, ∀p ∈ P
vs ≥ 0
∀s ∈ S
uQ ≤ 0
∀Q ⊆ S
93
12.2 Multi-period Models 12.2.1 Non-adaptive decisions Worst-case multi-period model XXX
max x∈X
rp,s,t xp,s,t − L
L: “Loss”
s∈S p∈P t∈T
L≥
s.t.
XX s∈S t∈T
ws,t
X
∀w ∈ W
rp,s,t xp,s,t
p∈P
Decision set X xp,s,t ∈ {0, 1} X xp,s,t ≤ 1
∀(s, p, t) ∀(p, t)
s∈S
(plus production constraints) Uncertainty set W ws,t ∈ {0, 1} X ws,t ≤ K
∀(s, t) ∀t
s∈S
“Inspection scenarios” So far, no inter-temporal dependencies.
Worst-case multi-period model, closing for D = 2 max x∈X
s.t.
XXX
rp,s,t xp,s,t − L
L: “Loss”
s∈S p∈P t∈T
L≥
XX
(ws,t−1 + ws,t )
s∈S t∈T
X
rp,s,t xp,s,t
p∈P
Decision set X xp,s,t ∈ {0, 1} X xp,s,t ≤ 1
∀(s, p, t) ∀(p, t)
s∈S
(plus production constraints) Uncertainty set W ws,t ∈ {0, 1} X ws,t ≤ K
∀(s, t) ∀t
s∈S
“Inspection scenarios” Failed sites to be closed for D periods.
94
∀w ∈ W
12.2.2 Stochastic Programming Model Scenario tree representing the inspection process Example: S = 3 sites, K = 1 and D = 2 n [w1,t w2,t w3,t ] n is the node index
5 [0 1 0] 6 [0 0 1]
2 [1 0 0]
7 [1 0 0] 1 [0 0 0]
3 [0 1 0]
8 [0 0 1] 9 [1 0 0]
4 [0 0 1]
Revenue Accounting Time
t=1 t=2
t=1
Stochastic program Revenue accounting after observed inspection
10 [0 1 0]
Λa(n)
t=2 Production Decision Time Time
Λn = Λa(n) + va(n) (1−wn) inspection wn
Scenario Tree
Decision under uncertain future
a(n)
xa(n) va(n)
95
Λs(n) = Λn + vn (1−ws(n))
inspection ws(n) n
s(n)
xn vn
xs(n) vs(n)
max
Γ
s.t.
Γ ≤ Λn
∀n ∈ NT
Λ1 = 0 Λn = Λa(n) +
X
va(n),s (1 − wn,s )
∀n ∈ N \{1}
s∈S
vn,s ≤
X
∀n ∈ N \NT , ∀s ∈ S
xn,p,s rp,s,t(n)
p∈P
xn,p,s ≤ 1 − wn,s X xn,p,s ≤ 1
∀n ∈ N \NT , ∀s ∈ S, ∀p ∈ P ∀n ∈ N \NT , ∀p ∈ P
s∈S
xn,p,s ∈ {0, 1}
∀n ∈ N \NT , ∀s ∈ S, ∀p ∈ P
12.2.3 Stochastic Dynamic Programming Model Stochastic dynamic program, D = 2 For all t = T, . . . , 1 and all U ⊆ S, |U | = K set Jt (U ) := max Λ s.t. Λ ≤
X
X
xp,s,t rp,s,t + Jt+1 (V )
∀V ⊆ S \ U, |V | = K
s∈S\U \V p∈P
X
xp,s,t ≤ 1
∀p ∈ P
s∈S
xp,s,t ∈ {0, 1}
∀s ∈ S, ∀p ∈ P
Stochastic dynamic program, D = 3 For all t = T, . . . , 1 and all U, V ⊆ S, |U | = |V | = K, U ∩ V = ∅ set Jt (U, V ) := max Λ s.t. Λ ≤
X
X
xp,s,t rp,s,t + Jt+1 (V, W )
∀W ⊆ S \ U \ V, |W | = K
s∈S\U \V \W p∈P
X
xp,s,t ≤ 1
∀p ∈ P
s∈S
xp,s,t ∈ {0, 1}
∀s ∈ S, ∀p ∈ P
Numerical test on small instances
96
S, P, K, D, T 3, 8, 1, 2, 4
3,8,1,2,6
4,10,1,2,4
5,10,2,2,4
4,6,1,3,4
Opt model DP Tree MIP * Tree MIP ** MIP 2 Obj MIP 2 RH realized DP Tree MIP * Tree MIP ** MIP 2 Obj MIP 2 RH realized DP Tree MIP * Tree MIP ** MIP 2 Obj MIP 2 RH realized DP Tree MIP * Tree MIP ** MIP 2 Obj ** MIP 2 RH realized DP MIP MIP DP MIP MIP
7,6,2,3,4
comp. time in s 0.82 TL 60 TL 1800 5.61
worst-case revenue 261 260 261 262 260 383 382 382 386 381 400 391 391 402 399 231 216 220 232 230
1.35 TL 60 TL 1800 41.27 2.06 TL 60 TL 1800 303.31 111.68 TL 60 TL 1800 TL 1800 2.75 48.70
2 Obj 2 RH realized
0.38% 0.26% 0.26% 0.53% 2.25% 2.25% 0.25% 6.49% 4.76% 0.43%
234 235 233 181 182 181
27,948.35 16,854.45
2 Obj 2 RH realized
optimality gap 0.38% -
0.43% -
Dynamic program, D = 2, worst-case expectation For all t = T, . . . , 1 and all U ⊆ S, |U | = K set Jt (U ) := max Λ s.t. Λ ≤
X
uQ
i⊆V
uQ ≤
Yh
(1−IQ (s))
fs
(1 − fs )IQ (s)
i
∀V ⊆ S \ U, |V | = K
s∈S
X
X
xp,s,t rp,s,t + Jt+1 (Q)
∀V, ∀Q ⊆ V
s∈S\U \Q p∈P
fs ≥ hp,s xp,s
∀s ∈ S, ∀p ∈ P
0 ≤ fs ≤ 1
∀s ∈ S
X
∀p ∈ P
xp,s,t ≤ 1
s∈S
xp,s,t ∈ {0, 1}
∀s ∈ S, ∀p ∈ P Again a MINLP
12.3 Conclusions Conclusions Single-period problems • All considered production problems are hard (exponential in P ) due to (adversarial) risk constraints - Different MIP formulations • Computing CVaR is exponential in S (sum of Bernoulli trials) - An exponentially large MINLP for CVaR optimization Multi-period problems
97
• Inter-temporal dependencies from failures durations D > 1 - Dynamic program solving a MIP in each state • Worst-case expectation - Dynamic program solving a MINLP in each state - Should yield better guaranteed revenue rate in infinite horizon case than pure worstcase model
98
13 Further Topics 13.1 State Augmentation State Augmentation State augmentation (i.e., the introduction of additional ’artificial’ state variables) is useful to model various more realistic aspects • Time delays (exercise!) • Correlated disturbances – e.g., price correlations, demand correlations Resource Management in Electricity Networks Case study for • Bi-level planning problem – Upper level: Number of resources – Lower level: Resource allocation rule (operational policy) • Problem approximation
1
(based on simpler, more tractable problem)
– Decomposition – Aggregation Problem Approximation by Decomposition General Idea: • System might be composed of sub-systems with relatively weak “coupling ” • Deal with subsystems in isolation (or by simplifying influence on/of other subsystems Here: • Different (disjunct) areas of responsibility of resources • Only one high-voltage network group at a time
1
[?, Chapter 6]
99
Problem Approximation by Aggregation General Idea: • System might contain an overwhelming number of states • Combine “similar” states into aggregate states – Similar cost – Similar transition probabilities to other states • Solve aggregate problem Here: • Spatial aggregation of possible resource location into a number of discrete nodes • Temporal aggregation of repair process into a number of discrete steps • Further necessary: reduction of number failure states
100
Bibliography [Bertsekas 2005] Bertsekas D.P. 2005. Dynamic Programming and Optimal Control. Volume 1. Athena Scientific, Belmont. [Scholl 2001] Scholl A. 2001. Robuste Planung und Optimierung. Physica-Verlag, Heidelberg. [Berger 2006] Berger P.D. and Zeng A.Z. 2006. Single versus muliple sourcing in the presence of risks. Journal of the Operational Research Society 57:250–261. [Tomlin 2006] Tomlin B. 2006. On the Value of Mitigation and Contingency Strategies for Managing Supply Chain Disruption Risks. Management Science 52(5):639–657.
101