Freescale Semiconductor, Tempe, AZ 85284. Ahstract-This paper presents a robust process qualification and monitoring procedure based on the recently ...
Robust Process Capability Index Tracking for Process Qualification Cong Gu and Colin C. McAndrew Freescale Semiconductor, Tempe, AZ 85284
Ahstract- This
paper presents a robust process qualification
and monitoring procedure based on the recently developed YAT and YWL process capability indices. Combined with appropriate test structures and measurements the procedure enables rapid process maturity evaluation and on-going loop closure of man ufacturing to process specifications. The procedure generates
qualification, and on-going monitoring of processes, with application to power BiCMOS technologies. Besides being based on the new capability indices, our procedures are web based and dynamic, and enable simple and fast identification of problems.
interactive web-based reports and data that provide high-level
II.
"scoring" and a time-line of process capability, an ability to quickly dive down and identify the root cause of issues, and capability to compare between fabs.
I.
• •
measure how well the sample mean m aligns to the process target T quantify the statistical spread, via the sample standard deviation s, from process variation assess compliance with respect to lower LL and upper UL specification limits
However, there are several issues with conventional proce dures for process capability monitoring and control. First, the standard capability indices often do not fairly represent the "health" of a process, see the extensive discussion in [1]. To circumvent that issue the new capability indices yield-around target (YAT) and yield-within-limits (YWL) were introduced in [1]. Not only do these indices produce less false alarms and miss fewer real process excursions than the conventional capability indices, they are substantially more intuitive to understand and so are easily assimilated by engineers. Second, complex processes, such as power BiCMOS or BCD (bipolar, CMOS, and DMOS) processes [2], comprise many process steps, numerous differently doped silicon layers, and a large palette of devices, and can therefore have hundreds of crucial process parameters to monitor and evaluate. So it can be difficult to quickly evaluate the maturity level of a process or to rapidly identify where corrective actions are needed. In this paper we present an implementation of the YAT YWL methodology for process maturity evaluation, process
978-4799-8304-9/15/$31.00©2015IEEE
UL-LL
Cp
INTRODUCTION
Semiconductor manufacturing operations use statistical pro cess control (SPC) to monitor performance and maximize yield. Commonly, this entails tracking capability indices such as cp, Cpb and cpm to assess process maturity and to help optimize a process during qualification and production ramp. These indices are monitored for a set of devices and mea surements that are selected to gauge the overall "health" of a process (parametric alignment to specifications, reliability, etc. ). The intent is, for each of the identified "crucial" process parameters, to: •
CA PA BILITY INDICES
The traditional capability indices are
Cpk
=
.
=
mm
and Cpm
(1)
--6-a--
[ UL-fJ fJ-LL ] '
3a
- - UL-LL 6
(2)
3a
,
:c===c==:::: :; :::; ::::; ;: J-;::: a 2 + (fJ-T)2
(3)
where fJ and a are the process mean and variability, estimated from the sample mean and sample standard deviation. We will assume that the statistics, target, and limits are specified, although setting limits based on limited data is fraught with its own issues, see the excellent discussion in [3]. An obvious deficiency of both cp and Cpk is that they do not depend on the process target T, so cannot quantitatively indi cate when a process drifts from its target value. cpm is affected by the difference between the process mean and its target, however it is synunetric and therefore of limited use where T may be skewed with respect to (LL + UL) /2. ASYlmnetry is often observed in distributions of leakage currents, where low is acceptable and too high is a problem, and breakdown voltage, where the reverse is the case, or where the parameter distribution is non-normal (quantities with significant variation often exhibit a log-normal distribution, which is skewed; this can be handled by a logarithmic, or more generally Box Cox [4], transformation). None of these indices has intuitive bounds ( Cpk even becomes negative if fJ drifts outside of the specification limits). The new capability indices introduced in [1] are Yield Around Target
54
YAT
=
(
yield T -
T-LL 3
'
T+
UL-T 3
)
(4)
and Yield Within Limits
YWL
=
yield(LL, UL) .
(5)
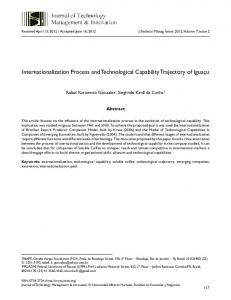
As Fig. 1 shows for an assumed normal distribution with limits set at fJ ± 3a, essentially YAT is the yield within ±la of the
YWL 0.8
,,
0.2
._._.
,,
,,
,,
,,
,,
,,
,,
c pm
" �
,,
,,
... , ....
,
YAT -YWL
---
0 -3
-2
-1
0.5
0
2
o
z
Fig. 2.
Fig. 1. YAT and YWL definitions (using LL, T, U L abscissa is z = (value - /.t)/O".
=
2
1.5
(fl-T)/