CSE IN INDUSTRY Editors: Ken Hass,
[email protected] Thomas L. Tysinger,
[email protected]
ROBUSTNESS OPTIMIZATION FOR VEHICULAR CRASH SIMULATIONS By Ren-Jye Yang, Alexander Akkerman, Daniel F. Anderson, Omar M. Faruque, and Lei Gu
O
VER THE PAST 10 YEARS, THE COMPUTER ANALYSIS OF VEHICLE CRASHWORTHINESS HAS BECOME A POWERFUL
where the incremental time step at the nth increment is ∆tn = (∆tn–1/2 + ∆tn+1/2)/2 .
AND EFFECTIVE TOOL IN REDUCING THE COST AND TIME OF BRINGING NEW VEHICLES TO MARKET THAT MEET CORPORATE
and government crash safety requirements. This increasing reliance on simulation is due to the development of theoretically sound and robust nonlinear finite-element (FE) methods coupled with the availability of affordable but powerful computers. FE-based crash analysis codes have successfully simulated many laboratory vehicle crash events. Today, most major automotive companies routinely use FE simulation to analyze and design vehicles that meet safety guidelines for frontal impact, side impact, roof crush, interior head impact, rear impact, and rollover. Crash simulation is fundamentally computation-intensive, and it requires fast and powerful supercomputers to ensure reasonable turnaround time for the analyses. Because the explicit FE method is computationally efficient, researchers generally prefer it for crash simulation. Explicit FE codes are available from several third-party mechanical computer-aided engineering (CAE) software vendors, and the major automotive manufacturers, including Ford Motor Company, use them for crash simulation. This article focuses on how this technology has been extended to perform design optimization and robustness assessment.
8
We can write the internal element force vector fint as
FE crash codes
Although each software vendor provides some unique functionality, all explicit FE crash analysis codes are based on the computational scheme described here. We can write the equation of motion in semidiscrete form as Mü = f = fext – fint where M is the diagonalized mass matrix, ü is the nodal acceleration vector, and fext and fint are the external and internal force vectors. To obtain a time-domain solution, we use an incremental updated Lagrangian scheme. Applying the central difference equations, we can write the velocity and acceleration at any time step as u˙ n +1/ 2 = ˙˙ n = u
un +1 − un ∆t
u˙ n +1/ 2 − u˙ n −1/ 2 . ∆t
We can update velocities and positions at any time step using these equations:
(
n n u˙ n +1/ 2 = u˙ n −1/ 2 + ∆t n M −1 fext − fint
un +1 = un + ∆t n +1/ 2 u˙ n +1/ 2
)
fint =
∫ B σdVe T
Vc
where σ is an element stress vector, B is a strain-displacement matrix, and Ve is the element volume. Typical FE analysis models for any crash mode might contain more than 100,000 shell elements. Simulation time can range from six to 20 hours, depending on the problem’s size, computer hardware, and number of processors used. Efforts to parallelize commercial crash analysis software have had limited success when applied to realistic simulation problems. Single simulations can rarely effectively use more than eight processors—the surface contact algorithms and a heterogeneous mixture of element types in the full vehicle model inhibit load balancing and efficient parallel speedup. However, the increased speed of RISC-based processors has reduced the turnaround time even for large simulations to within acceptable limits. Turnaround time is further reduced by using a modest number of processors in parallel. So, FE-based full vehicle structural crash simulation has become a design tool used throughout the automotive industry to evaluate vehicle crash performance.
COMPUTING IN SCIENCE & ENGINEERING
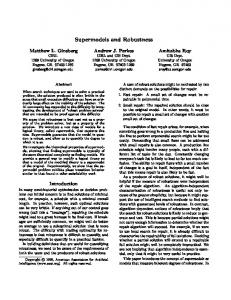
Figure 1. The safety optimization and robustness assessment process.
Define optimization problem: objective, constraints, design vaiables Latin hypercube sampling (experimental design)
Design of experiments and SOAR
Crash simulation gives crash safety design engineers the opportunity to explore many more alternative designs than they could with hardware. However, design improvements are still based on engineering judgment—engineers typically use a trial-and-error approach. That approach does not guarantee that they will achieve an optimal design. Automatic optimization techniques that directly apply the FE crash model require more simulations than can be performed in a reasonable amount of time for a reasonable cost, even with increases in processor speed and the availability of less expensive high-speed computers. Robustness assessment will further increase the simulation requirements by at least another order of magnitude. One way out of this dilemma is to apply computer design of experiments (DOE) techniques with a few carefully chosen samples in the design space to characterize the desired response. We can then use these samples as the basis for creating a surrogate or response surface model. We use this surrogate model in all subsequent steps to perform optimization and robustness assessment. A systematic computer-based DOE followed by a response-surface-based optimization and robustness assessment scheme are critical steps in the safety optimization and robustness (SOAR) process. This process helps achieve a balance between delivering the desired accuracy and simulation time and cost. Figure 1 outlines the entire process. LHS experimental design. The optimal Latin hypercube sampling1 (LHS) generates a sample of design points for response surface construction. We selected the optimal LHS, because we didn’t have prior knowledge of the model’s parametric form. This experi-
NOVEMBER/DECEMBER 2000
Construct response surface (RS): (stepwise regression)
Numerical optimization based on RS
Confirmation run for optimal design
Accuracy/ convergence?
No
Add new point to reconstruct RS
Yes Robustness assessment
Stop
mental design minimizes the bias part of the mean square error by distributing the sample points uniformly over the entire design region. The LHS space-filling design is better at capturing response nonlinearities than those used for hardware experimentation—it avoids computing unnecessary replicates. The total number of variables (including control and noise variables in the optimization problem) determines the number of CAE simulations in the optimal LHS. To construct a reasonably accurate response surface for the optimization and robustness assessment, we need a minimum of 3N LHS points—N being the total number of design variables. Therefore the number of initial simulations should range between 3N and 4N for best results. The number of levels for each variable in LHS is quite flexible and can be as high as the total number of simulations. Because each simulation in the experimental design is entirely independent, the problem is trivially parallel. Therefore, we can also use a loosely coupled system of inexpensive networked computers to perform the numerical simula-
tions required for the SOAR process. We can finish the SOAR process for a typical 10-design-variable case, including additional simulations that might be required for improving the response surface or confirming the optimal design, in about a week, using 24 processors on an SGI Origin 2000, Sun E10000 supercomputers, or a cluster of systems of comparable performance. We can use a modest number of processors (four to eight) in a single FE simulation to reduce the time required to perform the DOE without affecting result consistency.2 Response surface construction. We use a quadratic stepwise regression method to construct the response surfaces for subsequent optimization and robustness analyses. Researchers have described the SR as the best of the variable selection procedures and recommended it highly for modeling the response surfaces.3 It is also accurate and robust for safety optimization problems.4 Optimization and robustness assessment. Usually, if a safety simulation uses optimization at all, it is only
9
CSE IN INDUSTRY
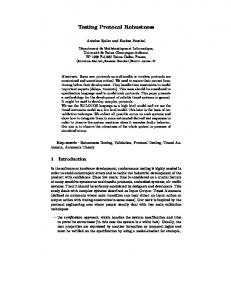
Figure 2. A side-impact finite-element model.
deterministic. Furthermore, most safety simulations consider the impact of variability in design parameters on vehicle response solely through the use of safety factors. In the SOAR application, we perform deterministic optimization using sequential quadratic programming with mixed variables. After obtaining a deterministic optimum, we make a robustness assessment by modeling the design variables with uncertainties. These uncertainties result from many sources, such as gauge and material variation and test variability. Owing to these uncertainties, we must treat the design variables as random variables. In the SOAR process, we perform robustness assessment by constructing a cumulative distribu-
tion function of the response variables, generated from Monte Carlo simulation. We can use the SR response surface as a surrogate model to perform both the deterministic optimization and robustness assessment. Because a small system of equations represents the SR model, we can evaluate it quickly at very little computational expense compared to the full FE simulation. Thousands of samples might be needed to realize a good representation of the response probability distribution using Monte Carlo simulation. Application to a side-impact study
Figure 2 shows the side-impact system model used in our study.5 The system model includes a full-vehicle FE structural model, an FE side-impact dummy model, and an FE deformable side-impact barrier model. The system model consists of approximately 90,000 shell elements and 96,000 nodes. In the FE simulation of the side-impact event, the barrier has an initial velocity of 31 mph and impacts the vehicle structure. Figure 2 shows the barrier’s position at some instant during the impact. A typical simulation lasts about 80 milliseconds.
Scientists get the stuff they need online @ www.physicstoday.org/guide
I need an actuator!
(1) Go to Physics Today’s online Buyers’ Guide, the “Yellow Pages” for the physical sciences. www.physicstoday.org/guide
(3) View more than 2,000 potential suppliers Average is 13 suppliers for each of 2,200 product categories!
Newport Corp. P.O. Box 19607 1791 Deere Ave, Irvine CA 92606 Tel: (949) 863-3144 Toll free Tel: (800)-222-6440 Fax: (949) 253-1680 Product Categories acoustic noise barriers actuators autocollimators ball slides . . .
actuators American Piezo Ceramics, Inc. Energen Inc. ETREMA Products, Inc. Industrial Devices Corp. Kerk Motion Products Inc. Newport Corp. OptoSigma Corp.
(5) Contact the company by phone, fax, or e-mail . . . and get your stuff!
(4) Choose a company
(2) Search the product index for “actuator”
www.physicstoday.org/guide
Minimize Subject to
Weight Abdomen Load ≤ 1.0 KN V*C ≤ 0.32 m/s Durd (upper rib deflection) ≤ 32 mm Dmrd (middle rib deflection) ≤ 32 mm Dlrd (lower rib deflection) ≤ 32 mm Pubic symphysis force F ≤ 4.0 KN Velocity of B-pillar at middle point: VB-Pillar ≤ 9.9 mm/ms Velocity of front door at B-pillar Vfront door ≤ 15.70 mm/ms
For an automotive manufacturer to sell vehicles in any country or region, the vehicle design must meet all safety regulations mandated by the regional authority. The two primary sideimpact protection regulations are FMVSS-214, which the US National Highway Traffic Safety Administra- Figure 3. The optimization problem for side impact. tion mandates, and ECE 95.01, which the United Nations Economic Commission for Europe mandates. Both the US and Europe sign variables. The control variables are critical component make side-impact crash test ratings available to the public. materials and thickness. All the thickness design variables are In the US, the NHTSA does this through its Lateral Impact continuous, which we can vary from 0.5 × t0 to 1.5 × t0, where New Car Assessment Program (LINCAP), and Europe has t0 is the baseline value. The material design variables are disits own New Car Assessment Program (EURO-NCAP). crete, meaning either mild steel or high-strength steel. The The crash test procedures that LINCAP and EURO-NCAP noise factors are barrier height and impact position, which use are based on the respective regulated side-impact crash are continuous and vary from –30 mm to 30 mm, according tests for each region. We used the EURO-NCAP side- to the physical test. We only use the noise factors in the roimpact test configuration for the problem in this article. bustness assessment. The crash dummy’s performance is the main metric in side-impact crash studies. In the EURO-NCAP side-impact procedure, the primary performance criteria for the dummy are the head performance criterion (HPC), abdomen load, pubic symphysis force (the force at the joint of the two ileum at the front of the dummy’s pelvis area), V*C (viscous criterion), and the rib deflection (upper, middle, and lower). These dummy responses must meet the acceptance criteria as described in the EURO-NCAP side-impact procedure. We used an FE dummy model to obtain the required dummy performance numbers. In addition, the velocity of B-Pillar at middle point and the velocity of front door at B-Pillar are also important safety design considerations. Optimization. As an example, let’s consider increasing gauge in a side-impact analysis. In some cases, this change might improve dummy performance. However, it also increases vehicle weight, which is undesirable for fuel economy. Therefore, we must seek a balance between weight reduction and safety performance. The optimization problem in this article aims to reduce the overall vehicle weight while maintaining or improving the dummy safety performance as measured by the EURO-NCAP side-impact safety rating score (see Figure 3). This score consists of four performance measurements of the dummy—the HPC, abdomen load, rib deflection or V*C, and pubic symphysis force. The highest score for each measure is four points. So, a vehicle can score a maximum of 16 points for its performance in side impact. In this example, side-impact optimization involves 11 de-
NOVEMBER/DECEMBER 2000
11
CSE IN INDUSTRY
Weight (Kg)
30
Prediction Confirmation
25 20 15
We performed three iterations for the benchmark problem. In each iteration, we compared the optimum design results with the confirmation solution. If the confirmation so0 Baseline First Second Third lution was not satisfied, we constructed new response surface iteration iteration iteration models by adding the confirmation results. We then continued the optimization process using the new response surFigure 4. Optimum design results. faces. Figure 4 shows the convergence of reduction in weight as a function of iteration count. At convergence, the weight decreased by approximately 5.5 kg. The safety rating, based on crash dummy responses, improved by 6%. The entire Ren-Jye Yang is a senior staff technical specialist in the Safety Research and Development Deanalysis required 37 FE simulations, partment at the Ford Research Laboratory. His technical interests include mechanical design, CAE, which included simulations for condesign optimization, stochastic simulation, and computational mechanics. He received his BS and structing the initial response surface as MS in civil engineering and engineering mechanics from the National Taiwan University at Taipei well as confirmation runs. Each 80-ms and his PhD in materials engineering from the University of Iowa. He is a fellow of the ASME and model simulation required 20 hours on a single-processor SGI Origin 2000. a member of the USACM and ISSMO. Contact him at Ford Research Lab., MD2115-SRL, 2101 VilOne optimization iteration required aplage Rd., Dearborn, MI 48124;
[email protected]. proximately 10 minutes on an engineering workstation. Alexander Akkerman is a senior technical specialist in the Numerically Intensive Computing DeIn general, the results converge to an partment at Ford Motor Company. His technical interests include high-performance computing, optimal solution within three iterations, parallel computing, and CAE software development. He received his MS in computer engineerand predictions correlate well with the ing from Wayne State University in Detroit. He is a member of the IEEE Computer Society. Conconfirmation results. In our example, tact him at Ford Motor Company, MD-10, ECC Bldg., PO Box 2053, 2000 Rotunda Dr., Dearborn, the errors in weight, velocities, forces, MI 48121;
[email protected]. and rib deflections were all within 5%. 10 5
Daniel F. Anderson is a supervisor in the Robust Design and Durability Technology Section at Ford. His technical interests include analytical reliability and robustness for CAE and high-performance computing. He received his BA in philosophy and BS in engineering from Oakland University and his MS in electrical engineering from Wayne State University. He is a member of the Society of Automotive Engineers and the ACM. Contact him at Ford Motor Company, MD-44, AEC Bldg., PO Box 2053, 2000 Rotunda Dr., Dearborn, MI 48121;
[email protected]. Omar M. Faruque is a supervisor of structural safety in the Advanced Safety and Pre-Program Department at Ford. His technical interests include structural design, dynamics, vehicle safety design, and computational mechanics. He received his PhD in civil and engineering mechanics from the University of Arizona, Tucson. Contact him at Ford Motor Company, MD-48, AEC Bldg., PO Box 2053, 2000 Rotunda Dr., Dearborn, MI 48121;
[email protected]. Lei Gu is a technical specialist at the Ford Research Laboratory. His technical interests include safety optimization and robustness, nonlinear finite-element method for crashworthiness, meshfree method, and adaptivity in structure dynamics. He received his BS in applied mathematics and mechanics and his MS in computational mechanics from the Nanjing Institute of Technology in China and a PhD in mechanical engineering from the University of Science and Technology of China and in theoretical and applied mechanics from Northwestern University. He is a member of the USACM. Contact him at Ford Motor Company, MD-2115, Rm. 2125, SRL, PO Box 2053, 2000 Rotunda Dr., Dearborn, MI 48121;
[email protected].
12
Robustness assessment. In this phase, we treat the input parameters as random variables. In this study, we assumed that all variables have a Gaussian normal distribution. We set each variable’s mean value to be the same as for the optimal design. We performed each robustness assessment by constructing a cumulative distribution function of the response variable generated using the Monte Carlo method. A random-number generator selects values for each random variable with a frequency proportional to the shape of the corresponding probability distribution. Usually we need 1,000 to 10,000 samples for a good representation of the response probability distribution. We use the response surface generated during optimization to make this process computationally feasible. In the side-impact analysis, we
COMPUTING IN SCIENCE & ENGINEERING
Design constraint
24.1 24.0 23.9 23.8 23.7 23.6 23.5 23.4 23.3
Weight (Kg)
Upper rib deflection (mm)
36 35 34 33 32 31 30 29 28
needed 1,000 independent samples to Optimal 70% 85% 90% 95% 99% obtain a satisfactory cumulative distribConfidence interval ution function. The robustness assessment’s result Figure 5. The effect of the confidence interval on weight (green) and design provides a confidence interval around constraints (red). the optimum design. Figure 5 shows the deviation of weight from the deterministic optimal design as the confiAided Eng., Soc. of Automotive Engineers, Warrendale, Penn., 1997, pp. dence interval increases. Although the deterministic optimal 79–85. design meets all the design targets, robustness assessment 3. N. Draper and H. Smith, Applied Regression Analysis, John Wiley & Sons, might violate one or more of the design constraints as the New York, 1966. confidence interval increases. In the side-impact example, the 4. R. Yang et al., “Approximations for Safety Optimization of Large Sysupper-rib deflection constraint is violated with the 85% contems,” Proc. Design Eng. Technical Conf., American Soc. of Mechanical Engineers, Baltimore, Md., 2000. fidence interval (see Figure 5). This result indicates that a 5. L. Gu et al., “Optimization and Robustness for Crashworthiness of Side real-world vehicle side-impact test has more than a 15% Impact,” to appear in Int’l J. Vehicle Design, 2000; contact chance of violating this constraint.
[email protected].
F
ull-scale vehicle crash simulation has become a standard part of vehicle design. High-quality simulation models and computer-based DOE and response surface methods have let researchers at Ford Motor Company extend this simulation capability to the assessment of uncertainties resulting from sources such as test and manufacturing variability. Even better, we can realize this capability economically with currently available computer hardware. We are developing this technology further to achieve reliability-based design optimization. Reliability-based design optimization will deliver a design that is optimal as well as less sensitive to parameter variability and external noise factors.
Acknowledgments The authors thank Cheng H. Tho, Yusheng Li, and Geoffrey Qiu for their help and valuable discussion.
References 1. C. Currin et al., “Bayesian Prediction of Deterministic Function, with Applications to the Design and Analysis of Computer Experiments,” J. Am. Statistical Assoc., Vol. 86, 1991, pp. 953–963. 2. D. Anderson, A. Akkerman, and D. Strenski, “Requirements for Consistency in the Parallel Implementation of Explicit FEA Crash Simulation Programs,” Proc. Int’l Conf. Vehicle Structural Mechanics and Computer
NOVEMBER/DECEMBER 2000
13