visualization. RODAN is designed and implemented to take advantage of these
technological advances. Data management and interoperation have been one of
...
1.11
RODAN: RUTGERS OCEAN DATA ACCESS NETWORK POWERED BY JAVA TECHNOLOGIES
Yunqing P. Zhang*, John F. Fracassi, John E. Wiggins, Scott M. Glenn, and J. F. Grassle. Rutgers University, New Brunswick, New Jersey
1.
INTRODUCTION
With the rapid development of remote sensing and observation technologies, an unprecedented amount of data have been collected by marine scientists. Reliable and user-friendly data management systems with search and display capabilities are in great demand to maximize the use of these data in answering critical questions about our ocean environment. In deference to scientific exchange and collaboration, the data on these systems should be universally accessible and the systems should be portable to multiple hardware and software platforms. Moreover, data searching, retrieving, analyzing and visualization should be supported on an intuitive user interface so as to accelerate the transformation of data into scientific knowledge and insight. The Rutgers Ocean Data Access Network (RODAN) was designed to deliver the aforementioned functions. RODAN is an open access data management system currently designed for distributing archived Long-Term Ecosystem Observatory (LEO-15) data. LEO-15, located offshore Tuckerton, New Jersey, is composed of two instrument platforms (nodes) at 15 meter depth and a surrounding network of satellite, aircraft and shore-based remote sensing systems (Grassle et al., 1998; Glenn et al., 1999). The major goal of the Observatory is to obtain oceanic and meteorological observations at temporal scales for combining and processing in real-time. While real-time data play a pivotal role in nowcast and forecast generation, archived data are equally important in monitoring long-term environmental change. Research and educational institutions all over the United States, often request these archived data sets. How to readily distribute data to such a diverse user group is the major issue that RODAN addresses. Traditionally, data have been copied onto CD-ROMs and then shipped to users. This approach may be appropriate for transferring very large quantities of data to experienced users, who are familiar with the particular data sets and the related formatting and conversion issues. However, the majority of the data requests do not fall into this
* Corresponding author address: Yunqing P. Zhang, Rutgers University, Institute of Marine and Coastal Science, New Brunswick, NJ, 08901; e-mail:
[email protected]
category. Indeed, most of the users are only interested in a small subset of the data and wish to first obtain a sample in order to assess the value of the data to their particular research projects. In addition, a considerable number of data requests are from students and secondary school educators, who wish to abstract general concepts from the data, rather than perform some involved data analysis. An intuitive graphic user interface will assist those users in extracting the most out of the data. The ubiquitousness of the World-WideWeb makes it the perfect candidate for interfacing with a geographically separated user group. Recent advances in Internet technology also allow for seamless integration of data storage, access, analysis, and visualization. RODAN is designed and implemented to take advantage of these technological advances. Data management and interoperation have been one of the central concerns in the marine research community. Many attempts have been made to address the issue from different angles and the different approaches have been inspirational to our system design. However, we choose not to copy any of them out of a consideration for individual applicability and forward compatibility. For a while there have been two distinctive approaches to perform distributed data management and analysis. One is to design a networked data system and ask everyone to subscribe to it. The other is to acknowledge each data provider's individual need in data management and analysis as well as its unique presence on the Internet, meanwhile achieving interoperability by supporting the same data exchange formats and protocols that have been mutually agreed upon by the whole community. We are in favor of the latter approach based on our own experience in dealing with LEO-15 data and on communications with other data providers in the field. Essentially, data analysis and visualization needs are so diversified that it is hard for any single system, even superbly designed, to accommodate all the requirements and afford each data provider a unique web presence. Equally important, information technology is evolving at such a phenomenal speed that a system developed with a certain technology may become out of date in a matter of several years, while well-designed protocols and exchange formats will move at a much slower pace. Furthermore, ingenious ideas and approaches are more likely to originate in a heterogeneous environment. Henceforth, it is more desirable to have each individual data provider decide
what data management system and web page he/she wants to use and follow certain rules only when new data are to be engineered out of more than one data source. Of course, the well-developed networked systems are also important: they provide a simple solution for those data providers who are not well equipped or for whom unique web presence is not a major concern.
2.
A SHORT HISTORY OF RODAN
A pilot project of RODAN was completed in the summer of 1998 and the first full-fledged version was put into operation in early 1999. In this version of the system, we provide the functions of data searching, analyzing, processing, visualizing and retrieving on a browser, the complexity of which is managed by a series of JavaScript programs. The JavaScript programs help maintain a dynamic human-system interaction by performing the operations of formatting user requests, sending them to the web server and opening new browser windows for presenting the data and plots returned. This approach ensures a better response time because the operations are handled locally on the browser side. User requests are handled by a series of CGI (Common Gateway Interface) programs that are implemented in PERL and reside on a Web server (Netscape Enterprise Server 3.5.1). The CGI programs decode the requests, dispatch them to the corresponding analyzing and plotting modules on the web server (a Sun Ultra 5), formalize the results outputted from these modules into web-presentable products, and send the resultant data product back to the users on the browser side. Each time the web server receives a user request, the CGI programs spawn a new process to handle that request. There are two types of processes that can be invoked. The first is a process that executes the data access and processing programs written in C. The second is a process that generates a Matlab plotting script, and starts a new Matlab engine upon which to interpret that script. The first version of the system, as described above, is process-oriented. That is, a new process is spawned in response to each user request. Since its introduction, the system has been in continuous operation and provided numerous services to users from diverse backgrounds. Marine researchers interested in integrating data into their research projects, and students and secondary school teachers, who wish to broaden their knowledge base, use the site. In particular, our in-house researchers consistently examine real-time observations using the plots generated by RODAN as climatological references. Clearly, the first version of RODAN has achieved its design goals and delivered reliable data services to a
broader marine research community than just the usual experiment PIs (principal investigators). Though, with the rapid increase of users and the growth of archived data, it became obvious that the system had to be scaled. However, the CGI protocol, which handles each request by spawning a new process, poses a considerable obstacle. When the number of simultaneous users rises, so does the overhead associated with process spawning and the demand for synchronization and interprocess communication. For instance, let us assume that multiple processes with the same priority have to run on a single processor. Then, a multi-tasking operating system would repeatedly allocate small segments of processor time toward the partial execution of each process, so as to give the illusion of simultaneous execution of all processes. In actuality, the operating system must save the partial state of execution of each process that has exhausted its cyclical processor time allocation before loading the next process' state of execution. The constant save and load operations are the reason for the time-consuming overhead associated with a process-driven architecture. In addition, to ensure that a process does not read from or write to a file as another process attempts to perform the same operation, the processes must communicate with each other and must be synchronized. To resolve the problem of increased overhead, a thread-driven architecture may be employed. A thread, otherwise known as a lightweight process, is one of potentially many sub-processes that may run concurrently to perform a task. A thread-driven architecture reduces overhead by reducing the amount of information regarding the state of execution of a process that has to be saved and loaded into memory by sharing sections of the same memory areas with other lightweight processes. A new server-side addition to the Java programming language known as Java servlets has been recently developed by Sun Microsystems to replace the old process-driven architecture with the efficient thread-driven approach. Servlets are programs that serve as permanent extensions to the functionality of a web server. When a web server receives a user request, instead of generating a new process to handle the request, a servlet running on the web server spawns a thread to handle it, thereby resolving the problem of increased overhead. To resolve the problem of increased demand for synchronization and interprocess communication, the Java programming language contains built-in synchronization utilities that facilitate the development of simpler data-sharing schemes. Hence, RODAN’s adoption of the latest release of the Java platform, Java 2, permits it to effectively resolve all the problems associated with an increase in its number of users and the amount of archived data available. In addition, it also allows for the robust development of a multi-tier system with Java's RMI (Remote Method Invocation) technology. Java's RMI packages are a set
of classes (libraries) each comprising of a set of variables and methods (functions) that permit the invocation of methods on remote computers from a local computer. This functionality permits an intermediate multithreaded application server (servlet) to process and retrieve data located on a separate server and deliver it to a web browser thereby completing a three-tier architecture. The primary advantage of such a system is that once the servlet-database infrastructure is built, any number of clients can be easily constructed to communicate with the database through the servlet interface. Moreover, Java 2’s 2-D and 3-D graphics capabilities also permit for the development of sophisticated imaging software. Most important, its "write once, run anywhere" philosophy promises easy sharing of codes with our colleagues. In the next section we will describe in detail RODAN’s architecture and the design of each module.
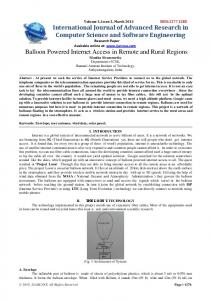
the Internet, completing a round of information flow. Function-wise, the system consists of a user-interface module, a central control module, a data (access and analysis) module, and a graphics module. In the following we will discuss each of them in detail.
3. THE DESIGN AND IMPLEMENTATION OF RODAN
The first interface is presented as HTML forms, managed by JavaScript programs. The resulting program runs smoothly in both Netscape Communicator and Internet Explorer on common desktop systems, which represent the source of most requests. The second one will be a Java Applet-powered user interface. It will have the extra flexibility of interacting directly with the data manipulation module without routing through the central control. The first interface provides a quicker first look at any data set, but it may only be used to retrieve static images. The second interface allows a user to modify the data plot before generating a final image, but requires more time to load over a network than the first interface.
3.1 User-interface module A good user-interface always constitutes a balanced consideration of functionality and accessibility. On the one hand, web designers and system engineers are eager to build highly interactive and resourcedemanding tools into a user interface. On the other hand, there is a vast disparity in system capacity and technical sophistication in the end-user sphere. To maximize both the functionality and accessibility of RODAN, we choose to support two user interfaces with various degrees of sophistication.
3.2 Central Control module Figure 1 Figure 1 illustrates RODAN's basic design and information flow pattern. RODAN is built in a multi-tiered framework with physically separated web and data server. This alleviates the burden on the web server and ensures scalability for future growth. User requests are issued on a web browser anywhere around the world, and are received by the central control program residing on the web server and implemented in the form of a Java servlet. The servlet decodes the requests and forwards them to the appropriate data server. The data server processes the requests and sends the resultant data stream back to the servlet via RMI. If the request is for server-side generated plots, the processed data are further forwarded to the graphics module, where 2-D or 3-D plots are rendered and sent back to the central control servlet. Finally, the central control servlet delivers the data and graphics product to the user via
The cardinal component of RODAN is the central control module, which delegates requests and responses between the user-interface module, data module and graphics module. The module is implemented in the Java Servlet API, a standard Java extension, which leads to RODAN's platform independence, scalability and efficiency (API stands for Application Programming Interface and refers to a programming library). As the Java servlet API is supported by over 30 web servers such as the widelyused (Netscape) iPlanet Web Server and Apache Web Server Jserv (http://java.sun.com/products/servlet/industry.html), a servlet-based system like RODAN could be easily adopted by other users who run different web servers and operating systems than ours. Meanwhile, a servlet can forward requests to other servers and servlets (http://java.sun.com/docs/books/tutorial/servlets/overvie w/index.html) and can also take advantage of RMI.
These technical advantages allow for partition of services over multiple servers based on task type and load balance. That is, particular servers may be used to handle particular types of requests and large tasks may be assigned to servers with smaller loads (less processes running). The practice, sometimes referred to as a multi-tiered approach, essentially makes the system more scalable for future growth. Using servlets also enhances system efficiency. Unlike CGI programs implemented in PERL, which have to be interpreted each time they are invoked, servlet programs only need to be compiled once and the resulting bytecodes loaded once into the web server when it is first started. More important, the multithreaded approach taken here reduces response time in two ways. The servlet program is run in a multithread mode, serving multiple user requests concurrently. Second, for each user request, we implement data accessing, plotting, and transporting in different threads, increasing efficiency in data sharing. In short, with servlets, our system is more transferable, scalable, and efficient.
VisAD is in use "for interactive and collaborative visualization and analysis of numerical data" (http://www.ssec.wisc.edu/~billh/visad.html) in numerous large-scale academic projects. It is currently in use to interactively analyze meteorology model output in the JMET Meteorology System (http://www.ssec.wisc.edu/pub/outgoing/jmet), to visualize cyclic temporal phenomena and collaborate over the internet in the Collaborative Geographic Visualization project at Penn State (http://www.GeoVISTA.psu.edu/collaborative.html), and in automated land mine detection at the Swiss Federal Institute (http://dmawww.epfl.ch/~roehrl/mines.html).
3.4 Graphics Module
There are multiple reasons for the choice of VisAD as RODAN's underlying graphics library. First and foremost, VisAD is written in JAVA and hence preserves RODAN's JAVA based features of platform independence, developer extensibility and multithreaded and distributed object computing. That is, the graphics module may be ported to any platform, and its functionality easily extended for specific uses, in a computationally efficient programming environment. Second, VisAD has a mathematical data model that is capable of accommodating an extremely wide variety of numerical data. Third, VisAD supports transparent access to data, independent of whether the data are stored in a netCDF, HDF-5, FITS, HDF-EOS, McIDAS, Vis5D, GIF or JPEG file or as a JAVA serialized object. So data in these formats may be directly used with builtin VisAD methods. Fourth, VisAD is capable of generating interactive 2-D and 3-D displays with multiple data views. RODAN's graphics module uses Java 2D, 3D and Advanced Imaging to further extend VisAD's 2-D and 3-D capabilities with geometric transformation algorithms that permit image translation, rotation and scaling. The images may also be cropped, filtered or interpolated. Fifth, VisAD has several built-in interactive GUI objects to enhance data analysis and visualization. Again, RODAN extends VisAD's functionality in this area with intuitive Swing-based GUIs. The sixth and final reason is that, VisAD is a free software package, just as the rest of the JAVA 2 APIs in use by RODAN's graphics module, thus making the module freely distributable.
The graphics module employed by RODAN is based on a JAVA software library named VisAD (Visualization for Algorithm Development) (http://www.ssec.wisc.edu/~billh/visad.html). All extensions to VisAD's functionality in use by RODAN's graphics module are implemented with the state of the art JAVA 2D, 3D, Advanced Imaging and Swing APIs. The Java Advanced Imaging API is used to generate and transform images. The Swing API is used to generate the graphical user interfaces.
The RODAN graphics module has three simple implementations, two as standalone applications and the other as an applet. A standalone application is the familiar type of program that someone executes on his or her local computer. An applet is a program stored on a Web server that is loaded and executed on a Web browser within the context of a Web page. The difference between the applet and the application versions of the graphics module is that the applet does not support 3-D rendering.
3.3 Data Access and Analysis Module
This module, upon receiving data requests from the central control, searches the data reservoir for user-specified data and performs specific data analysis. The analyses supported include simple time-averaging and wave analysis. The module, as others, is implemented in Java 2, and communication with the central control is handled with RMI. Implementation in RMI is forward-looking in the sense that if more than one data provider uses RODAN or similar systems in the future, analyses could be easily performed over multiple data sets from diverse sources and new value-added data could be produced. Java's security system further ensures the robustness of accessing data across a network and therefore validates the use of RMI.
The HTML and JavaScript based web interface makes use of an application implementation. All requests made using this interface are for static images that are generated on the server by the graphics application and delivered via the servlet to the client. Hence, this application implementation is used when a user wants to quickly visualize a data set. As this implementation interacts solely with the servlet, it does not have a GUI (graphical user interface). The applet-powered interface allows the user to tailor the data plots to his/her needs. It is used when a user needs to analyze the data and interact with the data plots. Since applets are inherently slower to load over a web browser, a user may install the second application implementation of the graphics module on their computer. This application provides a GUI (graphical user interface) that may be used to generate and interact with data plots. Once a user retrieves the data from RODAN, they may invoke the graphics module locally and not suffer the delays associated with slower applet load time. Whatever option the user chooses, they will be able to generate 2-D spatial and time-series plots in the applet implementation, with the extra functionality of 3-D volume renderings in the application implementation.
4.
CONCLUSION
RODAN is a web-interfaced data management and analysis system with a multithreaded, multi-tiered architecture, powered by advanced Java 2 technology. It supports universal access to data searching, retrieving, analyzing, and plotting in one web-based user interface. It has provided valuable services to researchers in marine and coastal sciences. RODAN, as stands at this moment, is an integrated system for data management, analysis, visualization and retrieval. Besides satisfying institutewide data management needs, the design and implementation would serve as a reference for other data providers who are considering similar systems. Meanwhile, the distributed architecture adapted for RODAN makes it well-positioned to embrace new technology development and community-wide protocols and standards.
5. REFERENCES Grassle, J.F., Glenn S.M. and C. von Alt, 1998: Ocean observing systems for marine habitats. OCC ’98 Proceedings, Marine Technology Society, November, 567-570. Glenn, S.M., W. Boicourt, B. P. and T.D. Dickey, 1999: Operational observation networks for ports, a large estuary and an open shelf. Oceanography, 13, No, 12-23.