Journal of Educational Psychology 1996, Vol. 88, No. 1, 144-161
Copyright 1996 by the American Psychological Association, Inc. 0022-0663/967$3.00
Role of Examples in How Students Learn to Categorize Statistics Word Problems Jill L. Quilici and Richard E. Mayer University of California, Santa Barbara In Experiment 1, students who studied example word problems that were grouped by t test, correlation, and chi-square were more likely to sort subsequent problems on the basis of structure and less likely to sort on the basis of surface characteristics than students who received no examples. In Experiment 2, this pattern was strongest when students studied structure-emphasizing rather man surface-emphasizing examples. In Experiment 3, students who studied and practiced 4 structure-emphasizing worked-out examples of t test and correlation problems were more likely to apply the appropriate statistical test correctly to subsequently presented statistics word problems than students who had studied surfaceemphasizing examples. This pattern was strong for lower but not for higher ability students. Implications of a schema construction theory are discussed.
Students in introductory statistics courses are expected to solve a variety of word problems that require using procedures such as t test, chi-square, or correlation. Although students may learn how to use these kinds of statistical procedures, a major challenge is to learn when to use them. According to theories of analogical reasoning, when people are confronted with a new problem, they search their memory for a similar problem to guide their solution of the new problem (Gentner, 1983; Mayer, 1992; Novick & Holyoak, 1991; Reed, 1987; Vosniadou & Ortony, 1989). The search for a similar problem may be based on surface features, such as the specific story line in the problems, or on structural features, such as the underlying mathematical procedures needed to solve the problems. Although surface features generally are more salient than structural features for inexperienced problem solvers, successful analogical transfer (Holyoak & Koh, 1987; Novick, 1988) and schema formation (Mayer, 1981, 1982) depend on recognizing structural similarities among problems. For example, successful problem solvers are more likely to sort problems on the basis of their structural problem type than are unsuccessful problem solvers (Chi, Feltovich, & Glaser, 1981; Silver, 1981). People often fail to recognize spontaneously structural similarities between a problem they know and a new problem that could be solved using the same procedure (Holyoak & Koh, 1987; Reed, Ernst, & Banerji, 1974). Furthermore, to construct the structural features of a type of story problem, people may need experience with several examples couched in different surface stories (Gick & Holyoak, 1980, 1983). The present study examines the role of examples in students' categorization of statistics word problems. For example, when students in an introductory statistics course are
confronted with a statistics problem such as the following, they must determine which statistical test is appropriate (e.g., t test) and they must apply the procedure for this test.
Correspondence concerning this article should be addressed to either Jill L. Quilici or Richard E. Mayer, Department of Psychology, University of California, Santa Barbara, California 93106. Electronic mail may be sent via Internet to
[email protected] or
[email protected].
When a student is confronted with a statistics word problem that he or she cannot immediately solve (which can be called the target problem), a popular strategy is to think of a related problem that the student knows how to solve (which can be called the source problem). Then, the student
A personnel expert wishes to determine whether experienced typists are able to type faster than inexperienced typists. Six experienced typists (i.e., with 5 or more years of experience) and 6 inexperienced typists (i.e., with less than 5 years of experience) are given a typing test. The average number of words typed per minute for each of the experienced typists were 70, 60, 55, 59, 68, and 66 while the average number of words typed per minute for each of the inexperienced typists were 50, 43, 59, 47, 60, and 65. In this case, the student may determine how to solve this problem by trying to remember a related problem. An important instructional device for teaching students how to solve mathematical problems is the use of examples (Anderson, 1993; Catrambone, 1994; Cooper & Sweller, 1987; Reed, Dempster, & Ettinger, 1985; Zhu & Simon, 1987). Chi, Bassok, Lewis, Reimann, and Glaser (1989) have shown how successful problem solvers use examples in learning and solving word problems. Although relatively little research has focused on the role of examples in learning to solve statistics word problems, research on how to help students learn to solve statistics problems is becoming recognized as an important area (Catrambone, 1995; Catrambone & Holyoak, 1990; Paas, 1992). This study is concerned with using examples to help students recognize which problems require which tests, such as tests of means and correlations, rather than using examples to help students learn how to compute statistical tests. The Role of Examples in Thinking by Analogy
144
STATISTICS WORD PROBLEMS must map a solution method from the source problem to the target problem, sometimes using a solution method abstracted from the source problem. This scenario involves analogical reasoning because the student must build an analogy between the source and target problems (Gentner, 1989; Holyoak, 1985; Mayer, 1992; Ross, 1987; Vosniadou & Ortony, 1989). Thinking by analogy has long been recognized by educators as an effective technique for facilitating mathematical problem solving. The famous mathematics educator George Polya (1945/1957) observed that "analogy pervades all our thinking" (p. 37). Consequently, his treatise on mathematical problem-solving techniques calls on students to ask, "Do you know a related problem?" (Polya, 1945/1957, p. 9). According to Polya, the process of devising a solution plan depends on remembering and using an appropriate related problem. Similarly, Schoenfeld (1985) suggests the following problem-solving strategy: "If you cannot solve the original problem, try first to solve an easier, related problem. Look for known solutions to related problems" (p. 86). According to Ross (1987, 1989), when students are confronted with a statistics problem to solve (i.e., target problem), they are reminded of an earlier problem from the domain (i.e., source problem). In some cases students may use similarities in surface features both to access and to use a source problem in solving the target problem, whereas in other cases they may rely on surface similarities in accessing but not in using a source problem. Our study differs from Ross's work because (a) we examine only the issue of how similarities between problems affect the accessing of a source problem (as measured by categorization tasks), whereas Ross examined both accessing and use (as measured in problem-solving tasks), and (b) we focus on structure-emphasizing techniques, whereas Ross focused on the role of surface features. Recently, the study of analogical problem solving has become an exciting venue for research in cognitive science (Catrambone & Holyoak, 1989; Cummins, 1992; Gentner, 1983, 1989; Holyoak, 1985; Mayer, 1992; Reed, 1987, 1989; Reed, Ackinclose, & Voss, 1990; Ross, 1987, 1989; Ross & Kennedy, 1990; Vosniadou & Ortony, 1989). The picture that is emerging from cognitive studies of analogical problem solving is that thinking by analogy involves three processes: recognition, in which a problem solver finds a source problem that is similar to a target problem; mapping, in which a problem solver applies the solution method or principle to the target problem; and abstraction, in which a problem solver abstracts a solution method or principle from the source problem (although Ross, 1987, 1989, has shown that analogical reasoning can occur without abstraction taking place). Impediments to successful problem solving can occur at any of the three processing stages in analogical problem solving, but we have chosen to focus on the recognition process for the purposes of this article. The recognition process depends on the problem solver recognizing a similarity between the problem that he or she is working on (i.e., the target problem) and a related problem that he or she is able to solve (i.e., the source problem). Two techniques
145
for recognizing similarities between problems are to focus on surface similarity and to focus on structural similarity (Vosniadou & Ortony, 1989). Surface similarity depends on shared attributes of objects in the problems and is derived from aspects of the cover story, whereas structural similarity depends on shared relations among objects and determines aspects of the required solution procedure. The 12 statistics word problems in Table 1 help to exemplify our conceptions of surface and structural similarity in the domain of introductory statistics. On the basis of structural features, (a) the problems labeled t-1, t-2, t-3, and t-4 share a common structure in that each involves two independent groups as the independent variable and a quantitative measure as the dependent variable, and thus each requires a two-sample t test of means; (b) the problems labeled x-1, x-2, x-3, and x-4 share a common structure in that each involves two independent groups as the independent variable and a categorical measure as the dependent variable, and thus each requires a two-sample chi-square test of proportions; and (c) the problems labeled r-1, r-2, r-3, and r-4 share a common structure in that each involves one group with two quantitative variables, and thus each requires a one-sample test of correlation. The last two columns of Table 2 summarize the major structure features of the f-test, chi-square, and correlation problems listed in Table 1. We use the terms t test, chi-square, and correlation, respectively, to refer to a two-sample test of means, a two-sample test of proportions, and a one-sample test of correlation. It also should be noted that the structural features of the correlation problems in Table 2 could be interpreted as characteristics of one-sample test of means problems. If both one- and two-sample test of means problems had been included in this study, the students would have needed to consider additional structural features. In contrast, an analysis of the surface features of the 12 problems in Table 1 reveals that (a) problems t-1, x-1, and r-1 share a common set of surface features in that each involves the experience of typists as the independent variable and typing speed as the dependent variable and is derived from a cover story about experience and typing speed; (b) problems t-2, x-2, and r-2 share a common set of surface features in that each involves average annual temperature as the independent variable and annual rainfall as the dependent variable and is derived from a cover story about temperature and precipitation; (c) problems t-3, x-3, and r-3 share a common set of surface features in that each involves amount of sleep as the independent variable and number of errors on a test as the dependent variable and is derived from a cover story about fatigue and mental alertness; and (d) problems t-4, x-4, and r-4 share a common set of surface features in that each involves reading score as the independent variable and grade point average as the dependent variable and is derived from a cover story about reading skill and school grades. The first two columns of Table 2 summarize the major surface features of the typing, rainfall, sleep, and reading ability problems listed in Table 1.
146
QUILICI AND MAYER Table 1 Twelve Sorting Problems Used in Experiments 1 and 2 Item t-1
Problem
A personnel expert wishes to determine whether experienced typists are able to type faster than inexperienced typists. Twenty experienced typists (i.e., with 5 or more years of experience) and 20 inexperienced typists (i.e., with less than 5 years of experience) are given a typing test. Each typist's average number of words typed per minute is recorded. t-2 After examining weather data for the last 50 years, a meteorologist claims that the annual precipitation is greater in years with below average temperature than in years with above average temperature. She notes the annual rainfall for each of 25 years that had above average temperatures as well as 25 years that had below average temperatures. t-3 A psychologist tests the hypothesis that fatigue affects mental alertness. An attention test is prepared which requires subjects to sit in front of a blank TV screen and press a response button each time a dot appears on the screen. A total of 110 dots are presented during a 90-minute period, and the psychologist records the number of errors for each subject. Two groups of subjects are selected. The first group of 10 subjects is tested after they have been kept awake for 24 hours. The second group of 10 subjects is tested in the morning after a full night's sleep. t-4 A college dean claims that good readers earn better grades than poor readers. The grade point averages (GPA) are recorded for 50 first-year students who scored high on a reading comprehension test and for 50 first-year students who scored low on a reading comprehension test. x-1 A personnel expert wishes to determine whether or not experienced typists are likely to be fast typists and inexperienced typists are more likely to be slow typists. Twenty experienced typists (i.e., with 5 or more years of experience) and 20 inexperienced typists (i.e., with less than 5 years of experience) are given a typing test. Based on the test, each typist is classified as fast or slow. x-2 After examining weather data for the last 50 years, a meteorologist claims that the annual precipitation is more likely to be above average in years when the temperature is above average than when temperature is below average. For each of 50 years, she notes whether the annual rainfall is above or below average and whether the temperature is above or below average. x-3 A psychologist tests the hypothesis that people who are fatigued also lack mental alertness. An attention test is prepared which requires subjects to sit in front of a blank TV screen and press a response button each time a dot appears on the screen. A total of 110 dots are presented during a 90-minute period, and the psychologist records the number of errors for each subject. Twenty subjects are selected; half are tested after being kept awake for 24 hours, and half are tested in the morning after a full night's sleep. Based on their number of errors on the test, each subject is also labeled as high or low in mental alertness. x-4 A college dean claims that a group of good readers contains more honors students than a group of poor readers. For each of 100 first-year college students, a reading comprehension test was used to determine whether the student was a good or poor reader and grade point average (GPA) was used to determine whether or not the student was an honors student. r-1 A personnel expert wishes to determine whether typing experience goes with faster typing speeds. Forty typists are asked to report how many years they have worked as typists and are given a typing test to determine their average number of words typed per minute. r-2 After examining weather data for the last 50 years, a meteorologist claims that the annual precipitation varies with average temperature. For each of 50 years, she notes the annual rainfall and average temperature. r-3 A psychologist tests the hypothesis that fatigue is related to mental alertness. An attention test is prepared which requires subjects to sit in front of a blank TV screen and press a response button each time a dot appears on the screen. A total of 110 dots are presented during a 90-minute period, and the psychologist records the number of errors for each subject. Twenty subjects are given this test, each with a different number of hours since they woke up (ranging from 1 to 20). r-4 A college dean claims that scores on a reading comprehension test predict college grades. The grade point averages (GPA) and reading comprehension scores are recorded for 100 first-year students. Note. Each letter-number pair represents a sorting problem: t = t test, x = chi-square, r = correlation; 1 = cover story about experience and typing speed; 2 = cover story about temperature and precipitation; 3 = cover story about fatigue and mental alertness; 4 = cover story about reading skill and grade point average.
147
STATISTICS WORD PROBLEMS
Table 2 Surface and Structural Features of 12 Problems Surface features Problem t-1 t-2 t-3 t-4 x-1 x-2 x-3 x-4 r-1 r-2
Structural features
Independent variable
Dependent variable
Independent variable
Dependent variable
Experience of typists Average yearly temperature Amount of sleep Reading score
Words typed per minute Annual rainfall
2 independent groups 2 independent groups 2 independent groups 2 independent groups 2 independent groups 2 independent groups 2 independent groups 2 independent groups 1 group
Quantitative
1 group
Quantitative
1 group
Quantitative
1 group
Quantitative
Experience of typists Average yearly temperature Amount of sleep Reading score Experience of typists Average yearly
Number of errors on test Grade point average Words typed per minute Annual rainfall Number of errors on test Grade point average Words typed per minute Annual rainfall
Quantitative Quantitative Quantitative Categorical Categorical Categorical Categorical Quantitative
l"p iriTwr!) In rp
r-3 r-4
Amount of sleep Reading score
Number of errors on test Grade point average
Schema Construction Theory Our research is motivated by schema construction theory, in which schematic knowledge is a fundamental component of mathematical problem-solving expertise (Chi, Feltovich, & Glaser, 1981; Mayer, 1992; Silver, 1981). Schematic knowledge refers to knowledge of problem types and can be evaluated through sorting tasks (Chi, Feltovich, & Glaser, 1981; Cummins, 1992; Hinsley, Hayes, & Simon, 1977; Mayer, 1981,1982; Riley, Greeno, & Heller, 1983; Schoenfeld & Hermann, 1982; Silver, 1981). For example, expertise in statistics problem solving includes knowledge that allows a person to distinguish among Mest, chi-square, and correlation problems, as would be indicated by sorting problems into categories. Research on expertise suggests that people construct increasingly more accurate problem schemas as they gain more experience in a domain. In particular, experts are more likely to sort problems on the basis of structural features and less likely to sort on the basis of surface features compared to novices. If the construction of structure-based problem schemas is a component of successful problem solving in a domain, one might reasonably ask how the process of schema construction can be promoted. Research on analogical reasoning and learning from examples suggests that experience with example problems can promote the construction of structurebased problem schemas (Reed & Bolstad, 1991; Sweller & Cooper, 1985; Ward & Sweller, 1990; Zhu & Simon, 1987) and that experience with more than one example of a problem type may be necessary for the spontaneous construction of structure-based problem schemas (Gick &
Holyoak, 1980, 1983). Sorting tasks have been used as a way of assessing the degree to which students possess structure-based schemas for problems (Chi, Feltovich, & Glaser, 1981; Cummins, 1992; Hinsley, Hayes, & Simon, 1977; Silver, 1981). In our research, we tested the prediction that students who are exposed to examples of statistics word problems (e.g., Mest, chi-square, and correlation problems) are more likely to sort subsequently presented problems on the basis of structure and less likely to sort on the basis of surface features compared to students who receive no example problems. In addition, we tested a secondary prediction mat students who are exposed to several examples of each type of statistics word problem are more likely to sort subsequently presented problems on the basis of structural features and less likely to sort on the basis of surface features compared to students who receive only one example of each type. These predictions are addressed in Experiment 1. Another important goal of the present project was to identify conditions under which exposure to examples is most likely to promote the construction of problem schemas, as measured by sorting or categorization performance. Some example sets (which we call "surface-emphasizing") confound surface and structural features of problems by using the same surface story for all problems of a given type. Some example sets (which we call "structure-emphasizing") control for surface and structural features by using a different surface story for each problem of a given type. If surface features are more salient to inexperienced problem solvers than are structural features, then inexperienced prob-
148
QUILICI AND MAYER
lem solvers should focus primarily on surface features in a situation in which surface and structural features are confounded, that is, in the surface-emphasizing condition. In contrast, in the structure-emphasizing condition, the influence of surface features is reduced by using the same collection of surface stories in the problems of each type. In this situation, problem solvers must recognize that surface characteristics are not good predictors of group membership and will therefore focus on other characteristics distinguishing the problem types, namely, structural features. We propose that structure-emphasizing example sets are more likely to promote schema construction on the basis of problem type than are surface-emphasizing example sets. Thus, we predicted that students who were exposed to structure-emphasizing examples would be more likely to sort subsequently presented problems on the basis of structural features and less likely to sort on the basis of surface features compared to students who were exposed to surfaceemphasizing examples. This prediction is addressed in Experiment 2 and, in an extended form, in Experiment 3. Finally, we considered the role of individual differences in problem schema construction. We hypothesized that higher ability students would be more likely to focus on structural features of problems, whereas lower ability students would be more likely to focus on surface features of problems. Thus, we predicted that higher ability students would be more likely to construct structure-based schemas from examples regardless of whether or not structural and surface features are confounded, whereas lower ability students would be more likely to construct structure-based schemas from structure-emphasizing examples than from surface-emphasizing examples. This prediction was examined in Experiment 3.
Experiment 1 Experiment 1 explored the effect of examples on how students sort statistics word problems. When asked to sort a set of statistics word problems, students may use either surface characteristics, such as placing problems with the same cover story in the same category, or structural characteristics, such as placing problems requiring the same statistical test in the same category. Research on expertise in solving mathematics and physics word problems has shown that experts are more likely to focus on structure and less likely to focus on surface characteristics of problems than are novices (Chi, Feltovich, & Glaser, 1981; Silver, 1981). According to schema construction theory, exposure to multiple examples of each problem type (e.g., Mest, chisquare, and correlation problems) can foster the development of structure-based schemas. In contrast, statisticsnaive students who have had no exposure to example problems may be more likely to use surface rather than structural characteristics in categorizing a set of statistics word problems. Novices who receive only one example of each problem type may perform intermediate between these groups, being more likely to use structural features than students receiving no examples and less likely to use structural
features than students receiving multiple examples of each problem type. Experiment 1 explored the hypothesis that statistics-naive students who are given examples of three structurally different types of statistics word problems will be more likely than equivalent students receiving no examples to abstract the underlying structure, as indicated in a subsequent sorting task. In particular, we predicted that students who were exposed to example problems for each of three problem types would be more likely to sort subsequently presented problems on the basis of structure and less likely to sort on the basis of surface features compared to students who were not exposed to example problems. We also predicted that students who received three example problems for each of three problem types would be more likely to sort subsequently presented problems on the basis of structural features and less likely to sort on the basis of surface features compared to students who were exposed to only one example problem for each of the three problem types.
Method Participants and design. The participants were 81 college students who had little or no knowledge about statistics (as indicated by their reporting on a questionnaire that they had never taken a statistics course or that they had taken an introductory level statistics course). Twenty-seven students served in the no-example group, 27 students served in the one-example group, and 27 students served in the three-example group. In addition to these 81 participants, we tested 5 other participants. However, data for these participants were eliminated because the participants failed to follow instructions. Materials. The materials consisted of a questionnaire, a set of three example sheets each containing three examples, a set of three example sheets each containing one example, and a deck of 12 problem cards.1 The questionnaire was an 8.5- X 11-in. sheet containing questions requesting the age, gender, academic major, year in school, and SAT scores of the participant, and a list of any mathematics and statistics courses taken. The one-example set contained three 8.5- X 11-in. sheets of paper with one example problem on each sheet, namely, one Mest, one chi-square, and one correlation problem, respectively. The three-example set contained three 8.5- X 11-in. sheets of paper with three example problems of the same type on each sheet, namely, three Mest, three correlation, and three chi-square problems, respectively. The surface stories for the example problems were different from one another and from the problem cards used on the sorting test. Examples are listed in Table 3. The problem cards consisted of twelve 3- X 5-in. index cards with a statistics problem typed on each card. The problems were generated by completing each cell of a 3 X 4 design, with the first factor being structural characteristics it test, chi-square, and correlation) and the second factor being surface characteristics (typing, weather, mental fatigue, and reading). The 12 problems are listed in Table 1. Procedure. Students were tested in groups of 5 or fewer per 1 In Experiment 1, nine versions of the one-example and nine versions of the three-example materials were constructed to counterbalance the effects of surface story, and three participants in the one-example and three-example groups received each version.
STATISTICS WORD PROBLEMS
149
Table 3 Sample Sets of Example Sheets for the One-Example and Three-Example Groups in Experiment 1 One-example (-test sheet A school board would like to test the assertion that employees who have more years of experience in the district are absent more days that those who have worked fewer years. Two hundred school employees are asked whether they have worked for the district less than 10 years or more than 10 years and are asked to report how many days they were absent last year. One-example chi-square sheet A drug company wishes to determine whether a high dosage of pain reliever is related to fast relief of pain. Fifteen headache sufferers are given a low dosage and 15 are given a high dosage of pain reliever. For each person, a record is made of whether the pain reliever worked fast (i.e., within 30 minutes) or not. One-example correlation sheet An instructor believes that the more time that students study, the better their grade will be. He asks 30 of his students to record how many hours they spend studying in a month. He also records the course grade for each student on a scale from 0 (for F) to 4 (for A). Three-example f-test sheet A drug company wishes to determine whether extra-strength pain reliever ends headaches faster than regular-strength pain reliever. Fifteen headache sufferers are given extrastrength dosage and 15 other headache sufferers are given the regular-strength dosage. For each person, a record is made of the length of time from administration of the pain reliever to the first indication of relief from pain. A health researcher wants to determine whether extroverts smoke fewer cigarettes than introverts. Fifty people who score high in extroversion and 50 people who score low in extroversion on a standard personality inventory are asked to report how many cigarettes they smoke per day. A researcher proposes that college graduates have more free time than high school graduates. Twenty-five high school graduates and 25 college graduates are asked to complete a survey detailing the number of hours of free time each person has in a week. Three-example chi-square sheet An instructor believes that successful students are more likely to study a lot and unsuccessful students are more likely to study a little. Based on their course grades, she identifies 15 of her students who are successful and 15 who are unsuccessful. Of these, she identifies which students reported studying less than one hour per day and which students reported studying one or more hours per day. A marriage counselor wishes to test her idea that couples who have been married for a short time (i.e., less than 5 years) are more likely to spend their free time together than those who have been married a long time (i.e., 10 years or more). Twenty-five couples who have been married a short time and 25 couples who have been married a long time are sorted as spending much free time together (i.e., more than 50%) or as spending little free time together (i.e., 50% or less). A principal wishes to determine whether tall children are over-represented among aboveaverage intelligence children and short children are over-represented among belowaverage intelligence children. Twenty children who scored below average and 20 children who scored above average on the Wechsler Intelligence Scale for Children (WISC) were categorized as below average or above average in height. Three-example correlation sheet A school board would like to test the assertion that the number of days school employees are absent varies with the number of years of employment in the school district. Two hundred employees are asked to report how many years they have worked for the school district and how many days they were absent last year. A marketing researcher suspects that the more people read newsmagazines the more likely they are to earn a higher income. Forty people are asked to report their annual income for last year as well as the number of issues of Time and/or Newsweek they read each month. A restaurant owner wants to determine whether fast service is related to tips. Time is measured beginning when the customers are seated and ending when the customers' meals are brought to the table. Each server's average time and each server's total amount of tips earned that week are recorded.
session and were randomly assigned to a treatment group within each session. Each student was seated in a separate cubicle and had no contact with any other student during the session. First, students completed the questionnaire at their own rates. Second, students in
the three-example group received three sheets containing three Mest, three correlation, and three chi-square example problems, respectively; students in the one-example group received three example sheets containing one f-test, one correlation, and one
150
QUILICI AND MAYER
chi-square problem, respectively; and students in the no-example group received no example sheets. Then, with the example sheets still present, students in the one-example and three-example groups were asked to sort a deck of 12 problem cards into groups by placing each card on the example sheet it "best goes with." Students in the no-example group were asked to sort the same 12 problem cards into groups that "best went together." The problem cards were always given to participants in the same fixed order, subject to the constraint that there were never two cards in a row with either the same surface story or the same structural problem type.
Results and Discussion Are the groups equivalent in ability? An analysis of variance (ANOVA) conducted on the SAT scores of each participant indicated that the three groups did not differ significantly on SAT-mathematics (Ms = 573, 582, and 564 for one-example, three-example, and no-example groups, respectively), F < 1. Scoring. First, we computed a structure score for each participant by tallying the number of pairs of problems in each sorted group (with possible scores of 0 to 6 for each of three groups) that came from the same structure category (i.e., t test, correlation, or chi-square) and dividing that number by 18 (i.e., the highest possible number). Second, we computed a surface score for each participant by tallying the number of pairs of problems in each sorted group (with possible scores of 0 to 3 for each of four groups) that came from the same surface category (i.e., typing, precipitation, fatigue, or reading) and dividing that number by 12 (i.e., the highest possible number). Third, we classified each participant as structure-using if the participant's structure score was greater than or equal to the participant's surface score or as surface-using if the participant's surface score was greater than the participant's structure score. Fourth, for each group we tallied the number of times each pair of problems had been placed into the same category (i.e., ranging from 0 to 27 per pair); these data were used in cluster analyses performed for each group. Does experience with examples foster structural schema construction? Experiment 1 was designed to examine the hypothesis that experience with example problems fosters structural schema construction better than no experience and that experience with three examples fosters structural schema construction better than experience with one example. In particular, we predicted that students who studied grouped examples of each problem type (i.e., three-example and one-example groups) would be more likely to sort new problems on the basis of structural features than students who lacked this experience (no-example group) and that students who studied multiple examples of each problem type (i.e., three-example group) would be more likely to sort new problems on the basis of structural features than students who studied a single example of each problem type (i.e., one-example group). We found support for the hypothesis that giving students grouped examples of a problem type increases the likelihood that they would subsequently focus on structural rather
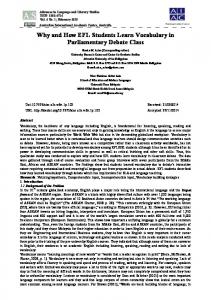
than surface features in sorting problems. First, an ANOVA performed on the structure scores revealed significant differences among the mean structure scores of the three groups, F(2, 78) = 35.929, MSE = .019, p < .001; furthermore, supplemental Tukey tests (with alpha equal to .05) indicated that the mean structure scores of the one-example (M = .323, SD = .162) and three-example (M = .327, SD = .135) groups were each significantly greater than the mean structure score of the no-example group (M = .049, SD = .113) but did not differ significantly from each other. Second, an ANOVA performed on the surface scores revealed significant differences among the mean surface scores of the three groups, F(2, 78) = 17.815, MSE = .085, p < .001; furthermore, supplemental Tukey tests (with alpha equal to .05) indicated that the mean surface scores of the one-example (M = .488, SD - .319) and three-example groups (M = .441, SD = .282) were each significantly less than the mean surface score of the no-example group (M = .873, SD = .27) but did not differ significantly from each other. Third, the proportion of participants in the one-example and three-example groups who predominantly used structure in sorting (25 out of 54) was significantly higher than in the no-example group (3 out of 27) on the basis of a chi-square test with Yates correction, ^ ( 1 ) = 8.358, p < .004. We collapsed the one-example and three-example groups together in this analysis because our main focus in Experiment 1 was on the role of examples and because no significant differences between the two groups were found in the foregoing two analyses. Fourth, hierarchical cluster analyses (Williams, Hill, & Vang, 1992) were performed on the tallies of the number of times each pair of test problems had been placed into the same category for each group. Figure 1 shows the resulting clusters for each group, indicating that the no-example group sorted on the basis of surface features, whereas the three-example and one-example groups showed some clustering on the basis of structure and some clustering on the basis of surface features. A useful way to view the clustering structures of each group is to focus on the first four or five clusters created with the constraint that no cluster contain more than four items. For example, in examining the first four clusters established by the no-example group, we find that each cluster contains three problems with the same surface feature, indicating that there is no clustering on the basis of problem structure. In contrast, in examining the first four clusters established by the three-example group, we find some clustering on the basis of structure such as r-2 and r-3; some clustering on the basis of both structure and surface, such as t-2, t-3, x-2, and x-3; and some clustering on the basis of surface features, such as x-1 and t-1 and r-4, x-4, and t-4. It is interesting that when students show signs of clustering on the basis of structure, they seem to be better able to distinguish correlation problems as a separate category (as indicated by the cluster containing r-2 and r-3) and more likely to confuse chi-square and Mest problems (as indicated by the cluster containing t-2, t-3, x-2, and x-3). Finally, the first four clusters established by the one-example group are mainly based on surface features,
STATISTICS WORD PROBLEMS
151
Three-Example r-1r-2r-3t-3x-3t-2x-2r-4x-4t-4x-1t-1One-Example t-3r-3x-3x-4t-4x-1t-1r-1" r-4t-2" r-2x-2-
t = 1-test r = correlation x = chi-square 1,2,3, and 4 = different surface stories
No-Example
Figure 1. Hierarchical cluster analysis results for three groups in Experiment 1. One centimeter equals 1 unit of Euclidean distance. Each letter-number pair represents a sorting problem: t = t test, x = chi-square, r = correlation; 1 = cover story about experience and typing speed, 2 = cover story about temperature and precipitation, 3 = cover story about fatigue and mental alertness, 4 = cover story about reading skill and grade point average.
with t-3, r-3, and x-3 clustered, x-4 and t-4 clustered, x-1, t-1, and r-1 clustered, and t-2, r-2, and x-2 clustered (along with r-4), whereas two problems of the same structural type are clustered in one category, namely, r-2 and r-4 (along with t-2 and x-2). Taken together, these results are consistent with our main hypothesis that statistics-naive students who are exposed to examples of various types of statistics problems are more likely to construct structure-based schemas of problem types than equivalent students who are not exposed to examples. However, these results are contrary to our secondary prediction that students receiving three examples of each problem type are more likely to sort subsequent problems on the basis of structural features and less likely to sort
problems on the basis of surface features than students receiving only one example of each problem type. Similarly, these results are not consistent with research by Gick and Holyoak (1983), who found that students receiving two examples of a problem type showed more evidence of structural schema construction than did students who received only one example. An important difference between our study and Gick and Holyoak's study is that students in our study were asked to categorize three types of problems, whereas students in Gick and Holyoak's study were tested on only one type of problem. In our study, when students sought to categorize three types of problems, they may have been encouraged to look for differences among the three problem types, which leads to structural schema construction in both the one-example and three-example groups. On
152
QUILICI AND MAYER
the other hand, in Gick and Holy oak's study, participants in the two-example group were asked to write a description of how the two examples were similar, which may have encouraged additional structural schema construction in the two-example group compared to the one-example group. We did not ask the three-example group to perform this type of comparison task in our study. As in our study, Ahn, Brewer, and Mooney (1992) found evidence for schema acquisition from a single example.
Experiment 2 The results of Experiment 1 provide evidence that exposure to examples of each of three types of statistics word problems (i.e., f test, chi-square, and correlation) can encourage students to focus more on structure and less on surface characteristics when they are confronted with new statistics word problems. However, all examples may not be equally effective in promoting structure-based schema construction, as indicated by an increased likelihood for students to focus on structural features of new statistics word problems. Experiment 2 explores the question of whether some examples are more likely to prime structure-based schema induction whereas others are more likely to prime surface-based schema construction. In particular, Experiment 2 was designed to pinpoint the conditions under which examples promote structure-based or surface-based schema construction. For the purposes of this experiment, we developed structure-emphasizing and surface-emphasizing example sets for f-test, chi-square, and correlation problems. In both example sets, there were three examples of f-test problems on one sheet, three examples of chi-square problems on a second sheet, and three examples of correlation on a third sheet. In the structure-emphasizing set, three different surface stories were used for the f-test problems (i.e., years of experience and number of days of absence by employees, personal income of subscribers to different magazines, and serving time in a business and amount of money earned), the same three surface stories were used for the chi-square problems, and the same three surface stories were used for the correlation problems. In short, the structure-emphasizing example set presented the same surface stories between problem types. We labeled this treatment structure-emphasizing because students could see that the common features of the problems on each sheet were not based on the surface story (e.g., the same stories are on different sheets) but rather were based on the structure of the problem (e.g., all the problems on a sheet required the same statistical test). In the surface-emphasizing set, the three f-test problems used the same surface story, but it was different from those used on the other sheets (e.g., years of work experience and number of days of absence by employees); the three chisquare problems used the same surface story, but it was different from those used on the other sheets (e.g., personal income of readers of different magazines); and the three correlation problems used the same surface story, but it was different from those used on the other sheets (e.g., serving
time in business and amount of money earned). In short, the surface-emphasizing example set presented the same surface stories within each problem type. We defined this treatment as surface-emphasizing because it confounds surface and structural features as the basis for categorizing problems, and we assumed that surface features would be more salient to statistics-naive students. We predicted that students who were exposed to structure-emphasizing example sets would be more likely to categorize subsequent statistics word problems on the basis of structural features, whereas students who were exposed to surface-emphasizing example sets or no examples would be more likely to categorize subsequent statistics word problems on the basis of surface features. Method Participants and design. The participants were 54 college students from the same participant pool as in Experiment 1. Eighteen students apiece served in the no-example, surface-emphasizing, and structure-emphasizing groups. Materials. The materials consisted of the same questionnaire and deck of 12 problem cards as in Experiment 1. In addition, there were two sets of example sheets: a surface-emphasizing set and a structure-emphasizing set.2 Both sets consisted of three 8.5- X 11-in. sheets, with each sheet containing three example problems; one sheet contained three Mest problems, one sheet contained three correlation problems, and one sheet contained three chisquare problems. For the surface-emphasizing set, the surface story was the same for all problems on a sheet but different from problems on other sheets. For the structure-emphasizing set, three different surface stories were represented on each sheet (e.g., three different surface stories for three f-test examples), but the same three surface stories were used on each sheet (e.g., the three surface stories used for t tests were also used for chi-square and for correlation). Thus, the surface-emphasizing set confounded structural and surface characteristics, whereas the structure-emphasizing set controlled for structural and surface characteristics. Procedure. The procedure corresponded to that used in Experiment 1 except that the surface-emphasizing group received the surface-emphasizing example set, the structure-emphasizing group received the structure-emphasizing example set, and the no-example group received no examples. The structure-emphasizing and surface-emphasizing groups were given the same sorting instructions as the one-example and three-example groups in Experiment 1, and the no-example group was given the same sorting instructions as the no-example group in Experiment 1. In addition, a short questionnaire was administered after the sorting task was completed, but the responses were so idiosyncratic that the data were not analyzed further.
Results and Discussion The groups were equivalent. An ANOVA conducted on the SAT scores of each participant indicated that the three 2
In Experiment 2, three versions of the surface-emphasizing and three versions of the structure-emphasizing materials were constructed to counterbalance the effects of surface story, and 6 participants in the surface-emphasizing and structure-emphasizing groups received each version.
153
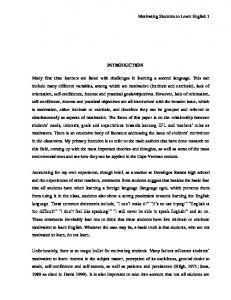
STATISTICS WORD PROBLEMS groups did not differ significantly on SAT-mathematics (Ms = 595, 586, and 595 for the structure-emphasizing, surface-emphasizing, and no-example groups, respectively), F < 1. Scoring. Scoring was identical to Experiment 1. Does experience with structure-emphasizing examples foster structural schema construction? Experiment 2 was designed to examine the hypothesis that experience with structure-emphasizing examples fosters structural schema construction better than experience with surface-emphasizing examples or no examples. In particular, we predicted that students in the structure-emphasizing group would be more likely to categorize test problems on the basis of structural characteristics than students in the surface-emphasizing or no-example group. We found support for this prediction. First, an ANOVA performed on the structure scores revealed significant differences among the mean structure scores of the three groups, F(2, 51) = 11.179, MSE = .046, p < .001; furthermore, supplemental Tukey tests (with alpha equal to .05) indicated that the structureemphasizing group (M = .497, SD = .174) sorted by structure significantly more than the surface-emphasizing (M = .318, SD = .149) and the no-example (M = .157, SD = .295) groups, which did not differ from each other. Second, an ANOVA performed on the surface scores revealed significant differences among the mean surface scores of the three groups, F(2, 51) = 16.980, MSE = .097, p < .001; furthermore, supplemental Tukey tests (with alpha equal to .05) indicated that the structure-emphasizing group (M = .176, SD = .166) sorted by surface significantly less than the surface-emphasizing (M = .560, SD = .336) and no-example (M = .773, SD = .389) groups, which did not differ significantly from each other. Third, the proportion of participants in the structureemphasizing group who predominantly used structure in sorting (16 out of 18) was significantly higher than in the surface-emphasizing and no-example groups (8 out of 36) based on a chi-square test with Yates correction, ^ ( 1 ) = 18.984, p < .001. We collapsed the no-example and surface-emphasizing groups together in this analysis because we were particularly interested in determining whether the structure-emphasizing treatment was more effective than other treatments in encouraging students to categorize problems on the basis of structure. Fourth, hierarchical cluster analyses were performed on the tallies of the number of times each pair of problems had been placed into the same category for each treatment group. Figure 2 shows the clusters that resulted from these analyses for each of the three treatment groups. As in our interpretation of Figure 1, we focused on the first few clusters created with the constraint that no cluster contain more than four problems. As predicted, the structureemphasizing group was more likely to sort on the basis of structure and less likely to sort on the basis of surface compared to the surface-emphasizing and no-example groups. For example, as in Experiment 1, the first four clusters formed by the no-example group each contained three problems with the same surface features, indicating that students in this group did not sort on the basis of
structure. In contrast, using the criterion of clusters containing no more than four problems, the structure-emphasizing group created only one cluster consisting of two chi-square (x-1 and x-2) and two r-test (t-2 and t-4) problems, indicating at least some clustering on the basis of structure. Eventually, after several more cycles, there were two clusters: one cluster containing all of the correlation problems and one cluster containing all of the chi-square and all of the f-test problems. Consistent with Experiment 1, there is some evidence that when students are sensitive to structure, they are better able to distinguish correlation problems as a separate category and are more likely to confuse chi-square and f-test problems. Finally, the surface-emphasizing group created only one somewhat random cluster containing r-1, t-4, r-2, and x-4. On each additional cycle more problems were added to the cluster, but other clusters did not emerge. Taken together, these results are consistent with the hypothesis that statistics-naive students who are exposed to multiple examples of various types of statistics problems are more likely to construct structure-based schemas of problem types than are equivalent students who are not exposed to examples, especially when the surface stories in the examples are the same across problem types rather than the same within problem types. These findings are also consistent with Paas and Van Merrienboer's (1994) finding that students learn more from highly variable examples than from examples that share highly similar surface features.
Experiment 3 A limitation of the foregoing experiments is that the experimental task is limited to sorting; therefore, Experiment 3 extended the investigation to a situation in which students learned to solve statistics word problems (e.g., t test and correlation) on the basis of structure-emphasizing or surface-emphasizing worked-out examples. In Experiment 3, the degree to which students focused on the structural features of problems was assessed by giving students a problem-solving test and noting which type of statistic they attempted to calculate for each problem. For example, the degree of structural schema construction would be indicated by the degree to which students attempted to calculate a f-test statistic for f-test problems and a correlation coefficient for correlation problems. Thus, in Experiment 3 we evaluate students' categorization of test problems indirectly by noting which type of statistical test was computed for each problem. We eliminated the chi-square test and reduced the number of example problems in Experiment 3 to keep the length and complexity of the study to a manageable level. Because Experiment 3 included an instructional component, it was much longer than Experiments 1 and 2. If we had retained the chi-square test and included three examples of each test in Experiment 3, students would have had to devote several more hours to the study. Given the brief nature of Experiment 3, we focused on two problem types—correlation and t test—that we suspected could be learned at least partially in a short time. In addition, the results of Experiments 1 and
154
QUILICI AND MAYER Structure-Emphasizing r-2 r-4 r-1 r-3 x-4 t-1 x-2 t-2 t-4 x-1 x-3 t-3
1
r
'
h H
Y Surface-Emphasizing
t-2 •
t-1 ' r-3 ' r-4 •
t = t-test r = correlation x = chi-square 1, 2, 3, and 4 = different surface stories
x-3 ' x-4 • r-2 • t-4 • r-1 • x-2 • x-1 • t-3 •
No-Example t-1 •
r-1 " x-1 • r-3 • x-3 • t-3 •
x-4 ' t-4 • r-4 •
t-2 ' r-2 • x-2 •
Figure 2. Hierarchical cluster analysis results for three groups in Experiment 2. Two centimeters equals 1 unit of Euclidean distance. Each letter-number pair represents a sorting problem: t = t test, x = chi-square, r = correlation; 1 = cover story about experience and typing speed, 2 = cover story about temperature and precipitation, 3 = cover story about fatigue and mental alertness, 4 = cover story about reading skill and grade point average.
2 and other studies suggested that two examples would be sufficient to replicate the structure-emphasizing treatment in Experiment 3. In Experiment 3, we tested three hypotheses concerning how experience with worked-out examples affects the strategies students use to categorize statistics word problems. Our first hypothesis concerned the quality of examples: Experience with structure-emphasizing worked-out examples fosters structural schema construction more than experience with surface-emphasizing worked-out examples, so that students who are given structure-emphasizing examples of each problem type (i.e., structure-emphasizing group) will be more likely to correctly categorize new problems than students who receive examples that emphasize surface features (i.e., surface-emphasizing group). To create struc-
ture-emphasizing examples of f-test and correlation problems, we used the same two surface stories (e.g., work experience and days absent, and serving speed and tips) to construct worked-out examples of each of the two problem types. To create surface-emphasizing examples of t test and correlation, we used two versions of one surface story for one problem type and two versions of another surface story for the other problem type. Our second hypothesis concerned the manner in which the examples are presented: Simultaneously presenting an example of each type of problem fosters structural schema construction better than presenting examples of the two problem types separately, so that students who experience two training sessions in which both problem types are presented simultaneously (i.e., mixed group) will be more
STATISTICS WORD PROBLEMS
155
likely to categorize new problems correctly than students who experience two training sessions, one for each problem type (i.e., blocked group). Our rationale for this prediction was that participants in the mixed group would have the opportunity to compare and contrast the two types of example problems, whereas the blocked group would not. Our third hypothesis concerned the mathematical ability of each subject: High mathematical ability as measured by the Scholastic Aptitude Test (SAT) enables structural schema construction better than average or low mathematical ability, so that students with high SAT scores in mathematics (i.e., higher ability group) will be more likely to categorize new problems correctly than students with average or low SAT scores in mathematics (i.e., lower-ability group). In short, we expected higher ability students to be more likely than lower ability students to possess the mathematical skill of paying attention to structurally important problem features. Therefore, we expected higher ability students to be able to recognize structural features regardless of instructional treatment, so that the predicted patterns (e.g., concerning structure-emphasizing vs. surface-emphasizing examples) would be strong for lower ability but not higher ability students. This pattern is consistent with research on attribute-by-treatment interactions (ATIs), in which less able students benefit more from well-structured instruction than do more able students (Mayer, 1987). Relevant ability data were not available for conducting a similar analysis in Experiments 1 and 2.
lation problems using Surface Story 2 in Part 2. The four practice problems had surface stories that were different from each other and from the example problems. The Appendix gives a worked-out example for a f-test problem and a correlation problem. The posttest set contained four sheets showing the step-by-step computations needed for r-test and correlation problems (without giving a surface story or sample question) and contained four problem sheets containing two f-test and two correlation problems. Each problem had a surface story that was different from the other test problems and from worked-out example and practice problems. Procedure. Each student worked individually in a separate cubicle, with up to 5 students being tested at a time. There was no contact among students, and treatments were randomly represented in each session. Each student was first given a questionnaire requesting information about his or her background in mathematics and statistics. On the basis of each student's reported SAT score in mathematics, students were then classified as higher if the score was above 575 and lower if the score was below 575. Students were then randomly assigned to a specific level of example quality and manner of presentation. Every student experienced the same basic procedure, consisting of two training sessions followed by a test session. During each training session, students first were given two examples of worked-out statistics problems to read for 8 min and then were given two practice problems to complete in 20 min with the aid of the examples. After the practice period, students were given the correctly worked-out solutions to the practice problems they had just completed, and they had 4 min to check their work. After a short break, students were given four test problems to complete, one at a time, with 8 min for each problem.
Method
Results and Discussion
Participants and design. The participants were 128 college students from the same participant pool as in Experiments 1 and 2. Sixteen students apiece served in the eight groups formed by crossing the three independent variables: example quality (structure emphasizing or surface emphasizing), manner of presentation (mixed or blocked), and mathematical ability (higher or lower). In addition to these 128 participants, 32 others were tested. However, the data from these participants were not analyzed either because the students did not give their math SAT score or because they did not attempt any of the practice problems. Materials. The materials consisted of a questionnaire, four instructional sets, and a posttest set.3 The questionnaire was identical to the one used in Experiments 1 and 2. The four instructional sets each contained the following sheets for Part 1: two worked-out examples involving t test, correlation, or both; two corresponding practice problems to solve; and worked-out solutions to the two practice problems. The same was true for Part 2. The structure-emphasizing/mixed set contained worked-out examples of t test and correlation using Surface Story 1 in Part 1 and worked-out examples of t test and correlation using Surface Story 2 in Part 2. The structure-emphasizing/blocked set contained worked-out examples of t test using Surface Stories 1 and 2 in Part 1 and worked-out examples of correlation using Surface Stories 1 and 2 in Part 2. The surface-emphasizing/mixed set contained worked-out examples of t test using Surface Story 1 and of correlation using Surface Story 2 in Part 1 and worked-out examples of t test using Surface Story 1 and of correlation using Surface Story 2 in Part 2. The surface-emphasizing/blocked booklet contained worked-out examples of two f-test problems using Surface Story 1 in Part 1 and worked-out examples of two corre-
Scoring. For each participant, we computed a classification score ranging from 0 to 4 by counting the number of test problems in which the participant chose the correct statistical test to perform regardless of whether or not the numerical answer was correctly computed. Table 4 summarizes the mean number of correctly classified test problems by treatment group and ability level. A three-way analysis of variance was performed on these scores using example quality, example arrangement, and mathematical ability as factors. Does experience with structure-emphasizing examples foster structural schema construction? We hypothesized that students who learn with worked-out examples in which the surface stories are the same across problem type are more likely to correctly categorize new problems than students who learn with worked-out examples in which the surface stories are the same within problem type. Consistent with our hypothesis, the mean number of test problems correctly categorized by the students receiving structureemphasizing instruction was significantly greater than the number correctly categorized by students who received surface-emphasizing instruction (Afs = 3.313 and 2.875, re3
In Experiment 3, there were counterbalanced versions of each instructional booklet to allow for counterbalancing of order of presentation and cover story, with an equal number of participants in each subgroup.
156
QUILICI AND MAYER
Table 4
Means and Standard Deviations Representing the Number of Correctly Classified Test Problems for Each Treatment Group and Mathematical Ability Level in Experiment 3 Mathematical ability Lower ability Treatment group Structure-emphasizing Mixed Blocked Surface-emphasizing Mixed Blocked
Higher ability
M
SD
M
SD
3.350 3.000
1.065 1.033
3.688 3.313
0.793 0.873
2.500 2.250
1.366 1.438
3.313 3.438
1.014 0.964
spectively, and SDs = .957 and 1.291, respectively), F ( l , 120) = 5.167, MSE = 1.185,/? < .05.
Does mixed presentation of examples of each problem type foster structural schema construction? We hypothesized that students who receive examples of both problem types presented together are more likely to correctly categorize new problems than students who learn about each problem type separately. Although the mean number of test problems correctly classified by the students receiving mixed examples was slightly greater than by students receiving blocked examples (Ms = 3.188 and 3.000, respectively, and SDs = 1.139 and 1.168, respectively), the difference failed to reach statistical significance, F < 1, and there were no statistically significant interactions between example arrangement and other variables. One possible explanation for the lack of significant difference between the two example arrangements is that both conditions foster structural schema construction but they do so in different ways. In the mixed condition, students have the opportunity to notice which features differ between problem types, whereas in the blocked condition, students have the opportunity to notice which features are the same within a problem type. How does mathematical ability affect schema construction for statistics problems? As predicted, the mean number of test problems correctly categorized by the higher ability students was significantly greater than by the lower ability students (Ms = 3.438 and 2.750, respectively, and SDs = .906 and 1.272, respectively), F(l, 120) = 12.759, MSE = 1.185, p < .01. Also consistent with predictions, lower ability students given structure-emphasizing examples correctly classified significantly more test problems than lower ability students given surface-emphasizing examples (Ms = 3.125 and 2.375, respectively, and SDs = 1.040 and 1.385, respectively), F(l, 60) = 5.870, MSE = 1.533, p < .05, whereas this pattern was not significant for higher ability students (Ms = 3.500 and 3.375, respectively, and SDs = .842 and .976, respectively), F < 1. These results are consistent with research reported by Novick (1988, 1992; Novick & Holyoak, 1991) in the domain of mathematical problem solving. In one study, for example, Novick (1988, Experiment 1) asked students to solve a target problem when a source problem (which
shared structural but not surface features with the target problem) was either present or absent. In particular, she compared the problem-solving performance of students who had lower mathematical ability with that of students who had higher mathematical ability. The results showed that higher ability students performed poorly when the source problem was absent but performed significantly better when the source problem was present. In contrast, lower ability students performed poorly regardless of whether the source problem was present or absent. Novick (1992) examined two alternative explanations for these findings. One explanation is that only the higher ability students were able to recognize the source problem as an analogue to the target problem. A second explanation is that both groups recognized the source problem as an analogue for the target problem but only the higher ability students were able to use the source problem to help solve the target problem. To differentiate between the two explanations, Novick (1992) reanalyzed data from a previous study (Novick & Holyoak, 1991) on the basis of students' scores on tests of mathematical ability. The results showed that when lower ability students were instructed to use the source problem to solve the target problem, they showed a significant improvement in problem-solving performance. This result is consistent with the view that lower ability students have more difficulty in recognizing a source problem as an analogue to a target problem than do higher ability students. Similarly, lower ability students in the current study had more difficulty in correctly categorizing test problems than did higher ability students, and this difficulty was reduced for lower ability students when the examples emphasized structural features.
Conclusions Recognizing a similarity between a target problem and a source problem is a fundamental cognitive process in solving problems by analogy. By focusing on statistics word problems, the present study opens a new line of research concerning the conditions under which inexperienced students rely on structural features or on surface features in judging problem similarities. In particular, our research pinpoints some conditions under which students are more likely to recognize that problems share common experimental designs (e.g., two independent groups and a quantitative dependent measure) and conditions under which students are more likely to recognize that problems share common cover stories (e.g., experience of typists and words typed per minute).
Summary of Major Findings Our research contributes to efforts to provide an account of the role of examples in how students learn to recognize similarities among problems. In particular, these experiments provide evidence consistent with three predictions of schema construction theory. First, group differences in sorting performance in Exper-
STATISTICS WORD PROBLEMS iment 1 suggest that exposure to examples promotes structural schema construction more than lack of such exposure. If inexperienced students tend to use surface features rather than structural features in making judgments about problem categorization, then the no-example group will tend to sort statistics problems on the basis of surface features rather than structural features. If exposure to examples of each structural type of problem increases the salience of structural features, then the one-example and three-example groups will tend to sort on the basis of structural features rather than surface features. Consistent with these predictions, in Experiment 1 students in the one-example and three-example groups were more likely to sort problems on the basis of structural features and were less likely to sort on the basis of surface features compared to students in the no-example group. Second, group differences in sorting performance in Experiment 2 and in categorization performance in Experiment 3 suggest that exposure to structure-emphasizing examples promotes structural schema construction more than exposure to surface-emphasizing examples. When three examples of each problem type are presented, structural features are emphasized if each of the three example problems for a given type comes from a different cover story but the same three cover stories are presented as examples for each problem type; in contrast, surface features are emphasized if all three example problems for a given type come from the same cover story but different cover stories are used to exemplify each problem type. Consistent with this prediction, students who were given structure-emphasizing examples were more likely to sort statistics word problems on the basis of structural features and were less likely to sort on the basis of surface features compared to students who received surface-emphasizing examples. Third, the categorization performance of students in Experiment 3 suggests that the foregoing pattern holds when the dependent measure is selection of a procedure for problem solving and that this pattern is strong for lower ability students but not for higher ability students. If lower ability students naturally tend to focus on surface features unless primed to do otherwise and higher ability students naturally tend to focus on structural features, then instructional manipulations aimed at increasing the salience of structural features will be more effective for lower ability than for higher ability students. The results of Experiment 3 confirm this prediction by showing that lower ability students in a structure-emphasizing condition are more likely to select solution procedures on the basis of structural features and less likely to base their judgments on surface features than lower ability students in a surface-emphasizing condition, whereas higher-ability students tended to base their judgments on structural features regardless of treatment condition. Overall, exposure to examples influences students' structural schema construction, especially when the examples emphasize structural characteristics rather than surface characteristics and when the students are lower in mathematical knowledge rather than higher in mathematical knowledge.
157
Theoretical Implications We examined two major theses in this study. First, success in categorizing elementary statistics problems by problem type depends on students' paying attention to the nature of two structural features of problems: whether the independent variable involves one or two independent groups and whether the dependent variable is quantitative or categorical. In short, our theory is that successful problem categorizers focus on two structural features of word problems rather than on two surface features of word problems. Although our results are consistent with this view, additional research is needed, including the use of verbal protocols. Second, success in categorizing elementary statistics problems can be improved by using techniques for presenting example problems that help students pay attention to structural features rather than to surface features. In particular, the principles underlying structure-emphasizing techniques involve arranging example problems so that (a) each problem type is exemplified by a battery of different cover stories that differ from one another and (b) the same battery of cover stories is used across problem types. Structureemphasizing techniques are effective because they demonstrate to students that a reliance on surface features does not work. When students see the same battery of cover stories used across problem types, they are more likely to notice that surface features are insufficient to distinguish among problem types. In searching for other distinguishing features, they are more likely to focus on structural features than are students who do not search for distinguishing features other than surface features. For example, consider the situation in Experiment 3: Surface-emphasizing students received two example f-test problems both couched in cover story A and two example correlation problems both couched in cover story B; structure-emphasizing students received two example f-test problems couched in cover stories A and B, respectively, and two example correlation problems couched in cover stories A and B, respectively. The nature of the cover story is a more salient feature in characterizing the problem types for the surface-emphasizing students, whereas the nature of structural features is more salient for the structure-emphasizing students. When confronted with a new problem to categorize, surface-emphasizing students are more likely than structure-emphasizing students to focus on similarities in story line, whereas structure-emphasizing students are more likely than surface-emphasizing students to focus on similarities in the structural characteristics of the independent and dependent variables. Our research is consistent with the premise that students are predisposed to use surface features for categorizing problems unless they are exposed to structure-emphasizing experiences.
Instructional Implications These results have implications for instructional activities aimed at helping students change from focusing on surface features to focusing on structural features when they seek to
158
QUILICI AND MAYER
recognize how one statistics word problem is similar to another. In particular, a major cognitive accomplishment of elementary statistics students may be to ignore the cover story in word problems and instead to focus on the experimental design and whether the variables are quantitative or categorical. It should be noted that the inexperienced students in our experiments were not necessarily enrolled in a statistics course, with at least some relevant background concepts and motivation; thus, whether or not these results would generalize to such students cannot be told. Our research suggests that when solving a statistics problem depends on "finding a related problem" (Polya, 1945/1957, p. 9), example-based instruction in recognizing the structural schemas of statistics word problems can be instrumental. First, our studies provide evidence that success at categorizing an elementary statistics word problem involving t test, chi-square, or correlation involves learning to pay attention to two critical features of the problem's structure, namely, whether the independent variable involves one or two groups and whether the dependent variable is quantitative or categorical. A straightforward instructional implication that warrants further study is that students would benefit from instruction and practice in identifying and describing the characteristics of the independent and dependent variables in elementary statistics word problems. For example, an instructional activity suggested by our study is to (a) present students with word problems; (b) ask them to specify the independent variable, whether the independent variable involves one or two groups, the dependent variable, and whether the dependent measure is categorical or quantitative; and (c) provide feedback consisting of worked-out examples showing in a step-by-step fashion how to answer these questions. Second, the cluster analyses results of Experiments 1 and 2 show a pattern in which students are more likely to confuse Mest and chi-square problems and more likely to see correlation problems as different from other problems. A practical implication of this finding is that students may need direct instruction in detecting the differences between Mest and chi-square problems, including practice in determining whether the dependent measure is quantitative or categorical. Additional research is needed to determine which instructional techniques are most effective in helping students to learn to discriminate among highly confusable categories, such as t test and chi-square. Third, the results of each experiment demonstrate that although brief exposure to structure-emphasizing example problems improves students' performance in categorizing problems on the basis of structure, it is not sufficient for fostering mastery of the categorization process. Although students who were exposed to structure-emphasizing example problems subsequently categorized problems more accurately than did students who were not exposed to structure-emphasizing example problems, the performance of students who had learned from structure-emphasizing example problems was not at a high level. A straightforward educational implication is that brief exposure to structureemphasizing examples, without supporting guidance or instruction, is not an effective instructional technique. How-
ever, the pattern of results in these studies encourages the use of structure-emphasizing examples within the context of a larger instructional unit. Further research is needed to determine the amount and type of direct instruction that is needed to supplement exposure to structure-emphasizing example problems.
References Ahn, W.-K., Brewer, W. F., & Mooney, R. J. (1992). Schema acquisition from a single example. Journal of Experimental Psychology: Learning, Memory, and Cognition, 18, 391-412. Anderson, J. R. (1993). Rules of the mind. Hillsdale, NJ: Erlbaum. Catrambone, R. (1994). Improving examples to improve transfer to novel problems. Memory & Cognition, 22, 606-615. Catrambone, R. (1995). Aiding subgoal learning: Effects on transfer. Journal of Educational Psychology, 87, 5-18. Catrambone, R., & Holyoak, K. J. (1989). Overcoming contextual limitations on problem-solving transfer. Journal of Experimental Psychology: Learning, Memory, and Cognition, 15, 1147— 1156. Catrambone, R., & Holyoak, K. J. (1990). Learning subgoals and methods for solving probability problems. Memory & Cognition, 18, 593-603. Chi, M. T. H., Bassok, M , Lewis, R., Reimann, P., & Glaser, R. (1989). Self-explanations: How students study and use examples in learning to solve problems. Cognitive Science, 13, 145-182. Chi, M. T. H., Feltovich, P. J., & Glaser, R. (1981). Categorization and representation of physics problems by experts and novices. Cognitive Science, 5, 121-152. Cooper, G., & Sweller, J. (1987). Effects of schema acquisition and rule automation on mathematical problem-solving transfer. Journal of Educational Psychology, 79, 347-362. Cummins, D. D. (1992). Role of analogical reasoning in the induction of problem categories. Journal of Experimental Psychology: Learning, Memory, and Cognition, 18, 1103-1124. Gentner, D. (1983). Structure-mapping: A theoretical framework for analogy. Cognitive Science, 7, 155-170. Gentner, D. (1989). The mechanisms of analogical learning. In S. Vosniadou & A. Ortony (Eds.), Similarity and analogical reasoning (pp. 199-241). Cambridge, England: Cambridge University Press. Gick, M. L., & Holyoak, K. J. (1980). Analogical problem solving. Cognitive Psychology, 12, 306-355. Gick, M. L., & Holyoak, K. J. (1983). Schema induction and analogical transfer. Cognitive Psychology, 15, 39-65. Hinsley, D. A., Hayes, J. R., & Simon, H. A. (1977). From words to equations: Meaning and representation in algebra word problems. In M. A. Just & P. A. Carpenter (Eds.), Cognitive processes in comprehension (pp. 89-108). Hillsdale, NJ: Erlbaum. Holyoak, K. J. (1985). The pragmatics of analogical transfer. In G. H. Bower (Ed.), The psychology of learning and motivation (Vol. 19, pp. 59-87). San Diego, CA: Academic Press. Holyoak, K. J., & Koh, K. (1987). Surface and structural similarity in analogical transfer. Memory & Cognition, 15, 332-340. Mayer, R. E. (1981). Frequency norms and structural analysis of algebra story problems. Instructional Science, 10, 135-175. Mayer, R. E. (1982). Memory for algebra story problems. Journal of Educational Psychology, 74, 199-216. Mayer, R. E. (1987). Educational psychology: A cognitive approach. New York: HarperCollins. Mayer, R. E. (1992). Thinking, problem solving, cognition (2nd ed.). New York: Freeman.
STATISTICS WORD PROBLEMS Novick, L. R. (1988). Analogical transfer, problem similarity, and expertise. Journal of Experimental Psychology: Learning, Memory, and Cognition, 14, 510-520. Novick, L. R. (1992). The role of expertise in solving arithmetic and algebra word problems by analogy. In J. I. D. Campbell (Ed.), The nature and origins of mathematical skills (pp. 155— 188). Amsterdam: North-Holland. Novick, L. R., & Holyoak, K. J. (1991). Mathematical problem solving by analogy. Journal of Experimental Psychology: Learning, Memory, and Cognition, 17, 398-415. Paas, F. G. W. C. (1992). Training strategies for attaining transfer of problem-solving skill in statistics: A cognitive-load approach. Journal of Educational Psychology, 84, 429-434. Paas, F. G. W. C , & Van Merrienboer, J. J. G. (1994). Variability of worked examples and transfer of geometric problem-solving skills: A cognitive-load approach. Journal of Educational Psychology, 86, 122-133. Polya, G. (1945/1957). How to solve it. Garden City, NY: Doubleday. Reed, S. K. (1987). A structure-mapping model for word problems. Journal of Experimental Psychology: Learning, Memory, and Cognition, 13, 124-139. Reed, S. K. (1989). Constraints on the abstraction of solution. Journal of Educational Psychology, 81, 532-540. Reed, S. K., Ackinclose, C. C , & Voss, A. A. (1990). Selecting analogous problems: Similarity versus inclusiveness. Memory & Cognition, 18, 83-98. Reed, S. K., & Bolstad, C. A. (1991). Use of examples and procedures in problem solving. Journal of Experimental Psychology: Learning, Memory, and Cognition, 17, 753-766. Reed, S. K., Dempster, A., & Ettinger, M. (1985). Usefulness of analogous solutions for solving algebra word problems. Journal of Experimental Psychology: Learning, Memory, and Cognition, 11, 106-125. Reed, S. K., Ernst, G. W., & Banerji, R. (1974). The role of analogy in transfer between similar problem states. Cognitive Psychology, 6, 436-450.
159
Riley, M. S., Greeno, J. G., & Heller, J. I. (1983). Development of children's problem-solving ability in arithmetic. In H. P. Ginsburg (Ed.), The development of mathematical thinking (pp. 153— 196). San Diego, CA: Academic Press. Ross, B. (1987). This is like that: The use of earlier problems and separation of similarity effects. Journal of Experimental Psychology: Learning, Memory, and Cognition, 13, 629-639. Ross, B. (1989). Distinguishing types of superficial similarities: Different effects on the access and use of earlier problems. Journal of Experimental Psychology: Learning, Memory, and Cognition, 15, 456-468. Ross, B. H., & Kennedy, P. T. (1990). Generalizing from the use of earlier examples in problem solving. Journal of Experimental Psychology: Learning, Memory, and Cognition, 16, 42-55. Schoenfeld, A. H. (1985). Mathematical problem solving. San Diego, CA: Academic Press. Schoenfeld, A. H., & Hermann, D. J. (1982). Problem perception and knowledge structure in expert and novice mathematical problem solvers. Journal of Experimental Psychology: Learning, Memory, and Cognition, 8, 484-494. Silver, E. A. (1981). Recall of mathematical problem information: Solving related problems. Journal for Research in Mathematics Education, 12, 54-64. Sweller, J., & Cooper, G. A. (1985). The use of worked examples as a substitute for problem solving in learning algebra. Cognition and Instruction, 2, 59-89. Vosniadou, S., & Ortony, A. (Eds.). (1989). Similarity and analogical reasoning. Cambridge, England: Cambridge University Press. Ward, M., & Sweller, J. (1990). Structuring effective worked-out examples. Cognition and Instruction, 7, 1-39. Williams, L., Hill, M. A., & Vang, E. (1992). SYSTAT: Statistics, version 5.2 edition. Evanston, IL: SYSTAT. Zhu, X., & Simon, H. A. (1987). Learning mathematics from examples and by doing. Cognition and Instruction, 4, 137166.
(Appendix follows on next page)
160
QUILICI AND MAYER
Appendix Solutions to Practice Problems for Experiment 3 A r-Test Example A school board would like to test the assertion that district employees who have more years of experience working in the district are absent from work more days than those who have worked fewer years. Seven experienced employees (i.e., with 10 or more years of experience working in the district) and 7 inexperienced employees (i.e., with less than 10 years of experience working in the district) reported how many days they were absent from work last year. The number of days absent for each of the experienced employees were 15,10,17,14,11,10, and 7, whereas the number of days absent for each of the inexperienced employees were 8, 3, 9, 7, 4, 3, and 1. The critical value is 1.782. Step 1: Set up tables for initial calculations. We will call the experienced employees Group 1 and the inexperienced employees Group 2. First, we must calculate the overall average days absent for each of the groups, denoted by ave, for Group 1 and ave2 for Group 2. We do this by adding up the scores for each group (called sum, for Group 1 and sum2 for Group 2) and dividing the total by the number of people in that group (called n, for Group 1 and n2 for Group 2) as follows: sum, (15 + 10+17+14+11 + 10+7) 84 ave, = —— = = = -=• = 12
ave 2 =
sum 2
(8 + 3 + 9 + 7 + 4 + 3 + 1 )
35
Step 2: State the hypotheses. The null hypothesis predicts the outcomes which contradict what we expect to find, while the alternative hypothesis predicts the outcome which we do expect to find. Null Hypothesis: Experienced employees are absent less than or the same amount as inexperienced employees. Alternative Hypothesis: Experienced employees are absent more than inexperienced employees. Step 3: Define the rejection region. Rejection Region 1.782 Critical Value In step 4, we will be calculating what is called a t statistic. If this t statistic is a value greater than the critical value of 1.782 (which was given in the problem), it will fall within the bold region of the number line. In this situation, we reject the null hypothesis because there will be less than a 5% chance that the null hypothesis is true. Step 4: Calculate the t statistic. First, we have to calculate the pooled variance for both groups combined. This is a measure of how much the scores vary from each other. It is calculated as follows:
= 5.
«2
Now, we need to set up a table for each group. Each table will have three columns. In the first column, list all of the scores for the group. In the second column, deviation scores will be computed. These scores are a measure of how far each score is from the group's average. You calculate each value by taking each score and subtracting the average from that group. The third column contains squared deviation scores. This is done to remove any negative signs. You find these values by squaring each deviation score in the second column. When you have done this, add up all of the values in the third column to obtain the sum of squares (or SS) value for that group. These values will be used in later calculations. (X, - ave,) 2 X 2
X,
X, - ave,
15 10 17 14 11 10 7
3
9
-2 5 2 -1 -2 -5
4 25 4 1 4 25 SS, = 72
8 3 9 7 4 3 1
X 2 - ave2
(X2 — ave2)2
3
9 4 16 4 1 4 16
-2 4 2 -1 -2 -4
SS2 = 54
SS,+SS 2 pooled variance = si = —; r r p n,+n 2 —2 126 = 10.5.
72 + 54 7 + 7-2
Next, we must calculate a measure of standard error for the two groups combined. This is a measure of the amount of error in our two groups. It is calculated as follows: standard error = savei_ave2=
= 1.73. Now we can calculate our t statistic as follows: *
=
difference between sample means amount of sampling error ave, — ave2
12 —5 1.73
7 = 4.046. 1.73
STATISTICS WORD PROBLEMS
161
Step 5: Make a decision and state your conclusion. Employee X Y
Rejection Region 1.782 Critical Value
4.046
f-statistic
The t statistic is greater than the critical value and falls within the rejection region (4.046 > 1.782). Therefore, we reject the null hypothesis. Conclusion: There is sufficient evidence to conclude that experienced employees are absent from work significantly more than inexperienced employees.
A Correlation Example A school board would like to test the assertion that the number of days school employees are absent increases with the number of years of employment in the school district. Seven school employees are asked to report how many years they worked for the district and how many days they were absent from work last year. Their years of experience were 7, 4, 5, 3, 9, 11, and 17 while their respective number of days absent were 5,1,7,2,8,14, and 12. The critical value is 0.669. Step 1: Set up table for initial calculations. We will call the years of experience for each person X scores and the average number of days absent for each person Y scores. First we must calculate the overall average years worked by the seven employees (called avex) and the average number of days absent for the seven employees (called avey). We do this by adding up the scores for each group (called sun^ for X scores and suniy for Y scores) and dividing by the number of employees (called n) as follows: sumx (7 + 4 + 5 + 3 + 9 + 11 + 17) 56 avex = — = = - = 8
1 2 3 4 5 6 7
7 4 5 3 9 11 17
ave.
(Xavex)2
ave2y)2
-1 -4 -3 -5 1 3 9
-2 -6 0 -5 1 7 5
1 16 9 25 1 9 81
4 36 0 25 1 49 25
x
(
SSX=142 SS =140
(Y - ave,) 2 24 0 25 1 21 45 SP=118
Step 2: State the hypotheses. The null hypothesis predicts the outcomes which contradict what we expect to find, while the alternative hypothesis predicts the outcome which we do expect to find. Null Hypothesis: As years of experience increases, days absent either decreases or has no relationship to experience. Alternative Hypothesis: As years of experience increases, days absent also increases. Step 3: Define the rejection region. Rejection Region 0.669 Critical Value In Step 4, we will be calculating what is called a correlation. If this correlation is a value greater than the critical value of +.669 (which was given in the problem), it will fall within the bold region of the number line. In this situation, we reject the null hypothesis because there will be less than a 5% chance that the null hypothesis is true. Step 4: Calculate the correlation.
correlation = r =
sumy ( 5 + 1 + 7 + 2 + 8+14+12) 49 avey = — « = - = 7 Now, we need to set up a table containing eight columns. In the first column, number from 1 to 7 for each of the employees. In the second column list the X scores in the order given in the problem and in the third column list the Y scores in the order given in the problem. This way, each employee's number of years worked and corresponding days absent will be listed on the same row. The fourth and fifth columns contain deviation scores. These scores are a measure of how far each score is from the group average. In the fourth column, calculate the deviation scores for the X scores by subtracting avex from each X score. In the fifth column, calculate the deviation scores for the Y scores by subtracting avey from each Y score. In the sixth and seventh columns, we square the deviation scores. In the sixth column, square the X deviation score for each employee. In the seventh column, square the Y deviation score for each employee. These two columns of values are added up separately to find the sum of squared deviations for X and Y, called SSX and SSy, respectively. In the eighth column, we multiply each employee's X deviation score and Y deviation score together. We add up these values to find what we call SP. SP, the sum of products of deviations of X and Y, is a measure of how much X and Y scores vary together. We will be using SSX, SSy, and SP in later calculations.
5 1 7 2 8 14 12
(X - avex) Y avey
SP
118
/
V SS~SSy~ ^(142X140)
118 _ 118 _ ~ ^19,880 ~ 141 ~ - 8 3 7 ' Step 5: Make a decision and state your conclusion.
.669). Therefore, we reject the null hypothesis. Conclusion: There is sufficient evidence to conclude that as district working experience increases, number of days absent also increases.
Received May 15, 1995 Revision received September 18, 1995 Accepted September 25, 1995
•


![[PDF] Download 131 Dirty Talk Examples: Learn How ... - Google Sites](https://m.moam.info/img/260x300/pdf-download-131-dirty-talk-examples-learn-how-goo_647813fb097c4737708c68b0.jpg)