Role of Synaptic Inputs in Determining Input Resistance of Developing Brain Stem Motoneurons ´N ˜ EZ-ABADES,1 JOHN M. PATTILLO,1 TRACY M. HODGSON,1 AND WILLIAM E. CAMERON1–3 PEDRO A. NU Department of Neuroscience and 2Department of Psychiatry, University of Pittsburgh, Pittsburgh, Pennsylvania 15260; and 3 Department of Physiology and Pharmacology, Oregon Health Sciences University, Portland, Oregon 97201
1
Received 27 July 1999; accepted in final form 28 July 2000
Nu´n˜ez-Abades, Pedro A., John M. Pattillo, Tracy M. Hodgson, and William E. Cameron. Role of synaptic inputs in determining input resistance of developing brain stem motoneurons. J Neurophysiol 84: 2317–2329, 2000. The contribution of synaptic input to input resistance was examined in 208 developing genioglossal motoneurons in 3 postnatal age groups (5–7 day, 13–16 day, and 18 –24 day) using sharp electrode recording in a slice preparation of the rat brain stem. High magnesium (Mg2⫹; 6 mM) media generated significant increases (21–38%) in both the input resistance (Rn) and the first time constant (0) that were reversible. A large percent of the conductance blocked by high Mg2⫹ was also sensitive to tetrodotoxin (TTX). Little increase in resistance was attained by adding blockers of specific amino acid (glutamate, glycine, and GABA) transmission over that obtained with the high Mg2⫹. Comparing across age groups, there was a significantly larger percent change in Rn with the addition of high Mg2⫹ at postnatal days 13 to 15 (P13–15; 36%) than that found at P5– 6 (21%). Spontaneous postsynaptic potentials were sensitive to the combined application of glycine receptor antagonist, strychnine, and the GABAA receptor antagonist, bicuculline. Application of either 10 M strychnine or bicuculline separately produced a reversible increase in both Rn and 0. Addition of 10 M bicuculline to a strychnine perfusate failed to further increase either Rn or 0. The strychnine/bicuculline-sensitive component of the total synaptic conductance increased with age so that this form of neurotransmission constituted the majority (⬎60%) of the observed percent decrease in Rn and 0 in the oldest age group. The proportion of change in 0 relative to Rn following strychnine or high magnesium perfusate varied widely from cell to cell and from age to age without pattern. Based on a model from the literature, this pattern indicates a nonselective distribution of the blocked synaptic conductances over the cell body and dendrites. Taken together, the fast inhibitory synapses (glycine, GABAA) play a greater role in determining cell excitability in developing brain stem motoneurons as postnatal development progresses. These findings suggest that synaptically mediated conductances effect the membrane behavior of developing motoneurons.
The postnatal development of the mammalian neuromuscular system is characterized by the maturation of the motoneuron membrane and the emergence of adult muscle fiber types. In the adult, there are two general classes of motoneurons, fast and slow, based on the properties of the motoneuron and the skeletal muscle fibers that they innervate (Burke and Rudomin 1977). At birth, there is less of a distinction between the two
classes (Navarrete and Vrbova´ 1993). During the subsequent postnatal development, multiple processes occur in the motoneuron that tend to separate these classes, including shortening of the duration of the action potential and its afterhyperpolarization, increase in rheobase and decrease in input resistance (Rn) (Cameron et al. 1991b; Kellerth et al. 1971; Nu´n˜ez-Abades et al. 1993) and elimination of the electrotonic coupling among motoneurons (Mazza et al. 1992; Walton and Navarrete 1991). These changes in physiological properties occur concurrently with a reduction in the complexity of the dendritic tree (Cameron et al. 1991a; Nu´n˜ez-Abades et al. 1994). During the postnatal transition, the pattern of spontaneous discharge of respiratory motoneurons is altered. In the first two postnatal weeks most, if not all, cat phrenic motoneurons are activated with each inspiration (Cameron et al. 1991b). Three weeks later, almost half of the phrenic motoneurons fail to reach threshold and generate action potentials for an equivalent respiratory drive. While the pattern of repetitive discharge is shaped, in large part, by the characteristics of the action potential (Binder et al. 1996), it is the Rn of the cell that determines whether a cell will reach threshold and initiate firing. The increase in number of quiescent cells during this period coincides with a halving of the mean Rn (Cameron et al. 1991b). The reduction of Rn takes place during a period of no change in the total membrane surface area (Cameron et al. 1991a), implying that the decrease occurs as a result of a reduction in the specific membrane resistance of these cells. The mechanism of the reduction in specific membrane resistance, critical to motoneuron differentiation, is the focus of the present studies. The membrane resistance can be altered by addition of new, tonically active, synaptic inputs converging on motoneurons and/or as a result of the addition or deletion of other open ionic channels. Both of these mechanisms will be investigated in this and the companion paper. In the first paper, the contribution of several forms of synaptic input to the input resistance of developing motoneurons will be examined. In the second paper, the role of potassium conductances in the developmental process will be explored. To manipulate the various forms of neurotransmission, we have elected to study developing motoneurons using a slice preparation of the rat brain stem (see DISCUSSION for the limitations of the technique). In
Address for reprint requests: W. E. Cameron, Dept. of Physiology and Pharmacology, L-334, Oregon Health Sciences University, 3181 S.W. Sam Jackson Park Rd., Portland, OR 97201 (E-mail:
[email protected]).
The costs of publication of this article were defrayed in part by the payment of page charges. The article must therefore be hereby marked ‘‘advertisement’’ in accordance with 18 U.S.C. Section 1734 solely to indicate this fact.
INTRODUCTION
www.jn.physiology.org
0022-3077/00 $5.00 Copyright © 2000 The American Physiological Society
2317
2318
´N ˜ EZ-ABADES, PATTILLO, HODGSON, AND CAMERON NU
previous in vitro studies, the rat genioglossal (GG) motoneurons have been shown to undergo similar developmental changes in electrical properties (Nu´n˜ez-Abades et al. 1993) and morphology (Nu´n˜ez-Abades and Cameron 1995; Nu´n˜ezAbades et al. 1994) to those described for the cat phrenic motoneurons studied in vivo. Both excitatory and inhibitory inputs converging on motoneurons undergo substantial reorganization during embryonic and postnatal development (Conradi 1976; Gao and Ziskind-Conhaim 1995; Ziskind-Conhaim 1990). We have focused on the role of inhibitory transmission since the longer duration of their inputs (Gao et al. 1998) and greater distribu¨ rnung et al. tion of inhibitory synapses on or near the soma (O 1998) suggests a predominant role of these inputs in establishing the resting conductance and shunting of other synaptic inputs. In the adult rabbit, the distribution of glycine and GABA responses on hypoglossal motoneurons has been suggested to be quite distinct (Altmann et al. 1972). GABA has relatively stronger actions on the dorsal dendrites, while glycine was more effective in the center of the nucleus, presumably on the cell bodies and proximal dendrites. However, this proposed segregation of glycine and GABAA receptors on hypoglossal motoneurons is contra-intuitive to more recent reports. First, there is strong anatomical evidence for colocalization of GABAA and glycine receptors at single postsynaptic densities of spinal motoneurons (Bohlhalter et al. 1994; Todd et al. 1996) and co-localization of GABA and glycine in their ¨ rnung et al. 1994, 1996, 1998; Shupresynaptic terminals (O pliakov et al. 1993; Todd et al. 1996). Second, co-release of these neurotransmitters from the same presynaptic vesicle has also been demonstrated using electrophysiological recordings in both spinal (Jonas et al. 1998) and hypoglossal motoneurons (O’Brien and Berger 1999). Given the different time courses demonstrated for the two inhibitory currents, the balance between co-release and synapses releasing only GABA or glycine may be more important for controlling the time course of the inhibition. We have selected to study the role of tonic glycine- and GABA-mediated neurotransmission in determining the resting conductance in developing GG motoneurons, although the nature of phasic inhibitory input from respiratory premotor neurons is also undergoing developmental changes (Funk and Feldman 1995). The effect of the antagonists to the glycine and GABAA receptors will be compared with the changes generated by the blockade of action potential evoked and calciumsensitive neurotransmitter release. A preliminary report has been published elsewhere (Cameron et al. 1996).
(Campden, UK). In a previous study (Nu´n˜ez-Abades et al. 1994), it was determined that the transverse plane produced optimal conditions for recording because the viable motoneurons were in the middle of the slice and have most, if not all, of their dendritic processes intact. In addition, the elaboration of GG dendrites with postnatal development occurred predominantly within the mediolateral plane. All slices were incubated in a holding chamber containing cold sucrose-ACSF for 35– 45 min and then transferred to a second holding
METHODS
Surgical procedures and solutions Experiments were carried out on Sprague-Dawley rats (wt: 10 –140 g) of either sex divided into three postnatal age groups (5–7 days, 13–16 days, and 18 –24 days). Rats were deeply anesthetized with halothane, tracheotomized, and ventilated with 95% O2-5% CO2. The brain stem slice preparation that we employed has been previously described (Aghajanian and Rasmussen 1989) with modifications (Mazza et al. 1992). In brief, the animals were transcardially perfused with a cold (1– 4°C) sucrose–artificial cerebral spinal fluid (ACSF) and then quickly decapitated. The brain stem was removed and sectioned at 300 m in the transverse plane using a Vibraslice
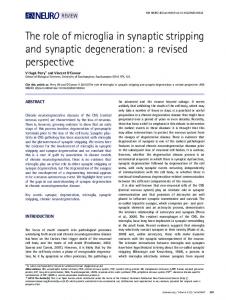
FIG. 1. Measurement of input resistance and 1st membrane time constant in a genioglossal motoneuron of a postnatal day 21 (P21) animal exhibiting an inward rectifying (or “sag”) current. A: membrane response (10 sweep average) to a series of 6 hyperpolarizing current steps (⫺0.05 to ⫺0.3 nA). Input resistance was calculated from the peak voltage achieved at each step (⬃35 ms after initiation of current step). B and C: semi-log plots of membrane potential (voltage) as a function of time for the smallest current injection (⫺0.05 nA) and the largest current injection (⫺0.3 nA), respectively. A linear fit of the points between 3 and 35 ms revealed similar slopes (1st membrane time constants, 0) from both plots. A deviation from the linear fit was evident at times ⬎35 ms for the largest current step in C. This cell was typical of others exhibiting sag, and it was felt that the sag did not compromise our ability to measure the 1st membrane time constant (usually ⬍20 ms) or accurately estimate input resistance.
SYNAPTIC CONDUCTANCES IN DEVELOPING RAT MOTONEURONS
2319
FIG. 2. Effect of synaptic blockade on the input resistance (Rn) of a genioglossal (GG) motoneurons of a P13 rat. After 30 min exposure to 6 mM magnesium (Mg2⫹) or 1 M tetrodotoxin (TTX), the excitatory postsynaptic potential (EPSP) generated by stimulation of the parvocellular reticular formation (dorsal to nucleus ambiguus) was blocked (top panel), and the Rn increased (bottom panel). The blockade by magnesium was reversible (wash out) for both EPSP and resistance. The magnitude of increase in Rn was consistently greater for high Mg2⫹ than for TTX in this and most cells. There was some evidence of an inward rectifying (sag) current in this particular cells (control, wash out) that was reduced by either form of synaptic blockade. The potential waveforms are the average of 6 sweeps at each current step (0 – 0.3 nA in 0.05 increments) in this and subsequent figures. The 1st trace represents no current injection and establishes the resting potential for the current-voltage (I-V) plot. In this and all subsequent figures, the membrane potential was held at its initial value.
chamber containing normal-ACSF at room temperature (21 ⫾ 1oC). The slices were transferred one at time into the recording chamber containing normal-ACSF, and all measurements were made at room temperature. To counterbalance the increased CO2 saturation at the lower temperatures, the percentage of CO2 in the gas bubbling the cold sucrose-ACSF was varied between 2 and 5% to maintain the pH between 7.35 and 7.40. At room temperature, the normal ACSF was bubbled with 95% O2-5% CO2 (pH 7.4). Individual slices were transferred to the recording chamber and superfused with normal ACSF. The composition of sucrose-ACSF was as follows (in mM): 240 sucrose, 2 KCl, 1.25 Na2HPO4, 26 NaHCO3, 10 glucose, 2 MgSO4, and 2 CaCl2. The normal-ACSF consisted of (in mM) 126 NaCl, 2 KCl, 1.25 Na2HPO4, 26 NaHCO3, 10 glucose, 2 MgSO4, and 2 CaCl2.
Recordings and selection criteria Intracellular impalements were made in the ventralmost region of the hypoglossal motor nucleus, a site demonstrated to contain predominantly motoneurons innervating the genioglossus muscle (Nu´n˜ez-Abades et al. 1994). The glass microelectrodes used were filled with a 3:1 mixture of 4 M potassium acetate and 3 M KCl (resistance: 80 –120 M⍀). Resting membrane potentials were measured as the difference between the intracellular and extracellular potentials after withdrawing the recording electrode from the cell. Neurons were accepted for analysis if they had stable resting membrane potentials more negative or equal to ⫺55 mV and action potentials with a positive overshoot, and if they fired repetitively to TABLE
sustained depolarization (see Nu´n˜ez-Abades et al. 1993 for details). Single action potentials were evoked by brief suprathreshold depolarizing current pulses (duration: 100 s) and were averaged for eight sweeps. Once cells met these criteria, one of several protocols was performed to block various forms of synaptic transmission. With the exception of exposure to tetrodotoxin, the effects of the ionic and pharmacological manipulations were all reversible. The data for any given cell in response to synaptic blockade were accepted only if the membrane potential, spike amplitude and Rn returned to control value (those obtained when the cell was just impaled) after a wash out period. Failure of cells to return to control values after the wash out period could be due to a change in the health of the cell or in the properties of the electrode and therefore for consistency, the data from these cells were not used. After stable intracellular impalement was achieved, the first series of tests were performed to establish the control values of Rn and an estimate of the membrane time constant. Given the nonuniform nature of the membrane resistance of motoneurons (Campbell and Rose 1997; Clements and Redman 1989; Fleshman et al. 1988; Iansek and Redman 1973), the first time constant (0) will be used as an estimate of the “average” membrane time constant (m). First, the membrane potential was measured in response to a series of six to eight negative current pulses (500 ms, 1 Hz, ⫺0.05-nA increments). The resistance was calculated as the slope of the current-voltage (I-V) plot using the Clampfit program (pClamp6 software, Axon Instruments). In some cells, there was evidence of inward rectification (“sag”) at the larger hyperpolarizing current steps. In these cases, the voltage for the I-V
1. The effects of high magnesium (Mg2⫹) on input resistance (Rn) and first time constant (0)
Postnatal Age
n
Control Rn, M⍀
High Mg2⫹ Rn
Wash Out Rn
Control 0, ms
High Mg2⫹ 0
Wash Out 0
5–7 days 13–16 days 18–23 days
20 23 21
60.1 ⫾ 5.9 35.1 ⫾ 2.5 39.3 ⫾ 2.8
72.5 ⫾ 7.3* 47.7 ⫾ 2.8*,† 50.6 ⫾ 3.8*
58.2 ⫾ 7.7 38.7 ⫾ 4.1 42.0 ⫾ 3.5
11.0 ⫾ 0.9 7.6 ⫾ 0.5 6.9 ⫾ 0.5
14.2 ⫾ 1.2* 10.5 ⫾ 0.6* 9.5 ⫾ 0.8*
12.1 ⫾ 1.3 9.0 ⫾ 0.8 7.7 ⫾ 0.5
Values are means ⫾ SE; n is the total number of neurons in the sample. * Level of significance derived from a comparison with the previous treatment: P ⬍ 0.001. In this and all subsequent tables, no statistical difference was found between the control and wash out for any age. † The percent change at 13–16 days with high magnesium was statistically greater (P ⬍ 0.01) than the percent change found at 5–7 days.
´N ˜ EZ-ABADES, PATTILLO, HODGSON, AND CAMERON NU
2320
FIG. 3. Evaluating the contribution of various forms of synaptic transmission on the Rn of 2 developing GG motoneurons (P6 and P24). TTX blocked action potential– evoked synaptic activity and increased the Rn of the cells by 4 and 6 M⍀, respectively. Magnesium was used to block the calcium-mediated synaptic release, and it further increased the resistance of these cells. Finally, a cocktail of postsynaptic receptor antagonist [30 M D-2-amino-5-phosphonovaleric acid (APV), 20 M 6-cyano-7-nitroquinoxaline-2,3-dione (CNQX), 20 M bicuculline, 10 M strychnine] was used to eliminate the calcium-independent spontaneous synaptic release. Each solution was applied for 10 –15 min prior to the measure of resistance. After 30 min of wash out (not shown), the input resistance returned to 84 and 43 M⍀, respectively.
plot was measured at the peak negative voltage achieved during the current step. To determine whether the sag current compromised our ability to measure peak voltage and first time constant, the time course of the voltage change in response to various levels of hyperpolarization was plotted on a semilog scale (Burke and Bruggencate 1971). Even for a cell exhibiting a pronounced sag (e.g., Fig. 1), the contribution of the inward current was minimal at the smallest current step (⫺0.05 nA, Fig. 1B). The first time constant (0) was fitted by a straight line that extended to 35 ms. At the largest negative current step (⫺0.3 nA, Fig. 1C), the semilog plots revealed a linear portion with similar slope to that in Fig. 1B followed by a marked deviation at approximately 35 ms associated with the inward current. In most instances, the measure of peak voltage and first time constant fell within this linear portion especially at the lower current steps. Before each series of current injections, the bridge balance was carefully adjusted to nullify the contribution of the electrode transient. This balance is achieved by viewing a high gain trace after the DC component of the membrane potential has been subtracted by a sample-and-hold unit. The contribution of the electrode was easily discriminated by the reduced noise level. In addition, we have previously addressed the issue of the accuracy of the bridge balance and the resulting Rn measurement (Nu´n˜ez-Abades et al. 1993). The Rn derived by bridge balance was ⬍3% different from the Rn calculated by spike height technique (Frank and Fuortes 1956), which is unaffected by the accuracy of the bridge balance. To calculate membrane time constant, average (n ⫽ 32– 64) voltage transient was measured in response to a ⫺0.05-nA current pulse of 500 ms duration. This level of hyperpolarization did not appear to activate a sag current (Fig. 1B). The time constant was then calculated using an exponential fitting algorithm of the Clampfit program. In all instances, the best fit was achieved by a double exponential equation TABLE
with the slower exponential term being defined as the first time constant (0). The voltage transient of a group of cells exhibiting prominent sag was also plotted using a semi-log plot, and time constants were calculated by exponential peel (Zengel et al. 1985). In general, the contribution of the sag current was minimal at the current step used to calculate 0 (Fig. 1B, ⫺0.05 nA). The values of 0 derived by exponential fitting and peel were within 4% of one another, and these values varied in a similar fashion with experimental treatment. Because the majority of time constants measured were ⬍15 ms and sag contamination, when present, was not manifest until 35–50 ms, we concluded that the sag had not distorted our ability to make an accurate measure of the first time constant, 0. We concede that there could be complicating factors associated with our measures of Rn and first time constant but, in the final assessment, our analyses are largely based on comparison between the measurement made during the control period versus the treatment and wash out for the same cell. Any error introduced by method of measurement might be expected to be relatively consistent within different trials on the same cell and, therefore it is not a factor in the interpretation of the results.
Experimental protocols The first series of experiments were designed to determine the contribution of various forms of synaptic transmission to the resting conductance of these developing motoneurons. Following control measurements, one of the following substances was added to the normal-ACSF to block one form of synaptic transmission. Tetrodotoxin (TTX, 1 M) was added to block the synaptic release associated with a propagated sodium action potential. High magnesium (6 mM) in the presence of 1 mM Ca2⫹ was added to block both evoked and spontaneous calcium-mediated synaptic release. Finally, a cocktail of postsynaptic receptor blockers (antagonists) was added to the high
2. The combined effects of tetrodotoxin (TTX), high Mg2⫹, and antagonists to amino acid transmitters
Postnatal Age
n
Control Rn, M⍀
5–6 days 13–14 days 20–24 days
8 6 6
58.6 ⫾ 9.3 38.6 ⫾ 6.9 38.9 ⫾ 2.3
TTX Rn
High Mg2⫹ Rn
65.0 ⫾ 9.5a 66.7 ⫾ 10.4 49.8 ⫾ 6.7b,c 52.2 ⫾ 6.9c,d 47.4 ⫾ 3.2b 49.8 ⫾ 3.3
Antagonist Rn
Wash Out Rn
Control 0, ms
TTX 0
High Mg2⫹ 0
Antagonist 0
Wash Out 0
66.0 ⫾ 8.6 54.2 ⫾ 6.7c 49.6 ⫾ 3.3
57.9 ⫾ 12.1 49.2 ⫾ 15.1 45.3 ⫾ 2.6
11.8 ⫾ 1.7 8.4 ⫾ 1.1 6.9 ⫾ 0.7
13.6 ⫾ 1.6b 10.0 ⫾ 1.2a 8.2 ⫾ 0.7b
14.0 ⫾ 1.8 10.9 ⫾ 1.4 8.3 ⫾ 1.0
14.0 ⫾ 1.7 11.7 ⫾ 1.3d,e 8.3 ⫾ 0.9
12.5 ⫾ 2.7 10.0 ⫾ 1.6 7.9 ⫾ 1.1
Values are means ⫾ SE; n is sample size. a P ⬍ 0.001. b P ⬍ 0.01. c Significantly larger (P ⬍ 0.05) percent change in Rn at 13–14 days than that found at 5– 6 days. d P ⬍ 0.05. e Significantly larger (P ⬍ 0.05) percent change in 0 at 13–14 days than that found at either 5– 6 days or 20 –24 days.
SYNAPTIC CONDUCTANCES IN DEVELOPING RAT MOTONEURONS
2321
A second series of experiments was designed to assess more specifically the contribution of inhibitory synaptic inputs to resting conductance. The effects of glycine- and GABAA-mediated synaptic transmission on Rn and 0 were measured individually and in combination with one another. In the first protocol, the slice was exposed for 10 min to either 10 –20 M strychnine or 10 M bicuculline followed by a 30-min wash out. In subsequent protocols, this initial exposure was followed by an exposure to a perfusate combining both strychnine and bicuculline. This latter procedure was designed to test for possible interactions between the two anionic channel antagonists.
Statistical analysis The dependent variable in all statistical tests was either Rn or 0 with control values being compared with each of the treatments. Interactions between age and treatment were determined using a two-way ANOVA. In the absence of interactions, the differences between treatments at any given age were tested using a paired t-test. The statistical levels are indicated in the tables at three levels: P ⬍ 0.05, P ⬍ 0.01, and P ⬍ 0.001. Significant differences in the percent change of Rn or 0 in response to a treatment were determined using a one-way ANOVA, and a Tukey-Kramer Multiple Comparison test was performed to determine between which groups the significant differences existed. RESULTS
The response of 208 GG motoneurons, obtained from rats between postnatal day 5 (P5) and P24, were included in the present study. Based on our previous study (Nu´n˜ez-Abades et al. 1993) that examined the developmental changes in Rn and time constant, the neurons reported here were selected from 3 age groups: P5–7, P13–16, and P18 –24. A younger age group (P0 –2) was not included in this study because it had been shown that there is little difference in their electrical properties from those examined by the P5–7 group (Nu´n˜ez-Abades et al.
FIG. 4. The relative contributions of the synaptic transmission to developing motoneurons analyzed at 3 different stages of postnatal development. The percent change in Rn is plotted as a function of the control value of Rn. In all instances, the biggest changes in resistance occurred when evoked release was blocked with TTX (open circles). In the vast majority of cases, the high magnesium (shaded circle) generated an additional increase in resistance over that obtained with TTX and, in some cells, there was an additional increase with antagonists (filled circle). Two low resistance cells at P13–15 exhibited the greatest change associated with synaptic blockade when compared with other cells.
magnesium solution to block all synaptic transmission, including the calcium-independent release. The cocktail contained 20 M D-2amino-5-phosphonovaleric acid (APV), 10 M 6-cyano-7-nitroquinoxaline-2,3-dione (CNQX), 10 –20 M strychnine, and 10 M bicuculline to block the N-methyl-D-aspartate (NMDA), non-NMDA, glycine, and GABAA receptors, respectively. The maximum effect of the drug or ionic manipulation occurred within 10 –15 min after exposure to the modified perfusate at which time, the action potential amplitude (without TTX), Rn, and time constant were measured. If the membrane potential had shifted due to the synaptic blockade, current was injected into the cell to hold the potential at its control value during the testing of the membrane properties. A healthy cell was always found to return to the control value of the resting membrane potential after wash out of blockers.
FIG. 5. Spontaneous synaptic activity of a GG motoneuron from a P20 rat in the presence of 20 M APV and 10 M CNQX in the artificial cerebrospinal fluid (ACSF). Top trace shows a single sweep of the spontaneous activity at resting membrane potential (RMP), ⫺75 mV. Due to the leak of chloride from the intracellular electrode, the chloride equilibrium potential appeared to be shifted to approximately ⫺50 to ⫺55 mV. Middle trace demonstrates that the spontaneous potentials are reduced in amplitude when the membrane potential is held near the estimated chloride equilibrium potential. Bottom trace shows that these EPSP at resting potential were blocked when 10 M strychnine and 10 M bicuculline were added to the ACSF already containing APV/CNQX. This activity was easier to visualize in the presence of the glutamate blockers.
´N ˜ EZ-ABADES, PATTILLO, HODGSON, AND CAMERON NU
2322
FIG. 6. The contribution of inhibitory synaptic input in determining Rn of cells from a young (P5) and older (P23) animal. Although the absolute magnitude of the increase in Rn in the presence of 10 M strychnine was same for both cells (4 M⍀), the relative change was larger in the P23. Addition of 10 M bicuculline to the strychnine caused little change in the resistance. For the P23 cell, the response to 10 M bicuculline alone (not shown) after a wash out produced a resistance of 35 M⍀, a value identical to that of the combined antagonists. After a 30-min wash out, the resistance of the 2 cells returned to values of 114 and 30 M⍀, respectively.
1993). The mean membrane potential for all protocols was ⫺68.1 ⫾ 1.7 mV. Effects of general synaptic blockade The effectiveness of synaptic blockade by high Mg2⫹ and TTX was assessed by monitoring the monosynaptic excitatory postsynaptic potential (EPSP) evoked by stimulating the adjacent reticular formation dorsal to the nucleus ambiguus (Fig. 2, top). Both 6 mM Mg2⫹ and 1 M TTX blocked the evoked EPSP in a P13 GG motoneuron. Furthermore, both manipulations resulted in an increase in Rn with TTX having less of an effect than 6 mM Mg2⫹ (Fig. 2, bottom). These results suggest that a component of Rn is determined by spontaneous release of neurotransmitter (Mg2⫹-sensitive, TTX-insensitive). Therefore the influence of synaptic inputs in Rn could be due to action potential– dependent and/or spontaneous release of neurotransmitter. This latter form of release could be calcium-dependent and independent. In the following figures, the influence of each component in Rn and 0 is studied. Table 1 shows for 64 GG motoneurons that the addition of high Mg2⫹ resulted in a significant increase in both Rn and 0. While the absolute magnitude of the increase in Rn is similar across ages, the percent change found at P13–16 was significantly greater (P ⬍ 0.01) than the younger age (P5–7). Figure 3 shows the effect of exposing the neuron to first TTX, then high magnesium and finally a cocktail of high magnesium and postsynaptic receptor blockers. Similar to the effects shown in Fig. 2, TTX-insensitive, spontaneous release contributes to Rn. We attempted to dissect the spontaneous release into calciumsensitive and calcium-insensitive components. In the two cells (P6 and P24) shown in Fig. 3, the contributions (absolute and relative) of these two synaptic components differed slightly from one another. On the average, the addition of the antagoTABLE
nists failed to generate any significant increase in Rn. We conclude from these results that most of the synaptic influence on Rn is calcium dependent. If proliferation of tonically active synaptic inputs were responsible for the decrease in Rn found at 2 wk, then there should be an age-dependent enhancement of the synaptic components at P13–16. The treatment- and age-dependent effects of this combined protocol are summarized in Table 2 for 20 cells. There was a significant effect of TTX treatment on both the mean Rn and 0 at all ages. With the addition of high Mg2⫹ and antagonists, only one age group (P13–14) showed a further significant increase in both mean Rn and 0. Although many cells, predominantly in the two older age groups, did not appear to return to their control values after a 30 – 60 min wash out (possibly due to the persistent effects of TTX), no statistical differences were found between control and wash out values at any age. Comparing across age groups, there was a significantly larger (P ⬍ 0.05) percent change in Rn at P13–14 associated with the addition of TTX, high Mg2⫹ and antagonists than that found at P5– 6. However, the increase in the mean values at P13–15 was not characteristic of all the cells in that age group. Figure 4 shows the percent change of Rn for each of the 20 cells from this protocol. Several observations emerge from this plot. First, in the majority of cells, the high Mg2⫹–antagonist combination generated the largest increases in Rn. Second, in most cases, the increase in Rn produced by the TTX response was supplemented by the other two manipulations. Third, two P13–14 cells showed a greater change in Rn with synaptic blockade than was evident at either the younger or older ages. Thus the differences in mean values calculated at P13–14 may be the result of a large synaptic contributions of a select subpopulation of cells (lower resistance) within the nucleus. Given the broad range of Rn in P5– 6, no correlation existed
3. The effects of glycine antagonist, strychnine (Str), on Rn and 0
Postnatal Age
n
Control Rn, M⍀
Str Rn
Wash Out Rn
Control 0, ms
Str 0
Wash Out 0
5–6 days 13–16 days 20–24 days
20 22 22
63.7 ⫾ 5.9 41.0 ⫾ 2.7 41.6 ⫾ 2.6
70.0 ⫾ 6.6* 46.0 ⫾ 2.8* 49.2 ⫾ 3.2*,†
63.0 ⫾ 6.7 41.6 ⫾ 2.6 42.7 ⫾ 3.0
13.5 ⫾ 1.3 8.2 ⫾ 0.6 7.1 ⫾ 0.5
15.4 ⫾ 1.4* 9.1 ⫾ 0.6* 9.6 ⫾ 0.7*,‡
13.3 ⫾ 1.3 8.2 ⫾ 0.7 7.2 ⫾ 0.5
Values are means ⫾ SE; n is sample size. * P ⬍ 0.001. † Significantly greater (P ⬍ 0.05) percent change in Rn at 20 –24 days than that at 13–16 days. ‡ Significantly greater (P ⬍ 0.05) percent change in 0 at 20 –24 days than that found at either 5– 6 or 13–15 days.
SYNAPTIC CONDUCTANCES IN DEVELOPING RAT MOTONEURONS TABLE
2323
4. The combined effects of strychnine (Str) and the GABAA antagonist, bicuculline (Bic)
Postnatal Age
n
Control Rn, M⍀
Str Rn
Str ⫹ Bic Rn
Wash Out Rn
Control 0, ms
Str 0
Str ⫹ Bic 0
Wash Out 0
5–6 days 13 days 20–23 days
8 6 6
67.5 ⫾ 11.3 34.4 ⫾ 2.8 42.3 ⫾ 5.8
74.0 ⫾ 13.1* 38.1 ⫾ 2.8† 49.5 ⫾ 8.2*
75.4 ⫾ 13.5 39.1 ⫾ 4.2 50.6 ⫾ 9.1
62.6 ⫾ 10.2 33.9 ⫾ 2.7 42.9 ⫾ 6.4
10.9 ⫾ 1.6 7.8 ⫾ 1.0 8.5 ⫾ 1.0
12.8 ⫾ 2.1* 8.8 ⫾ 1.2* 10.2 ⫾ 1.1*
13.7 ⫾ 2.5 8.5 ⫾ 1.3 9.9 ⫾ 1.0
10.8 ⫾ 1.8 8.5 ⫾ 1.2 8.4 ⫾ 0.8
Values are means ⫾ SE; n is sample size. There were no statistical differences found in the percent change associated with treatment among the different age groups. * P ⬍ 0.05. † P ⬍ 0.01.
between the control Rn and the percent change associated with synaptic blockage. Effects of inhibitory neurotransmitter release There were several instances in which spontaneous synaptic potentials were observed. One example of such activity in a GG motoneuron from a P20 animal is shown in Fig. 5. These potentials were considerably reduced in amplitude at ⫺55 mV and were sensitive to a combination of strychnine and bicuculline. Normally, the chloride equilibrium potential would be more negative than ⫺55 mV, but, due to the chloride introduced by the intracellular electrode, the potential was shifted to a more positive value. In the three cells demonstrating such spontaneous activity, all potentials were blocked when strychnine/bicuculline was added to the perfusate. In the following figures, the voltage traces were averaged and, for this reason, they did not show the large fast synaptic events prominent in Fig. 5 or in single voltage records (not shown). Besides averaging, spontaneous activity might be less evident if the membrane potential were near the chloride equilibrium potential. The membrane potential was not systematically varied to look for evidence of spontaneous inhibitory postsynaptic potentials (IPSPs). In Fig. 6, the changes in Rn are shown with block of fast inhibitory transmission followed by block of calcium-dependent release for two motoneurons from a P5 and a P23 animal. Strychnine alone (10 M) was found to significantly increase both the mean Rn and 0 of GG motoneurons at all ages (Table 3). In addition to the treatment-dependent changes, there were also age-dependent changes. The percent change in Rn and 0 was significantly greater (P ⬍ 0.05) at P20 –24 than that found at younger ages. The disproportionate nature of these changes in Rn and 0 will be examined in more detail later. For the two cells presented in Fig. 6, there was no significant change in either Rn or 0 when bicuculline was added to the strychnine perfusate. These observations of no additive effect of bicuculline on Rn or 0 is further supported by the larger sample of 20 cells presented in Table 4. Bicuculline alone (10 M) significantly (P ⬍ 0.01) increased both the mean Rn (42 ⫾ 4 to 47 ⫾ 5 M⍀) and 0 (9.1 ⫾ 1.0 to 10.7 ⫾ 1.3 ms) of 11 GG TABLE
motoneurons studied from all 3 age groups (not shown). It is interesting to note in Fig. 6 that there was a larger Mg2⫹sensitive component that exceeded the strychnine/bicucullinesensitive component in the cell of the younger as compared with the older animal. This relationship is more evident in the pooled data presented in Table 5. The nature of the conductances antagonized by strychnine and bicuculline was examined in more detail for the P23 cell in Fig. 6. Following a wash out of combined antagonists in which the cell returned to 30 M⍀, exposure to bicuculline alone generated a Rn of 35 M⍀. This pattern was seen in 8 of 10 cells studied with strychnine, bicuculline, and strychnine-bicuculline combination. In one of the two remaining cells (P20), the effect of the two antagonists were partially additive, failing to reach the sum of the two individual effects. The final cell (P13) actually exhibited a response to the combined antagonists that exceeded the sum of the individual effects. The “occlusion” effect characteristic of the eight cells was observed across all ages studied. If these receptor antagonists are specific throughout postnatal development, then these data may suggest some form of interaction between the strychnine- and bicucullinesensitive channels in these developing motoneurons. In Fig. 6, the addition of high Mg2⫹ blocked a calciumdependent component of Rn that was not mediated by glycine or GABAA receptors. The magnitude of this effect is summarized for 29 cells in Table 5. In all but one age group, there was a significant increase in Rn and 0 when high Mg2⫹ was added to the bath containing strychnine. The exception was in the oldest age group (P20 –23), in which there was no significant increase in either property with the addition of high Mg2⫹. Thus a larger part of the calcium-dependent synaptic release is associated with the strychnine-sensitive component at the oldest age as compared with earlier periods in development. Figure 7 presents the changes in both Rn and 0 with strychnine and high Mg2⫹ as a function of control Rn for individual motoneurons in the three different age groups. In this figure, the length of the line interconnecting the strychnine and high Mg2⫹ values indicates the magnitude of the strychnine-insensitive synaptic component. With the exception of one cell, P20 –23 has more cells showing short lines than either younger
5. The combine effects of strychnine and high magnesium (Mg2⫹)
Postnatal Age
n
Control Rn, M⍀
Str Rn
High Mg2⫹ Rn
Wash Out Rn
Control 0, ms
Str 0
High Mg2⫹ 0
Wash Out 0
5–6 days 13–16 days 20–23 days
10 10 9
63.0 ⫾ 9.5 35.2 ⫾ 2.8 46.3 ⫾ 4.8
69.6 ⫾ 10.9* 39.9 ⫾ 3.3† 53.6 ⫾ 6.5†
79.1 ⫾ 12.3‡ 47.6 ⫾ 3.6‡ 60.2 ⫾ 7.1
59.4 ⫾ 9.2 35.3 ⫾ 3.4 44.9 ⫾ 5.5
11.1 ⫾ 1.2 7.6 ⫾ 0.7 7.9 ⫾ 0.8
13.3 ⫾ 1.6† 8.5 ⫾ 0.9* 9.9 ⫾ 0.8†
15.4 ⫾ 1.8* 11.5 ⫾ 0.9‡ 11.5 ⫾ 1.4
12.0 ⫾ 1.3 8.5 ⫾ 1.1 8.2 ⫾ 0.6
Values are means ⫾ SE; n is sample size. There were no statistical differences found in the percent change associated with treatment among the different age groups. * P ⬍ 0.05. † P ⬍ 0.01. ‡ P ⬍ 0.001.
2324
´N ˜ EZ-ABADES, PATTILLO, HODGSON, AND CAMERON NU
FIG. 7. Changes in Rn and 0 in response to 10 M strychnine and 6 mM Mg2⫹ for 29 developing GG motoneurons at 3 different ages. The percent change in these 2 electrical properties is plotted as a function of the control Rn following 15 min perfusion with the 2 blockers. In all cells, the high magnesium generated an additional increase in resistance over that obtained with strychnine. In general, this was also the case with the time constants with 3 exceptions. No consistent pattern emerged for the magnitude of change for the cells with high resistance (⬎50 M⍀) as opposed to those with low resistance following either strychnine or high magnesium.
age group. Thus neurotransmitters other than the glycine and GABAA systems play a greater role at P5– 6 and P13–16, while these other neurotransmitters are of lesser import at P20 –23 in determining Rn. It should be noted that there are some differences in the magnitude of changes in response to high magnesium between Tables 1 and 5. Although the exposure to high magnesium followed strychnine in Table 5, it might be expected that the percent change associated with Mg2⫹ might be of the same order in both experimental protocols. Based on the large variation evident in responses by individual cells (Figs. 4 and 7), a statistically significant difference was found only in the larger sample size, although the same trend of a larger percent increase at P13–16 was present in both protocols. As noted earlier, the mean values derived can be influenced by the large changes in a subpopulation of the motoneurons. According to model developed by Redman and colleagues (Redman et al. 1987), neurons that show a disproportionately large increase in membrane time constant as compared with Rn are indicative of conductances located on the more distal dendritic compartment. Figure 8 shows two plots of percent
change in 0 as a function of the percent change in Rn after the motoneurons were exposed to high Mg2⫹ (A) or strychnine (B). A line with slope of one separates the data points into cells that show a larger change in 0 (above line) from ones that show a larger change in Rn (below line). For both manipulations (high Mg2⫹ and strychnine-sensitive), there were roughly equal numbers of points lying above as below the line for all age groups. It is interesting to note how large the variability is when comparing the relative change in Rn and time constant between cells within an age group. This distribution of points implies that the blocked calcium-dependent synaptic conductances were not preferentially localized to either the cell body or dendrites for this population of brain stem motoneurons. At all ages, there was a wide diversity in the magnitude of the response to either blocker. In particular, the greatest variation was found for the oldest age group in response to strychnine. DISCUSSION
This study demonstrates the role that tonically active synapses play in determining the Rn and 0 of developing mo-
SYNAPTIC CONDUCTANCES IN DEVELOPING RAT MOTONEURONS
2325
mission becoming the major (exceeding 60%) synaptic component in the adolescent rat. Measurement of membrane properties
FIG. 8. Plot of the percent change in 0 as a function of the percent change in Rn. A: the change associated with 6 mM Mg2⫹ added to the perfusate. A line with a slope of 1 is plotted to distinguish between those cells with a greater change in 0 than Rn and vice versa. Data points below the line indicated a more central location of synapses (see text). While the number of points above and below the unity line was roughly equal at all ages, there was greater deviation of points above the line at the oldest age. B: similar plot of the effect of 10 M strychnine on percent change in Rn and 0. Like the last plot, there was roughly an equal number of points lying above and below the line; however, there were a cluster of cells from older animals in the upper left quadrant indicating a dendritic localization of the strychnine-sensitive conductances. In general, both plots indicate a widely varying distribution of magnesium- and strychnine-sensitive synapses on these brain stem motoneurons.
toneurons in an in vitro preparation. This resistance was mediated by both action potential– evoked (TTX-sensitive) and spontaneous (TTX-insensitive) neurotransmitter release. The relative contribution of these two forms to Rn and 0 varied from cell to cell with a significant increase occurring between P5– 6 and P13–16. Almost all of the spontaneous release was calcium dependent (Mg2⫹ sensitive) with few cells exhibiting a calcium-independent component (blocked by the addition of receptor antagonists). When large spontaneous postsynaptic potentials were recorded, these events had an apparent reversal potential appropriate for chloride and were blocked by strychnine and bicuculline. The greatest percent change in Rn and 0 after blockade with strychnine occurred between P13–16 and P20 –24. In the oldest age group, high magnesium failed to significantly increase Rn and 0 beyond that resulting from exposure to strychnine. The percent changes in 0 relative to Rn suggested that both the strychnine- and magnesium-sensitive conductances were distributed equally over the cell body and distal dendrites. In general, synaptic transmission makes a significant contribution (up to 36% change after blockade) to Rn of developing motoneurons with glycine/GABA neurotrans-
Both Rn and 0 were derived from the membrane responses to long duration (500 ms) hyperpolarizing current steps. In many cells, it was apparent that there was an inward or sag current activated at the larger current pulses. The 0 was derived from a small hyperpolarizing current step (⫺0.05 nA) that failed to activate an inward current as determined by a semilog plot of voltage as a function of time. Even at the largest current steps, the time point when peak voltage for calculation of Rn occurred was measured prior to the onset of the sag. It is still possible that the measurement of these membrane properties is in some way contaminated by the inward current. In which case, these properties should be referred to as apparent Rn and 0. Likewise, our manipulations of synaptic activity could also be modulating the magnitude of the sag current. One means to eliminate the contribution of sag is to linearize the membrane properties by the introduction of cesium to the external bath (Rapp et al. 1994). As will become evident in the accompanying paper, external cesium does not always eliminate the inward current and clearly has an effect on other currents influencing the action potential and potentially resting conductances. The interpretation of our results might be complicated by artifacts produced by the use of the sharp electrode and the in vitro slice preparation. We have attempted to minimize the inaccuracies associated with the bridge balance (high gain sample-and-hold trace), but it might be suggested that the resistance measurements would be more accurate if we conducted the experiments using whole cell configuration featuring a lower electrode resistance. However, whole cell recording in these neurons is complicated by a nonuniform change in resistance associated with cellular dialysis (Robinson and Cameron 1998, 2000). The cellular dialysis associated with whole cell configuration can be avoided by using the perforated patch technique. In our hands, the resistance of a perforated patch recording approached the values of our sharp electrodes creating similar problems for bridge balance (unpublished observation). Each recording method had its own drawbacks, and we decided that sharp electrodes were the better choice given the other constraints of our experimental design. A second potential complication to the interpretation of our data is introduced by the preparation of the brain stem slice. If there is an age-dependent change in the numbers of premotor neurons surviving the slice preparation due to the actual sectioning procedure or the tolerance of neurons to anoxia, then the true role of synaptic input may be inaccurately assessed. Slices from older animals should have fewer premotor sources of input. As a result, the magnitude of the increase role found for synaptic input in determining Rn in the mature animals would be underestimated. This conclusion would also be supported by the lack of spontaneous synaptic activity in most cells studied. There is evidence that transverse slices can have sufficient circuitry intact to generate spontaneous rhythmic, respiratory motor output from hypoglossal motoneurons (Smith et al. 1991). However, these oscillating slices were prepared from younger animals (P0 –3) and were thicker slices (range: 500 – 650 m) than those in the present study. There is
2326
´N ˜ EZ-ABADES, PATTILLO, HODGSON, AND CAMERON NU
no evidence for phasic input from the respiratory generator in our slices. Clearly, there has been a substantial reduction in the number of premotor neurons projecting to GG motoneurons in the slice especially at the older ages. Thus we conclude that the increased role observed for inhibitory synaptic input in the older animals studied in vitro underestimates the magnitude present in the intact nervous system. Development of membrane properties During rat embryonic development, the mean Rn of lumbar spinal motoneurons decreased from 271 M⍀ at embryonic day 14 –15 to 65 M⍀ at birth (Ziskind-Conhaim 1988). This decrease is accompanied by a fivefold increase in the mean input capacitance of these cells indicating a substantial increase in cell size. The Rn continues to decrease into the postnatal period from a mean of 18 M⍀ at 3–5 days to 5 M⍀ at P9 –11 (Fulton and Walton 1986). A similar postnatal decrease has been noted for cervical motoneurons in the cat (Cameron et al. 1991b). Unlike the earlier reports in the rat spinal cord, the decreased Rn in the cat was found to occur during a period of no net increase in the size of the phrenic motoneurons (Cameron et al. 1991a). A similar pattern to the cat phrenic motoneurons has been described for Rn and membrane surface area of the rat brain stem motoneurons analyzed in the present study (Nu´n˜ezAbades and Cameron 1995, 1997; Nu´n˜ez-Abades et al. 1993, 1994). Assuming that specific capacitance remains constant over development, these latter studies imply that there was a change in the specific membrane resistance of the cell to achieve the decreased Rn without altering total membrane surface area. Based on the present data set, there is a synaptically mediated component to the resting conductance of GG motoneurons. The largest component of the synaptically mediated conductance is derived from action potential– evoked neurotransmitter release and the largest increase of this evoked release occurring between P5– 6 and P13–16. This corresponds to the time at which the membrane shows a dramatic change in specific membrane resistance (Nu´n˜ez-Abades et al. 1993). Thus at least part of this decreased Rn at 2 wk can be accounted for by an increase in the synaptic conductances. Glycine and GABA transmission For rat lumbar motoneurons, both GABAA- and glycinemediated transmission are present at embryonic day 18 with the GABA conductance accounting for seven times the conductance of glycine (Gao and Ziskind-Conhaim 1995). This relative imbalance between GABAergic and glycinergic transmission characteristic of embryonic development is lost by birth when both conductances become roughly equal. In embryonic and early postnatal life, activation of either GABAA or glycine receptors on spinal motoneurons generated an inward current and membrane depolarization (Gao and Ziskind-Conhaim 1995). Even though these receptors mediate a slight depolarization, they achieve an inhibition by shunting incoming synaptic currents. These depolarizing currents are also believed to be critical for the stabilization of newly formed synapses. Eventually, the adult chloride reversal potential is achieved by the action of a more efficient Na-Cl pump (Rohrbough and Spitzer 1996). In the present study, most cells showed no
change in membrane potential with the blockade of glycine and/or GABAA transmission. Those cells that did show a change were found to depolarize slightly, probably due to the leakage of chloride from the intracellular electrode as was evident in Fig. 5. The glycine receptor changes during development with respect to its subunit composition. The adult glycine receptor that is blocked by strychnine does not appear until 7 days in culture of embryonic rat spinal cords (St. John and Stephens 1993). There is a transition from strychnine-insensitive, fetal glycine receptors containing the alpha-2* subunit to strychnine-sensitive adult receptors containing the alpha-1 subunit after about 1 wk in culture (Withers and St John 1997). This conversion between fetal and adult forms of the receptor is also associated with more rapid kinetics of the channels (Takahashi et al. 1992). The increase in strychnine-sensitive conductances that we found with age could be explained by the gradual disappearance of the fetal (strychnine-insensitive) form of the receptor. We do not believe this to be the case because the neurons in culture derived from embryonic day 14 spinal cord reach their adult form after only 1 wk in culture. This stage would roughly equate to the end of an average gestational period of a rat (21 days). The first age group in which we studied the effect of strychnine was at P5– 6 and should represent principally adult receptors. Developmentally, the GABAergic system undergoes substantial regulation (Ma et al. 1992, 1993; Poulter et al. 1992, 1993; Rekling et al. 2000; Schousboe and Redburn 1995; Xia and Haddad 1992). Transcripts for the GABAA receptor subunits alpha 2, 3, 5, beta 2–3 and gamma 2–3 are all present in presumptive motoneurons of the mantle zone by E13 in rat. Peak expression of subunits occurs between E17 and E20 when mRNA for alpha 2–5, beta 1–3, and gamma 1–3 subunits are all present. Alpha 3–5, beta 1–2, and gamma 1 and 3 subunits then decrease and are almost absent by the end of the second postnatal week. Similar data on the developmental changes in subunit composition for hypoglossal motoneurons are not available. It is unlikely to have a similar sequence because of the differences in the GABA receptor subunits between spinal and cranial motoneurons. The ␣1 and ␣3 subunits are strongly expressed in cranial motoneurons (Hironaka et al. 1990), while they are very sparse or absent in spinal motoneurons where the ␣2 subunit dominates (Ma et al. 1993; Persohn et al. 1992). Developmental forms of the receptors may complicate the specificity of the antagonists. In the hippocampus, there is evidence for a transient expression of a bicuculline-insensitive GABA response mediated via chloride channels that disappears by postnatal week 2 (Martina et al. 1995). As was the case with a potential strychnine-insensitive component, our results may underestimate the GABAA contribution to resting conductance in the first postnatal week if there were a significant bicuculline-insensitive component. Tonic inhibitory inputs (i.e., glycine) have been implicated in establishing motoneuron excitability during some experimental induced sleep states. In cat lumbosacral (Morales et al. 1987) and masseter motoneurons (Kohlmeier et al. 1997), carbachol-induced atonia is produced by strychnine-sensitive and bicuculline-insensitive mechanisms. This same lab has demonstrated a similar strychnine-sensitive inhibition for hypoglossal motoneurons (Yamuy et al. 1999). Alternatively, it has also been proposed that removal of dysfacilitation mediate
SYNAPTIC CONDUCTANCES IN DEVELOPING RAT MOTONEURONS
this atonia response in cat hypoglossal motoneurons (Kubin et al. 1994, 1996). In our in vitro preparation, some of these inhibitory premotor inputs to the GG motoneurons studied remain intact in the brain stem slices as reflected by strychnine/ bicuculline-sensitive spontaneous activity. With a few exceptions (Umemiya and Berger 1995), most of the sources of inhibitory connections remain unknown; however, it is evident that the role of glycine/GABA in determining GG motoneuron excitability increases with age. It will be important that correlative anatomical studies be undertaken to map the changes in density and distribution of the inhibitory receptor during postnatal development. Interactions between the glycine- and GABAA-mediated responses There is strong anatomical evidence for the colocalization of GABAA and glycine receptors at single postsynaptic densities (Bohlhalter et al. 1994; Todd et al. 1996) and for GABA and ¨ rnung et al. glycine colocalization in presynaptic terminals (O 1994, 1996, 1998; Shupliakov et al. 1993; Todd et al. 1996). Electrophysiological measurements indicate that GABA and glycine can be co-released from the same presynaptic vesicle onto spinal (Jonas et al. 1998) and hypoglossal motoneurons (O’Brien and Berger 1999). Although the postsynaptic compliment of receptors varies between synapses with some being GABA only, some glycine only and some mixed (Todd et al. 1996), the activation of one receptor species over another may be more important in determining the time course of the response. In hypoglossal (O’Brien and Berger 1999) as is the case with spinal motoneurons (Jonas et al. 1998), the time constant for decay of the GABAA receptor–mediated currents was slower than that of glycine receptor–mediated currents. Which neurotransmitter initiates the inhibition may be less important than the role that the relative amount of GABA versus glycine play in establishing the time course of the inhibitory currents and in shaping of the resulting motor coordination. Our results suggest some form of interaction between glycine and GABAA receptors. The response to strychnine and bicuculline combined was no different from the response to either blocker individually. Occlusion between these two receptors has been reported previously. The GABA response is partially occluded by glycine in cultured rat medullary neurons (Lewis and Faber 1993). It might be proposed that there is some kind of steric hindrance of the GABAA receptor when strychnine binds to an adjacent glycine receptor. Alternatively, the concentration of strychnine used in the present study (10 m) to block glycine receptors can also significantly block the GABAA receptors in motoneurons in the first postnatal week (Jonas et al. 1998; O’Brien and Berger 1999). The converse for bicuculline is not true. If this nonselective blockade of GABAA receptors persists at the older ages, then the occlusion observed between the two receptors in the present study may be artifactual. Irrespective of the possibility of occlusion, it is interesting to note that the magnitude of the change in resistance associated with glycine receptor blockade was similar to that associated with GABAA receptor blockade. This would be the case if the majority of inhibitory synapses co-released both neurotransmitters or the total conductance mediated by the two
2327
neurotransmitters was comparable as found by O’Brien and Berger (1999). Differential distribution of synapses The present data demonstrate that synaptic conductances contribute to the resting membrane conductance (input resistance). In particular, the contribution of glycine/GABA increases, reaching its largest value at the oldest age group. During this period, the increased contribution of inhibitory synapses is associated with a decreased contribution of excitatory synapses. However, the role of the two fast inhibitory neurotransmitters on motoneurons has been described to be quite different. An earlier study had segregated the influence of glycine and GABA to different sites on the dendritic tree of rabbit hypoglossal motoneurons (Altmann et al. 1972). GABA has relatively stronger actions on the dorsal dendrites while glycine was more effective in the center of the nucleus, presumably the cell bodies and proximal dendrites. We have applied an analysis developed by Redman and colleagues for sympathetic ganglion cells (Redman et al. 1987) to assess the relative distribution of a blocked conductance. They observed that all sympathetic ganglion cells exhibited a disproportionately larger change in 0 as compared with Rn when exposed to extracellular barium. Their interpretation was that the bariumsensitive conductances are preferentially distributed to the distal dendrites. When a similar plot is generated for GG motoneurons exposed to high Mg2⫹ and strychnine, the points lay both above and below the line of unity slope. We interpreted this distribution to mean that these synaptic conductances were distributed more randomly across the cell membrane for the population of GG motoneurons. For some motoneurons, most of the conductance is associated with the soma or proximal dendrites, whereas, for others, most of the synaptically mediated conductance is associated with more distal dendrites. Therefore the possible impact of tonic inhibitory synapses determining excitability in GG motoneurons must be quite diverse. In some cells, these inputs may have a predominant role in establishing resting conductance and shunting synaptic inputs, but not in others. A recent report on rat Purkinje cells studied in the cerebellar slice preparation (Hausser and Clark 1998) demonstrated a relatively uniform distribution of inhibitory inputs. Simultaneous whole cell recording from cell body and dendrite revealed a similar change in the both Rn and m when 30 M bicuculline was added to the perfusate. These authors also emphasized how this tonic inhibition could play a role in dynamically modulating synaptic integration with synaptic inputs being attenuated in the presence of high synaptic background. Additional support for our observation of an increased role for glycinergic inputs has come from the analysis of miniature inhibitory postsynaptic currents (IPSCs). The IPSCs became faster and larger between neonate and juvenile. The shorter time course was correlated to a faster decay time course and coincided with an increased expression of adult (alpha 1) glycine receptor subunit of the channels (Singer et al. 1998). However, this postnatal change in receptor expression did not alter the conductance of the channels (Singer and Berger 1999). Instead, these authors proposed that the increase in IPSC amplitude was due to an increase in the number of receptors per synapse with postnatal development. To support
2328
´N ˜ EZ-ABADES, PATTILLO, HODGSON, AND CAMERON NU
these observations, one could generate an anatomical map of glycine and GABAA receptors on the surface of motoneurons at various stages of postnatal development. In particular, it would be interesting to see whether these changes correspond with the formation of receptor clusters on more distal dendrites as described on cat spinal motoneurons (Alvarez et al. 1997). In summary, there was a significant contribution of synaptic input to the Rn of these developing motoneurons. Most of this conductance is mediated by synaptic release associated with an action potential while the balance is associated with calciumdependent spontaneous release. The role of glycinergic/ GABAergic transmission increases over the course of postnatal development to account for most of the synaptic conductance in the mature animals (3 wk). These data support the general concept that development of motor skills is characterized by increased inhibition of reflex pathways. The authors thank Dr. David W. Robinson and the reviewers for invaluable comments on the manuscript. This work was supported by National Institute of Child Health and Human Development Grant HD-22703 and a local Sudden Infant Death Syndrome research foundation, Megan’s Run, Wilsonville, Oregon. Present address of P. A. Nu´n˜ez-Abades: Dept. of Animal Physiology and Biology, Faculty of Pharmacy, University of Seville, calle Tramontana, 41012 Seville, Spain. REFERENCES AGHAJANIAN GK AND RASMUSSEN K. Intracellular studies in the facial nucleus illustrating a simple new method for obtaining viable motoneurons in adult rat brain slices. Synapse 3: 331–338, 1989. ALTMANN H, TEN BRUGGENCATE G, AND SONNHOF U. Differential strength of action of glycine and GABA in hypoglossal nucleus. Pfl¨ugers Arch 331: 90 –94, 1972. ALVAREZ FJ, DEWEY DE, HARRINGTON DA, AND FYFFE REW. Cell-type specific organization of glycine receptor clusters in the mammalian spinal cord. J Comp Neurol 379: 150 –170, 1997. BINDER MD, HECKMAN CJ, AND POWERS RK. The physiological control of motoneuron activity. In: Handbook of Physiology, edited by Rowell LB and Shepherd JT. New York: Oxford, 1996, p. 3–53. BOHLHALTER S, MOHLER H, AND FRITSCHY J-M. Inhibitory neurotransmission in rat spinal cord: co-localization of glycine- and GABAA-receptors at GABAergic synaptic contacts demonstrated by triple immunofluorescence staining. Brain Res 642: 59 – 69, 1994. BURKE RE AND BRUGGENCATE G. Electrotonic characteristics of alpha motoneurones of varying size. J Physiol (Lond) 212: 120 –120, 1971. BURKE RE AND RUDOMIN P. Spinal neurons and synapses. In: Handbook of Physiology. The Nervous System. Cellular Biology of Neurons. Bethesda, MD: Am. Physiol. Soc., 1977, sect. 1, p. 877–944. CAMERON WE, HE F, KALIPATNAPU P, JODKOWSKI JS, AND GUTHRIE RD. Morphometric analysis of phrenic motoneurons in the cat during postnatal development. J Comp Neurol 314: 763–776, 1991a. CAMERON WE, JODKOWSKI JS, FANG H, AND GUTHRIE RD. Electrophysiological properties of developing phrenic motoneurons in the cat. J Neurophysiol 65: 671– 679, 1991b. ˜ -ABADES PA, HODGSON TM, AND PATTILLO JM. DevelCAMERON WE, NU´ NEZ opmental changes in ionic conductances contributing to membrane resistance in rat genioglossal motoneurons. Physiologist 39: 188, 1996. CAMPBELL DM AND ROSE PK. Contribution of voltage-dependent potassium channels to the somatic shunt in neck motoneurons of the cat. J Neurophysiol 77: 1470 –1486, 1997. CLEMENTS JD AND REDMAN SJ. Cable properties of cat spinal motoneurones measured by combining voltage clamp, current clamp and intracellular staining. J Physiol (Lond) 409: 63– 87, 1989. CONRADI S. Functional anatomy of the anterior horn motor neuron. In: The Peripheral Nerve, edited by Landon DM. Salisbury, UK: Chapman and Hall, 1976, p. 279 –329. FLESHMAN JW, SEGEV I, AND BURKE RE. Electrotonic architecture of type identified ␣-motoneurons in cat spinal cord. J Neurophysiol 60: 60 – 85, 1988.
FRANK K AND FUORTES GF. Stimulation of spinal motoneurones with intracellular electrodes. J Physiol (Lond) 134: 451– 470, 1956. FULTON BP AND WALTON K. Electrophysiological properties of neonatal rat motoneurones studied in vitro. J Physiol (Lond) 370: 651– 678, 1986. FUNK GD AND FELDMAN JL. Generation of respiratory rhythm and pattern in mammals: insights from developmental studies. Curr Opin Neurobiol 5: 778 –785, 1995. GAO BX, CHENG G, AND ZISKIND-CONHAIM L. Development of spontaneous synaptic transmission in the rat spinal cord. J Neurophysiol 79: 2277–2287, 1998. GAO B-X AND ZISKIND-CONHAIM L. Development of glycine- and GABA-gated currents in rat spinal motoneurons. J Neurophysiol 74: 113–121, 1995. HAUSSER M AND CLARK BA. Tonic synaptic inhibition modulates neuronal output pattern and spatiotemporal synaptic integration. Neuron 19: 665– 678, 1998. HIRONAKA T, MORITA Y, HAGIHIRA S, TATENO E, KITA H, AND TOHYAMA M. Localization of GABAA-receptor ␣1 subunit mRNA-containing neurons in the lower brainstem of the rat. Mol Brain Res 7: 335–345, 1990. IANSEK R AND REDMAN SJ. An analysis of the cable properties of spinal motoneurones using a brief intracellular current pulse. J Physiol (Lond) 234: 613– 636, 1973. JONAS P, BISCHOFBERGER J, AND SANDKUHLER J. Corelease of two fast neurotransmitters at a central synapse. Science 281: 419 – 424, 1998. KELLERTH J-O, MELLSTROM A, AND SKOGLUND S. Postnatal excitability changes of kitten motoneurones. Acta Physiol Scand 83: 31– 41, 1971. ´ -RODR´IGUEZ F, AND CHASE MH. Strychnine blocks KOHLMEIER KA, LOPEZ inhibitory postsynaptic potentials elicited in masseter motoneurons by sensory stimuli during carbachol-induced motor atonia. Neuroscience 78: 1195–1202, 1997. KUBIN L, REIGNIER C, TOJIMA H, TAGUCHI O, PACK AI, AND DAVIES RO. Changes in serotonin level in the hypoglossal nucleus region during carbachol-induced atonia. Brain Res 645: 291–302, 1994. KUBIN L, TOJIMA H, REIGNIER C, PACK AI, AND DAVIES RO. Interaction of serotonergic excitatory drive to hypoglossal motoneurons with carbacholinduced, REM sleep-like atonia. Sleep 19: 187–195, 1996. LEWIS CA AND FABER DS. GABA responses and their partial occlusion by glycine in cultured rat medullary neurons. Neuroscience 52: 83–96, 1993. MA W, BEHAR T, AND BARKER JL. Transient expression of GABA immunoreactivity in the developing rat spinal cord. J Comp Neurol 325: 271–290, 1992. MA W, SAUNDERS PA, SOMOGYI R, POULTER MO, AND BARKER JL. Ontogeny of GABAA receptor subunit mRNAs in rat spinal cord and dorsal root ganglia. J Comp Neurol 338: 337–359, 1993. MARTINA M, STRATA F, AND CHERUBINI E. Whole cell and single channel properties of a new GABA receptor transiently expressed in the hippocampus. J Neurophysiol 73: 902–906, 1995. ˜ -ABADES PA, SPIELMANN JM, AND CAMERON WE. Anatomical MAZZA E, NU´ NEZ and electrotonic coupling in developing genioglossal motoneurons of the rat. Brain Res 598: 127–137, 1992. MORALES FR, ENGELHARDT JK, SOJA PJ, PEREDA AE, AND CHASE MH. Motoneuron properties during motor inhibition produced by microinjection of carbachol into the pontine reticular formation of the decerebrate cat. J Neurophysiol 57: 1118 –1129, 1987. NAVARRETE R AND VRBOVA´ G. Activity-dependent interactions between motoneurones and muscles: their role in the development of the motor unit. Prog Neurobiol 41: 93–124, 1993. ˜ -ABADES PA AND CAMERON WE. Morphology of developing rat genioNU´ NEZ glossal motoneurons studied in vitro: relative changes in diameter and surface area of somata and dendrites. J Comp Neurol 353: 129 –142, 1995. ˜ -ABADES PA AND CAMERON WE. Relationship between membrane propNU´ NEZ erties and cell size of developing rat genioglossal motoneurons studied in vitro. Neurosci Lett 223: 41– 44, 1997. ˜ -ABADES PA, HE F, BARRIONUEVO G, AND CAMERON WE. Morphology NU´ NEZ of developing rat genioglossal motoneurons studied in vitro: changes in length, branching pattern, and spatial distribution of dendrites. J Comp Neurol 339: 401– 421, 1994. ˜ -ABADES PA, SPIELMANN JM, BARRIONUEVO G, AND CAMERON WE. In NU´ NEZ vitro electrophysiology of developing genioglossal motoneurons in the rat. J Neurophysiol 70: 1401–1411, 1993. O’BRIEN JA AND BERGER AJ. Cotransmission of GABA and glycine to brain stem motoneurons. J Neurophysiol 82: 1638 –1641, 1999. ¨ RNUNG G, OTTERSEN OP, CULLHEIM S, AND ULFHAKE B. Distribution of O glutamate-, glycine- and GABA-immunoreactive nerve terminals on dendrites in the cat spinal motor nucleus. Exp Brain Res 118: 517–532, 1998.
SYNAPTIC CONDUCTANCES IN DEVELOPING RAT MOTONEURONS ¨ RNUNG G, SHUPLIAKOV O, LINDA H, OTTERSEN OP, STORM-MATHISEN J, O ULFHAKE B, AND CULLHEIM S. Qualitative and quantitative analysis of glycine- and GABA-immunoreactive nerve terminals on motoneuron cell bodies in the cat spinal cord: a postembedding electron microscopic study. J Comp Neurol 365: 413– 426, 1996. ¨ RNUNG G, SHUPLIAKOV O, OTTERSEN OP, STORM-MATHISEN J, AND CULLHEIM O S. Immunohistochemical evidence for coexistence of glycine and GABA in nerve terminals on cat spinal motoneurones: an ultrastructural study. Neuroreport 5: 889 – 892, 1994. PERSOHN E, MALHERBE P, AND RICHARDS JG. Comparative molecular neuroanatomy of cloned GABAA receptor subunits in the rat CNS. J Comp Neurol 326: 193–216, 1992. POULTER MO, BARKER JL, O’CARROLL AM, LOLAIT SJ, AND MAHAN LC. Differential and transient expression of GABAA receptor alpha-subunit mRNAs in the developing rat CNS. Neuroscience 12: 2888 –2900, 1992. POULTER MO, BARKER JL, O’CARROLL AM, LOLAIT SJ, AND MAHAN LC. Co-existent expression of GABAA receptor beta 2, beta 3 and gamma 2 subunit messenger RNAs during embryogenesis and early postnatal development of the rat central nervous system. Neuroscience 53: 1019 –1033, 1993. RAPP M, SEGEV I, AND YAROM Y. Physiology, morphology and detailed passive models of guinea-pig cerebellar Purkinje cells. J Physiol (Lond) 474: 101– 118, 1994. REDMAN SJ, MCLACHLAN EM, AND HIRST GD. Nonuniform passive membrane properties of rat lumbar sympathetic ganglion cells. J Neurophysiol 57: 633– 644, 1987. REKLING JC, FUNK GD, BAYLISS DA, DONG XW, AND FELDMAN JL. Synaptic central of motoneuronal excitability. Physiol Rev 80: 767– 852, 2000. ROBINSON DW AND CAMERON WE. Analysis of the resting membrane conductance in rat hypoglossal motoneurons using patch-clamp techniques. Soc Neurosci Abstr 24: 913, 1998. ROBINSON DW AND CAMERON WE. Time-dependent changes in input resistance of hypoglossal motoneurons associated with whole-cell recording. J Neurophysiol 83: 3160 –3164, 2000. ROHRBOUGH J AND SPITZER NC. Regulation of intracellular Cl⫺ levels by Na⫹-dependent Cl⫺ cotransport distinguishes depolarizing from hyperpolarizing GABAA receptor–mediated responses in spinal neurons. J Neurosci 16: 82–91, 1996. SCHOUSBOE A AND REDBURN DA. Modulatory actions of gamma aminobutyric acid (GABA) on GABA type A receptor subunit expression and function. J Neurosci Res 41: 1–7, 1995. ¨ RNUNG G, BRODIN L, ULFHAKE B, OTTERSEN OP, STORMSHUPLIAKOV O, O MATHISEN J, AND CULLHEIM S. Immunocytochemical localization of amino acid neurotransmitter candidates in the ventral horn of the cat
2329
spinal cord: a light microscopic study. Exp Brain Res 96: 404 – 418, 1993. SINGER JH AND BERGER AJ. Contribution of single-channel properties to the time course and amplitude variance of quantal glycine currents recorded in rat motoneurons. J Neurophysiol 81: 1608 –1616, 1999. SINGER JH, TALLEY EM, BAYLISS DA, AND BERGER AJ. Development of glycinergic synaptic transmission to rat brain stem motoneurons. J Neurophysiol 80: 2608 –2620, 1998. SMITH JC, ELLENBERGER HH, BALLANYI K, RICHTER DW, AND FELDMAN JL. Pre-Botzinger complex: a brainstem region that may generate respiratory rhythm in mammals. Science 254: 726 –729, 1991. ST. JOHN PA AND STEPHENS SL. Adult-type glycine receptors form clusters on embryonic rat spinal cord neurons developing in vitro. J Neurosci 13: 2749 –2757, 1993. TAKAHASHI T, MOMIYAMA A, HIRAI K, HISHINUMA F, AND AKAGI H. Functional correlation of fetal and adult forms of glycine receptors with developmental changes in inhibitory synaptic receptor channels. Neuron 9: 1155–1161, 1992. TODD AJ, WATT C, SPIKE RC, AND SIEGHART W. Colocalization of GABA, glycine, and their receptors at synapses in the rat spinal cord. J Neurosci 16: 974 –982, 1996. UMEMIYA M AND BERGER AJ. Inhibition by riluzole of glycinergic postsynaptic currents in rat hypoglossal motoneurones. Br J Pharmacol 116: 3227–3230, 1995. WALTON KD AND NAVARRETE R. Postnatal changes in motoneurone electrotonic coupling studied in the in vitro rat lumbar spinal cord. J Physiol (Lond) 433: 283–305, 1991. WITHERS MD AND ST JOHN PA. Embryonic rat spinal cord neurons change expression of glycine receptor subtypes during development in vitro. J Neurobiol 32: 579 –592, 1997. XIA Y AND HADDAD GG. Ontogeny and distribution of GABAA receptors in rat brainstem and rostral brain regions. Neuroscience 49: 973–989, 1992. YAMUY J, FUNG SJ, XI M, MORALES FR, AND CHASE MH. Hypoglossal motoneurons are postsynaptically inhibited during carbachol-induced rapid eye movement sleep. Neuroscience 94: 11–15, 1999. ZENGEL JE, REID SA, SYPERT GW, AND MUNSON JB. Membrane electrical properties and prediction of motor-unit type of medial gastrocnemius motoneurons in the cat. J Neurophysiol 53: 1323–1344, 1985. ZISKIND-CONHAIM L. Electrical properties of motoneurons in the spinal cord of rat embryos. Dev Biol 128: 21–29, 1988. ZISKIND-CONHAIM L. NMDA receptors mediate poly- and monosynaptic potentials in motoneurons of rat embryos. J Neurosci 10: 125–135, 1990.