Feb 3, 1997 - Rotation Sensing with an Atom Interferometer. Alan Lenef, Troy D. Hammond, Edward T. Smith, Michael S. Chapman, Richard A. Rubenstein, ...
VOLUME 78, NUMBER 5
PHYSICAL REVIEW LETTERS
3 FEBRUARY 1997
Rotation Sensing with an Atom Interferometer Alan Lenef, Troy D. Hammond, Edward T. Smith, Michael S. Chapman, Richard A. Rubenstein, and David E. Pritchard Department of Physics and Research Laboratory of Electronics, Massachusetts Institute of Technology, Cambridge, Massachusetts 02139 (Received 12 August 1996) We have measured the phase shift induced by rotation of an atom interferometer at rates of 22 to 12 earth rates and obtained 1% agreement with the predicted Sagnac phase shift for atomic matter waves. The rotational rms noise of our interferometer was 42 milliearth rates for 1 sec of integration time, within 9% of shot noise. The high sensitivity and agreement of predicted and measured behavior suggest useful future scientific applications of atom interferometers as inertial sensors. [S0031-9007(96)02186-2] PACS numbers: 03.75.Dg, 06.30.Gv
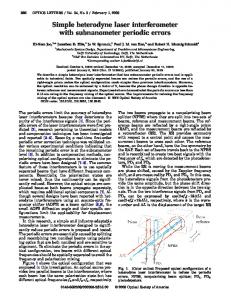
appear shifted if the interferometer moves with respect to this inertial frame while the atoms are in transit. Figure 1 shows the interferometer subject to rotation in a counterclockwise direction about an axis normal to the plane defined by the beam paths. The center line of the interferometer is shown for times t 0 and t 2t, L where t y is the time it takes an atom moving with velocity y to travel the distance L between adjacent gratings. For rotation about the middle of the second grating, the center line between the atom paths passes through the middle of both the first and second gratings, so fringes form on the t 0 center line at time 2t. The middle of the third grating is now displaced by D 2tVL, where 2tV is the angular displacement of the interferometer axis in the time 2t. This relative displacement of the third grating and fringes is observed as a phase shift ! " √ !# √ 4p L2 2D V 2 frot 2p dg dg y ∑ ∏ 4pmA 2 V, (1) h where dg is the period of the gratings, A L2 sldB ydg d is the area enclosed by the paths of the interferometer, and ldB hymy is the de Broglie wavelength for an atom with mass m and velocity y. We refer to the bracketed
Since the pioneering demonstrations of interferometry with atom de Broglie waves using nanofabricated structures [1–4] and resonant light as atomic beam splitters [5,6], a number of new applications have been explored with these devices, including measurements of atomic and molecular properties, fundamental tests of quantum mechanics, and studies of various inertial effects [7–13]. Using atom interferometers as inertial sensors is of interest for geophysics, for testing relativity, and for inertial guidance systems. Atom interferometers have already demonstrated considerable sensitivity to gravitational acceleration [9], and their projected sensitivity to rotational motion [14] exceeds that of the best laboratory ring laser gyroscopes [15] because their Sagnac phase shifts, proportional to the total mass energy of the interfering particle, are 1010 times larger for atoms than for photons traversing the same geometry. While inertial effects have been demonstrated in neutron and electron interferometers, [16–19], these measurements have been limited by low count rates and low mass, respectively. We measured the response and reproducibility of an atom interferometer to applied rotations with angular rates on the order of the rotation rate of the earth (one earth rate, Ve , is 7.3 3 1025 radysec or 15 degrees per hour). We obtained better than 1% agreement with theory (one standard deviation) over a range of 62Ve , a factor of 10 improvement in accuracy over previous measurements of the Sagnac phase with an atom interferometer [6], and a factor of 6 improvement in accuracy over a recent measurement of the classical fringe phase in a three grating atom deflectometer [20]. We have carefully studied the rotational noise by repeatedly measuring an applied rotation of about 50mVe . We found the reproducibility of our rotation measurements to be 42mVe in 1 sec, within 9% of that predicted from shot noise alone. This sensitivity is several orders of magnitude better than in Refs. [6,20], where the noise was not carefully studied. The inertial sensitivity of an atom interferometer arises because the freely propagating atoms form fringes with respect to an inertial reference frame. These fringes
FIG. 1. The rotating interferometer (not to scale). The location of the interferometer axis is shown at times t 0 (short dash) and t 2t (short-long dash), where t is the transit time of the atoms between adjacent gratings.
760
© 1997 The American Physical Society
0031-9007y97y78(5)y760(4)$10.00
VOLUME 78, NUMBER 5
PHYSICAL REVIEW LETTERS
3 FEBRUARY 1997
term in Eq. (1) as the rotational response factor, which had a value of 1.940 6 0.005 radyVe in this experiment. The total phase shift from inertial effects is the sum of contributions from rotation and acceleration [3],
the predictions of Eqs. (1) and (4). The interferometer was suspended from a cable attached to the ceiling and driven off center with a sinusoidally varying force at frequency f, inducing a time dependent rotation rate
finert frot 1 facc .
Vstd V0 sins2pftd .
(2)
Relativistic corrections to Eqs. (1) and (2) are of the order 1 2 2 syycd smaller than the nonrelativistic terms and are negligible in our experiment [21]. The total average count rate of detected atoms is knl n0 f1 1 C cossfinert 1 fgrat dg 1 nb ,
(3)
where n0 is the average rate at which atoms are transmitted through the third grating and detected, C is the contrast of the fringes, nb is the average background rate, and fgrat is an independently applied phase determined by the relative transverse grating positions. To measure the inertial phase, finert , we scan one of the gratings to sample the fringe pattern, nsfgrat d, and determine finert by a least squares fit to a sinusoid [2]. If only Poissonian detection statistics degrade the signal-to-noise ratio [22], the standard deviation of this measurement would be s ∂ µ 1 2 nb 2 1y2 kDfinert l ; ksf inert 2 finert d l , 11 C n0 T n0 (4) where T is the total time over which the atom counts are ¯ inert is the average of many independent sampled, and f phase measurements. The rotational noise for sampling time, T , is obtained from Eq. (1) and Eq. (4), s ∂ µ nb 2 h (5). 11 kDVl 4pmAC n0 T n0 We have assumed equal sampling over the entire fringe pattern in Eq. (4), and Eq. (5). If instead of evenly distributing fgrat it were adjusted to maintain a lock on the steepest part of the atomic fringe, kDfinert l and kDVl p would be reduced by a factor of 2. Our atom interferometer is described in Refs. [2,3]. Fringes are formed by atoms passing through three 200 nm period nanofabricated transmission gratings [24] separated from each other by a distance of L 0.66 m. The source produces a seeded supersonic Na atomic beam using rare gas as the carrier and provides an rms velocity spread of about 4%. With an argon carrier gas the mean beam velocity is about 1030 m/sec. The Na atoms are ionized on a hot 50 mm diameter rhenium wire and counted using a channel electron multiplier. Improved nanofabricated gratings [24] have good phase uniformity over a 1 mm 3 0.1 mm area, allowing us to maintain 17% contrast even with overlapping diffraction orders and to achieve a count rate of 200k countsysec with an illuminated detector area of 5 3 1024 cm2 . Experiments were performed to measure both the rotational response factor and the reproducibility of our interferometer, followed by subsequent comparison with
(6)
V0 was typically several earth rates for the response factor measurement and about Ve y20 for the noise measurements. For the response measurements, f was chosen to be about 1 Hz in order to minimize deformations of our interferometer (which has several prominent mechanical resonances in the 10 to 30 Hz frequency range). For the noise measurements, f was approximately 4.6 Hz where the residual rotational noise spectrum of the apparatus had a broad minimum. We measured the acceleration and rotational motion of the suspended interferometer using accelerometers near the first and third gratings. We acquired data while modulating the grating phase with a sawtooth pattern at a frequency just less than 1 Hz. Simultaneously, we recorded the phase, fgrat , the counts from the atom interferometer, knl, and the accelerometer readings at one millisecond intervals. The rotation rate of the interferometer, as determined from the accelerometer readings (after suitable correction for their known frequency response), was used to predict the atom phase. We called this predicted inertial phase frot , there being a negligible contribution from acceleration in Eq. (2). To study the magnitude and linearity of the response factor, we binned the interferometer data according to frot . Since the frequency of the sawtooth modulation of fgrat was chosen to be incommensurate with the drive frequency, the data in a bin with a particular value of frot had a variety of values fgrat . This allowed us to make a fit using Eq. (3) to determine the atom phase finert , here called fmeas . A plot of fmeas vs frot is shown in Fig. 2 from a combination of runs, each 20 sec long, totaling approximately 400 sec (10 sec per point). The data reveal a linear response with the ratio of observed to predicted phase, fmeas satom interferometerd 1.008s0.004ds0.005d , frot saccelerometer signalsd (7) indicating an average response factor within error of that predicted from Eq. (1). The first error is the statistical error of the fit dominated by shot noise limited detection (0.35%) and includes phase drifts of the atom interferometer (0.15%), uncertainty in the atom beam velocity (0.15%), and noise from the accelerometer amplifiers (0.1%). The second error results from systematic contributions including those in the rotation phase inferred with the accelerometers (0.3%) and uncertainty in the measured grating positions due to mechanical distortions of the vacuum housing (0.4%). To determine the reproducibility of the measurements, rotational oscillations of amplitude approximately Ve y20 761
VOLUME 78, NUMBER 5
PHYSICAL REVIEW LETTERS
FIG. 2. Rotation rates in the atom interferometer. The rotation rate, Vmeas , determined from the interferometer rotational phase response [Eq. (1)], is plotted versus the reference, Vrot , determined using rotation rates inferred from the accelerometer signals. Residuals for the linear fit to the data are shown below. Approximately 6.5 min of data s,10 secypointd are plotted. The best fit (solid line) yields a slope of 1.008 6 0.007.
were applied to the interferometer at f 4.6 Hz. The rapidly varying phase produced by these oscillations was v u u kDVsT dl t
measured with a phase modulation technique that converted atom counts directly into finert std. This was accomplished by scanning the second grating position, xgrat , with a sawtooth waveform chosen to add a carrier frequency of 8 Hz to the atom count rate in Eq. (3). The rotationally induced phase, finert , was then deterx mined by multiplying the count rate by sins2p dgrat d and g xgrat coss2p dg d (these functions are in effect the local oscillators), filtering out components at 16 Hz, and taking the arctangent. For each of N 30 independent data sets 32 sec long, we obtained time dependent inertial phases, fninert std, from which the angular rotation rates Vn std were calculated using the rotational response factor from Eq. (1) (there being negligible contributions from accelerations). Rotation rates for various sample sizes, T , ranging from 1 to 32 sec in length, were taken from the middle of each independent set and Fourier transformed to yield normalized windowed spectra, 0 1 p T B 2 Z ivt C (8) jVn sv; T dj B e Vn stdwstddt C @ A, T 0
where wstd is a Hanning window function used to minimize Gibb’s oscillations in the spectrum [25]. The window wstd is normalized so that the average of the peaks in Vn sva ; Td (at va 2pf) equals the amplitude V0 of the applied rotation [Eq. (6)]. We then measured the fluctuation of the spectral peak amplitude at f,
∂2 N µ X 1 X 1 jVn sva ; T dj jVn sva ; T dj 2 sN 2 1d n N n
for the various sample sizes T . These results are summarized in Fig. 3 which exhibits the noise kDVsT dl as a function of T and wstd. The shot noise limit must be calculated using an effective integration time that is the actual integration time, T , times 2y3 the rms width of the time window when using the Hanning function in Eq. (8). We attribute the excess noise of the interferometer relative to shot noise seen in Fig. 3, for T greater than 2 sec, to extraneous sources of rotational motion rather than to any intrinsic failure of atom interferometers. The observed noise can be fit as an uncorrelated sum of shot noise, SNL, and background rotational noise, B, times an overestimation factor, a, q (10) kDVl a sSNLd2 1 B2 . The overestimation factor, a 1.09 6 0.02, is close to unity, and is consistent with noise arising from imperfections in our modulation scheme together with the previous observation of super-Poissonian noise from our 762
3 FEBRUARY 1997
(9)
hot wire detector [26]. The background noise determined from the fit is B 10mVe 6 1mVe . While this is more than the 5mVe measured using the accelerometers when the sinusoidal drive is off (and attributed to vibrations in the wires, water pipes, and vacuum foreline attached to the apparatus), we observe significant but variable additional contributions at the drive frequency when the drive is applied. This additional noise, ascribed to variations in the amplitude of the rotational drive and noise from the laser interferometer used to measure fgrat , is sufficient to account for the observed rotational background noise, B. In summary, our results show a direct measurement of rotations more than four orders of magnitude smaller than the first observations of the Sagnac phase in an atom interferometer [6] and approach short term rotational noise or angle random walk measured in commercial laser gyroscopes [27]. Our results show better than 1% agreement with the Sagnac theory for matter waves. In addition, careful studies of the rotational noise of our
VOLUME 78, NUMBER 5
PHYSICAL REVIEW LETTERS
FIG. 3. Reproducibility of rotation rate measurements in the atom interferometer. Fluctuations in the spectral peak amplitude at the driving frequency, f 4.6 Hz (for N 30 data sets), are compared to the predicted shot noise (dashed line) and plotted versus integration time, T . A fit to the data points with Eq. (10) (solid line) yields an overestimation factor a 1.09 6 0.02 and a background B 10 mVe 6 1 mVe .
interferometer (not performed in Refs. [6] or [20]) show it to be shot noise limited for averaging times ,2 sec, and consistent with the observed excess rotational noise of our apparatus at longer times. In light of these results, it is interesting to consider the rotational noise of an atom interferometer designed for inertial sensing with large area gratings and a high flux source. For example, a 1 m long Cs interferometer with an 80±C effusive oven (y 260 mysec) that contains 1 cm2 , 100 nm period gratings and a 1 cm2 source opening would produce a detected flux of about 1010 atomsysec and give shot p noise limited rotational noise of about 3 3 1028 Ve y Hr [28]. To compensate for thermal drifts, two atomic beams could traverse the gratings in opposite directions. Using a slow atom beam would decrease the noise by another two orders of magnitude. With larger instruments and careful engineering, interesting applications appear within reach. We thank M. Rooks of the Cornell Nanofabrication Facility for collaboration in making the gratings and D. Kokorowski for his work on the experimental apparatus. This work was supported by Army Research Office Contracts DAAL03-89-K-0082, and ASSERT 29970-PH-AAS, Office of Naval Research Contract N00014-89-J-1207, National Science Foundation Contract 9222768-PHY, the Joint Services Electronics Program Contract DAAL03-89-C-0001, and Charles Stark Draper Laboratory DL-H-484775 9. E. T. Smith acknowledges support from the National Science Foundation.
3 FEBRUARY 1997
[1] D. W. Keith, Ph.D. Thesis, M. I. T. (1991). [2] D. W. Keith, C. R. Ekstrom, Q. A. Turchette, and D. E. Pritchard, Phys. Rev. Lett. 66, 2693 (1991). [3] J. Schmiedmayer et al., Atom Interferometry; Advances in Atomic and Molecular Physics, Supplement 3, edited by P. R. Berman (Academic Press, New York, 1996). [4] O. Carnal and J. Mlynek, Phys. Rev. Lett. 66, 2689 (1991). [5] M. Kasevich and S. Chu, Phys. Rev. Lett. 67, 181 (1991). [6] F. Riehle, T. Kisters, A. Witte, J. Helmcke, and C. J. Borde, Phys. Rev. Lett. 67, 177 (1991). [7] D. S. Weiss, B. N. Young, and S. Chu, Phys. Rev. Lett. 70,2706 (1993). [8] J. Schmiedmayer, M. S. Chapman, C. R. Ekstrom, T. D. Hammond, S. Wehinger, and D. E. Pritchard, Phys. Rev. Lett. 74, 1043 (1995). [9] M. A. Kasevich, Ph.D. Thesis, Stanford (1992). [10] C. R. Ekstrom, J. Schmiedmayer, M. S. Chapman, T. D. Hammond, and D. E. Pritchard, Phys. Rev. A 51, 3883 (1995). [11] M. S. Chapman, T. D. Hammond, A. Lenef, J. Schmiedmayer, R. A. Rubenstein, E. T. Smith, and D. E. Pritchard, Phys. Rev. Lett. 75, 3783 (1995). [12] M. S. Chapman, C. R. Ekstrom, T. D. Hammond, R. Rubenstein, J. Schmiedmayer, S. Wehinger, and D. E. Pritchard, Phys. Rev. Lett.74, 4783 (1995). [13] M. S. Chapman, C. R. Ekstrom, T. D. Hammond, J. Schmiedmayer, B. E. Tannian, S. Wehinger, and D. E. Pritchard, Phys. Rev. A 51,R14 (1995). [14] J. F. Clauser, Physica (Amsterdam) 151B, 262-272 (1988). [15] R. Anderson, H. R. Bilger, and G. E. Stedman, Am. J. Phys. 62, 975-985 (1994). [16] D. K. Atwood, M. A. Horne, C. G. Shull, and J. Arthur, Phys. Rev. Lett. 52, 1673-1676 (1984). [17] F. Hasselbach and M. Nicklaus, Phys. Rev. A 48, 143151(1993). [18] S. A. Werner, H. Kaiser, M. Arif, and R. Clothier, Physica B151, 22-35 (1988). [19] S. A. Werner, J. L. Staudenmann, and R. Colella, Phys. Rev. Lett. 42, 1103-1105 (1979). This and [16] present results showing 0.4% agreement with the predicted sensitivity factor but do not determine rotational noise (which appears in [19] to be roughly 4 times larger than ours). [20] M. K. Oberthaler, S. Bernet, E. M. Rasel, J. Schmiedmayer, and A. Zeilinger, Phys. Rev. A 54, 3165-3176 (1996). [21] J. Anandan, Phys. Rev. D 15, 1448-1457 (1977). [22] M. O. Scully, and J. P. Dowling, Phys. Rev. A 46, 31863190 (1993). Unfortunately, we don’t know the exact number of interfering particles. [23] D. J. Wineland, J. J. Bollinger, W. M. Itano, and F. L. Moore, Phys. Rev. A 46, R6797-R6800 (1992). [24] M. J. Rooks, R. C. Tiberio, M. S. Chapman, T. D. Hammond, E. T. Smith, A. Lenef, R. A. Rubenstein, D. E. Pritchard, and S. Adams, J. Vac. Sci. Technol. B 13, 2745 (1995). [25] A. V. Oppenheim and R. W. Schafer, Digital Signal Processing (Prentice-Hall, Englewood Cliffs, NJ, 1975). [26] C. R. Ekstrom, Ph.D. Thesis, M.I.T. (1994). [27] Andrew Sensor Products, Specification Format Guide and Test Procedure for Single Axis Laser Gyros (1994). [28] M. Kasevich et al. have recently shown encouraging results using a Cs atom interferometer with light gratings.
763