Runtime Performance Challenges in Big Data Systems John Klein and Ian Gorton Software Engineering Institute at Carnegie Mellon University 4500 Fifth Ave. Pittsburgh, PA, USA {jklein, igorton}@sei.cmu.edu
ABSTRACT
Beyond the Internet companies, data-intensive systems and big data applications are becoming pervasive across a wide range of business and scientific domains. For example,
Big data systems are becoming pervasive. They are distributed systems that include redundant processing nodes, replicated storage, and frequently execute on a shared “cloud” infrastructure. For these systems, design-time predictions are insufficient to assure runtime performance in production. This is due to the scale of the deployed system, the continually evolving workloads, and the unpredictable quality of service of the shared infrastructure. Consequently, a solution for addressing performance requirements needs sophisticated runtime observability and measurement. Observability gives real-time insights into a system’s health and status, both at the system and application level, and provides historical data repositories for forensic analysis, capacity planning, and predictive analytics. Due to the scale and heterogeneity of big data systems, significant challenges exist in the design, customization and operations of observability capabilities. These challenges include economical creation and insertion of monitors into hundreds or thousands of computation and data nodes, efficient, low overhead collection and storage of measurements (which is itself a big data problem), and application-aware aggregation and visualization. In this paper we propose a reference architecture to address these challenges, which uses a model-driven engineering toolkit to generate architecture-aware monitors and application-specific visualizations.
Categories and Subject Descriptors C.4 [Performance of Systems]: Measurement techniques, Performance attributes. D.2.11 [Software Engineering]: Software Architectures – Domain-specific software architectures, languages, patterns.
General Terms
•
Modern commercial airliners produce approximately 0.5TB of operational data per flight [2]. This data can be used to diagnose faults, optimize fuel consumption, and predict maintenance. Airlines must build scalable systems to capture, manage, and analyze this data to improve reliability and reduce costs.
•
Big data analytics for healthcare could save an estimated $450 billion in the USA [3]. Analysis of petabytes of data across patient populations, taken from diverse sources such as insurance payers, public health, and clinical studies, can extract new insights for disease treatment and prevention, and reduce costs by improving patient outcomes and operational efficiencies.
•
In operation, the Square Kilometer Array telescope will generate 1TB/sec of pre-processed data, which results in one exabyte of data every 13 days. Even with significant aggregation, this system will need a sophisticated data archive and distribution system to delivery exabytes of observation data to astronomers (https://www.skatelescope.org/software-and-computing).
•
By one estimate, there are 14,000 million “things” with sensors, generating data that is communicated over the Internet. By the year 2020, this Internet of Things (IoT) will generate 4 zettabytes of data per year supporting automation monitoring, and optimization of processes and services around the world [4].
With systems at these immense scales, meaningful design time performance prediction becomes essentially infeasible, both theoretically and pragmatically. Building models to represent complex static and dynamic component compositions in both the system and the underlying infrastructure, exploiting multiple architecture styles, and accurately representing combinations of heterogeneous and uncertain workloads challenges the state of the art in performance modeling. Pragmatically, even if it were possible to build such models, post-deployment data growth, shared cloud-based infrastructures, and rapid application evolution would render model results invalid more or less immediately.
Performance, Measurement.
Keywords Observability, Model-Driven Engineering, Big Data
1. INTRODUCTION The exponential growth of data in the last decade has fueled rapid evolution in the scale of software systems. Internet-born organizations such as Google and Facebook are at the cutting edge of this scale-driven revolution, collecting, managing, storing, and analyzing several petabytes of new data every day, and operating some of the largest data repositories ever constructed [1].
For these reason, assuring runtime performance at scale must be based on observing and analyzing actual application behavior. Observability provides real-time insights into system health and status, both at the infrastructure and application level, and provides historical data repositories for forensic analysis, capacity planning, and potentially for predictive analytics based on statistical techniques.
Permission to make digital or hard copies of all or part of this work for personal or classroom use is granted without fee provided that copies are not made or distributed for profit or commercial advantage and that copies bear this notice and the full citation on the first page. Copyrights for components of this work owned by others than ACM must be honored. Abstracting with credit is permitted. To copy otherwise, or republish, to post on servers or to redistribute to lists, requires prior specific permission and/or a fee. Request permissions from
[email protected]. WOSP-C'15, January 31 2015, Austin, TX, USA Copyright 2015 ACM 978-1-4503-3340-5/15/01…$15.00 http://dx.doi.org/10.1145/2693561.2693563
This paper discusses the challenges of building massively scalable, easily configurable and lightweight observability
17
Furthermore, after the system is deployed and in production, there is typically no control over the number of input sources and associated inputs data rates (unless the system simply discards input data). This means the size of data being managed and analyzed quickly grows beyond predicted volumes, rendering predictions unreliable. There is also no control over the number of users and external applications, and the queries they make (unless the system rejects requests). Finally, a shared cloud infrastructure may not provide the expected continuous quality of service due to contention for resources at all levels (storage, network, and processor) and due to infrastructure failures [9][10].
solutions that can form the basis of performance monitoring and analysis solutions. In response to these challenges, we propose and outline an approach for observability based on a model-driven toolkit that is the focus of our current research.
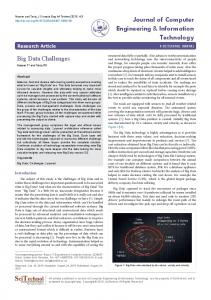
2. CHARACTERISTICS OF BIG DATA SYSTEMS The major runtime elements of a typical big data system are shown in Figure 1. Inputs from sensors, devices, humans, and other systems are delivered to the system, where they are ingested through a pipeline that translates and transforms the data and writes it to a persistent store. The persistent store is frequently “polygot”, employing a heterogeneous mix of SQL, NoSQL, and NewSQL technologies [5]. Users query stored data through many types of devices and applications. Some applications are within the system (i.e. under the same design and operational authority as the system), while other applications may be independent of the system and integrated through various endpoint mechanisms. The system executes in a cloud infrastructure, shared with other systems.
These challenges of managing and evolving system performance must therefore be addressed by instrumenting the system to observe runtime behavior, and by aggregating the collected performance measurements to identify trends and issues. In production, there is a close relationship between performance and system health. For example, in a distributed system with asynchronous communication, high response latency is generally indistinguishable from node failure or network partition. In addition, due to the fan out inherent in processing individual requests, many nodes will contribute to the latency of any particular response. In systems with redundant processing capacity and replicated storage, a sequence of identical requests may be executed by different sets of nodes, with each set inevitably having different composite performance/health characteristics. This leads to a complex relationship between the performance/health of an individual node and end-to-end system performance [7].
Big data systems are typically horizontally scaled distributed systems, operating over clusters of hundreds or thousands of compute and storage nodes [6]. Requests to read and write data fan out to many nodes, executing pipeline and/or parallel topologies, resulting in highly variable response latency [7]. In this context, servers are treated as “cattle, not pets” [8], meaning that nodes are expected to fail, and to be casually replaced with new instances. Redundant processing and replicated storage capabilities shift the primary concern to the herd (cluster), not to any individual (single server). This strategy requires applications to operate with partial failure as a normal condition [6].
Redundancy also makes it possible for a system to meet its service level requirements even when experiencing partial system failures. Seemingly catastrophic numbers of node failures may not impact system performance if the failures occur when the system contains spare capacity [10]. In scalable systems, components are often designed to ‘fail fast’ and employ stateless designs where possible to facilitate rapid recovery [11]. The performance data collected from the running system serves multiple purposes. These include operational monitoring, ongoing tuning, and preventative actions, such as adding capacity to handle load surges. These measurements also support system and architecture evolution, serving as “design time prototypes” for the next generation of the system. Finally, they may be used as part of an emerging autonomic capability [12]. In any runtime monitoring function, there are many common concerns. These include the intrusiveness of the monitoring on the host performance (measured in additional processor and memory utilization), measurement storage footprint (including retention and archiving), and user interface usability. However, in largescale big data systems, these concerns become challenges that have not been solved in practice, except for point solutions that are highly customized for a specific business need [13] and have required massive investments in time and effort.
Figure 1 - Typical Big Data System
3. THE NEED FOR OBSERVABILITY In the environment presented in Figure 1, design time predictions of system performance, produced through modeling or prototyping, can help to develop and evaluate the system’s architecture and components. However, design time prediction is insufficient to assure the runtime performance of these large-scale systems in production for two reasons. First, at such scale, high fidelity prototyping and model validation is not practical. The time and cost to generate petascale data sets, and the cost and complexity of thousand-node server clusters with millions of clients requires simplification and approximate characterization of the actual architecture styles and technologies to be used.
Hence, in the dynamic, uncertain runtime environments in which big data systems exist, some specific challenges of observability include: •
18
Monitoring a heterogeneous deployment at scale (1000s of nodes), with an ever-changing dynamic component configuration and load. While each component may have its own dedicated monitoring interface, nothing exists that can seamlessly integrate metrics from each component into the same monitoring framework. This forces every organization
other types of measurements. The Theia system [19] provides architecture-specific visualization for Hadoop-based systems.
to develop and maintain a custom observability solution to handle the specific components they have composed into their systems. •
Collection, storage, and compression of millions of time series metrics - a big data problem in itself - with acceptable overhead and footprint
•
Aggregating individual metrics into meaningful application performance indicators (e.g., total request load on all database nodes per second in a heterogeneous database environment with 1000’s of individual nodes)
•
Analytical environments supporting user-driven data exploration and analysis, as well as statistical techniques that can find patterns and trends in low level performance metrics.
Architecture-aware modeling based on architecture styles traces back to some of the earliest work in software architecture [20]. More recent work such as Rainbow [21] use architectural styles to model and generate a runtime framework focused on dynamic adaptation. The Rainbow framework uses measurement probes, which may include monitoring performance. However, the probes must be built into the components of the system, and the generation focuses on style-based reaction strategies when a probe’s measurement crosses a threshold. Finally, there has been very little work on using model-driven approaches to generate monitors. He and colleagues present an approach that takes steps in this direction [22]. They present a model-driven approach to composing monitors, synthesizing a compatible metamodel and then transforming heterogeneous monitors into that common metamodel. The approach does not leverage knowledge of architectural styles in the transformation, and generates only monitors, without aggregations, a measurement persistence schema, or visualizations.
Collectively, these challenges represent a major area of research for the software performance community. Currently, no open source or commercial technology exists that organizations can acquire, easily customize, and deploy to observe their big data systems [13]. This is a major problem given that the inherent complexity of building a low overhead and robust observability solution is a cost that most organizations are not prepared for as their scale up their systems. Creating a solution requires scalable and flexible mechanisms for observability, as well as new performance analysis techniques, packaged into a framework that organizations can rapidly customize to monitor their systems’ performance.
5. OUR APPROACH We are creating a solution that uses generation and automation to address the runtime performance monitoring challenges of big data systems. A model of the big data system is created and model-driven approaches are used to generate monitors and visualizations. These plug into a runtime framework that automates their deployment and the collection, aggregation, storage, and display of the performance data.
4. RELATED WORK Relevant prior work spans several areas. These include measurement collection, visualization, architecture-aware modeling, and model-based monitoring automation.
This solution comprises three elements to address the challenges of scale in big data systems. These are:
There has been significant prior work on collecting general measurements of resource utilization at process and node level. This has produced open source packages such as Collectd (www.collectd.org), Ganglia [14], and Nagios [15]. Ganglia and Splunk (www.splunk.com) support collection of host-level measurements across clusters, and provide basic monitoring and visualization dashboards. Commercial products from HP (http://www8.hp.com/us/en/software-solutions/systemsmanagement-server-monitoring-tools/), IBM (http:// www.ibm.com/software/tivoli), and others also provide similar collection and visualization capabilities. Tools such as Chukwa (wiki.apache.org/hadoop/Chukwa) and Sawzall (research.google.com/archive/sawzall.html) focus on general analytics on collected log data, including semantics for time series data sets. However, these tools are not designed to enable capture and analysis of detailed application-level performance metrics. They also have limited coverage for the heterogeneous components that commonly comprise big data systems [16], and hence have limited utility for a scalable and comprehensive observability framework. Experimental tools such as Otus [17], have demonstrated how to build on these basic collection capabilities to perform architecture-aware measurement and analysis. Otus is however limited to support only the Hadoop MapReduce architecture.
1.
A model-driven design time toolkit for formally specifying the observability requirements for a system, based on an architecture-aware metamodel.
2.
An extensible, customizable measurement framework that forms the core of the observability runtime architecture. This includes the distributed metric collection and aggregation framework, adaptors to monitor off-the-shelf components, and a data model for storing time series-based metrics.
3.
A visualization toolkit that uses novel metaphors to visualize massive amounts of measured data from executing systems.
Figure 2 shows how these solution elements are used together. Our current focus is on elements (1) and (2), which we expand upon below. Element (3) is discussed briefly in Section 6, as future work.
5.1 Model-Driven Design Time Toolkit Our model-driven toolkit is based on a metamodel for big data systems that links the runtime functional structure of the system with the observability and analysis framework discussed in the next section. The metamodel precisely represents, in terms of components, properties, relationships and constraints, the syntax and semantics of an observability framework for scalable, big data architectures. Figure 3 shows some of the key concepts in the metamodel. The elements represent the common, reusable components that form an observability framework. The Observability element is the root of the metamodel, and has a collection of properties that must be specified in a system model to configure the basic observability
In the visualization of large-scale system health and performance, work by Yin and colleagues take a novel approach inspired by video games to enable navigation through a complex data landscape [18]. In this case, the focus was on infrastructure-level measurement data, however the approach may be extensible for
19
architecture description language (ADL) [24] to create a formal description of the semantics of components and connectors within a particular architectural style, and the composition constraints for creating configurations (systems) that conform to the style. However, the solution does not depend on specific features of Acme, and other ADLs that allow representation of runtime components and connectors (e.g., AADL) could be used. The formal description also specifies the properties that should be exposed as performance metrics by elements of the metamodel that conform to the style. As shown in Figure 2, experts or researchers use an ADL to create the formal definition of an architectural style. This formal definition then becomes part of the metamodel for the model-driven toolkit. This approach has the strength of being extensible, enabling new architecture styles to be formally defined and incorporated into the metamodel.
framework behavior. These properties include, for example, the data model for measurements capture, default behavior for handling failures, and storage location for the collected measurements. ADL Uses
Creates Experts & Researchers
Style Definition - Component Types - Connector Types - Configuration Constraints - Properties Metamodel
Uses Big Data System Architect
MDE Design Time Toolkit
Edits
System Architecture
Uses Generates Uses Uses Monitors
Visualizations
Deploys & Executes
Runtime Framework
Deploys & Executes
Visualization Toolkit
Figure 2 - Toolset Workflow The metamodel also contains elements that can be used to specify the architecture styles that a system utilizes. An architectural style (also referred to as an architectural pattern) defines a family of related systems, typically by providing a domain-specific design vocabulary together with constraints on relationships among the design elements. System-specific components, such as those that execute business logic, data transformations, and analytics, typically are based on architecture styles, and in a large-scale system, multiple architecture styles will be instantiated. Styles metamodel elements have associated properties that a system model must specify. For example, a MapReduce Style element has properties that specify the framework type (e.g. Hadoop), job names to monitor, location of the cluster, and end-to-end metrics to capture.
Figure 3 – Metamodel Key Concepts As shown in Figure 2, based on this metamodel, a system architect uses our model-driven toolkit to select and customize elements to create a system-specific model. We are utilizing an Eclipse Modeling Framework (EMF) tool chain (www.eclipse.org/emf) to specify the metamodel, build the model editor, and generate custom observability framework code. The EMF provides an extensible platform for both the architectureaware design time editor and the monitor and visualization generators. The architectural style defined using the ADL is transformed into a representation in the EMF Ecore metamodel, which can then be used by the EMF.Edit and EMF.Codegen frameworks. EMF.Edit supports construction of a graphical editor for use by big data system architects to describe an architecture that is an instantiation of a particular architecture style. After the architecture is described using EMF.Edit, EMF.Codegen will generate monitors compatible with the runtime framework, and visualizations compatible with the visualization toolkit’s dashboard.
Assets represent the components that comprise a big data system. The selection of an architecture style constrains the types of assets that can be instantiated in a model, and also constrains the topology of connections among the assets. For example, in the MapReduce style, allowable assets include Source Data Store, Mappers, Reducers, and an optional Destination Data Store (used only if the result will be persisted). Asset definitions for a number of off-the-shelf packages will be included in the initial solution, and extensibility to represent custom-developed packages will be provided. A general asset element has properties that include the set of metrics that can be captured from a given asset. Metric properties are expressed in categories that we have defined to mask the differences in terminologies used across different asset types. For example, with data base assets, properties are described in terms of categories representing database characteristics (e.g., size, number of replicas, data collections), database access (e.g., read and write performance), and host characteristics (e.g., memory usage, CPU load).
5.2 Monitoring and Analysis Runtime Framework The generated monitors plug into the MDE toolkit’s runtime framework. The main elements of the runtime framework are shown in Figure 4. The runtime framework supports deployment of monitors to thousands of nodes, and provides services for
Exploiting architectures styles in the metamodel makes our modeling toolkit “architecture aware”, as knowledge of the architectural style is used to identify the role of runtime component in the system [23]. We are utilizing the Acme
20
monitoring, but sufficiently specific and constrained to enable generation of monitors and visualizations.
measurement collection from monitors, sampling and compression (as needed), measurement storage and archiving, and the visualization dashboard.
Next, the measures collected by the generated monitors will likely require sampling and compression. Resource utilization (CPU and network) for the monitors on each node must be minimized (typically less than 1%), and so time-series compression or other approaches will be needed. For some types of metrics, an approach may include local storage of fine-grained measurements at each node or cluster, along with distributed filtering so that only exceptions or deviations are intelligently reported up to the runtime framework. An essential challenge is that we would like precise and fine-grained measurements when the system is at peak load and resources are already stretched thin. Tradeoffs between push and pull of measurement data, variable sampling frequencies, and aggregation/compression approaches will be explored.
Nodes with deployed Monitors
(Optional) Sampling and Compression
Collection Collection Collection
Storage
(Petabytes)
Visualization Dashboard
(1000s of nodes)
Development of the proposed solution also presents a number of significant engineering challenges. The collection and storage components of the solution are themselves a big data system, which must ingest and store data at terabyte- to petabyte-scale.
Figure 4 - Runtime Framework Monitors collect node-level performance metrics. The metamodel identifies the node-level metrics to be collected for a particular architecture style and asset type. Based on the property values specified in the specific system model, appropriate monitors are generated by the MDE Design Time Toolkit. We use the Ganglia framework [14] for node-level monitor insertion and management, and for measurement collection. The generated monitor code extends the Gmond (Ganglia Monitoring Daemon), which is deployed to every node in the big data system.
To address the scale of the data to be monitored, the visualizations will have to use advanced visual metaphors such as clustering, trending, hotspots, and correlations, performed in real time and at scale. The architectural style definitions must also model the relationships between node-level resource measurements and endto-end system-level measures, and the visualizations must allow navigation up and down these relationships.
The architectural style defined in the metamodel identifies architecture-specific performance metrics, and how these toplevel metrics relate to node-level metrics. This knowledge is used by the generator in the MDE Design Time Toolkit to identify opportunities for node-level aggregation of metrics, prior to collection, and to generate extensions for the Ganglia Gmetad daemon to perform architecture-aware measurement aggregation data at the cluster level, with the cluster definition being derived from the architectural styles being used. The number and placement of the generated Gmetad instances is determined by the architectural style and system model properties.
This runtime performance monitoring solution can also be used as the foundation for automation of design time benchmarking and performance characterization tasks. The architecture for the prototype is described using the Design Time Editor, and monitors and visualizations are generated. For benchmarking, an additional component, a test client, is added to the solution, and architectureaware workloads can be generated for execution by the test client. The test client is based on the Yahoo! Cloud Serving Benchmark (YCSB) framework [25], or the YCSB++ extension [26] that supports coordination of multiple client instances for higher performance.
The runtime framework also includes storage for the collected measurements. This storage must scale to support writing millions of records per sampling interval while executing ongoing queries from the visualization dashboard. Here we diverge from the Ganglia framework. While Ganglia uses RRDtool (Round-Robin Database) for measurement storage, our initial solution is based on the Cassandra wide column NoSQL database (cassandra.apache.org), which balances high write performance with query flexibility. Although this NoSQL database does not impose a schema on the data, writers and readers must share a common data model. This data model is architecture-aware, generated from knowledge of the architectural style in the metamodel and from specific property values specified in the system model.
7. CONCLUSION At the scale and dynamic runtime environment of big data systems, design time performance predictions must be followed by runtime performance monitoring. We described the architecture of a proposed toolset for runtime performance monitoring. The toolset leveraging architectural styles to enable generation of architecture-aware monitors and visualizations that execute within a runtime framework for measurement collection, storage, and visualization. Realizing this toolkit presents significant engineering and research challenges, which are the focus of our research.
8. ACKNOWLEDGMENTS Copyright 2014 ACM. This material is based upon work funded and supported by the Department of Defense under Contract No. FA8721-05-C-0003 with Carnegie Mellon University for the operation of the Software Engineering Institute, a federally funded research and development center. References herein to any specific commercial product, process, or service by trade name, trade mark, manufacturer, or otherwise, does not necessarily constitute or imply its endorsement, recommendation, or favoring by Carnegie Mellon University or its Software Engineering
6. FUTURE WORK Creation of this model-driven observability solution poses significant research challenges. The first is the identification and characterization of big data architecture styles. A style definition includes the structure of the style (element types and composition rules), and the allowable property values for the elements. Both must be sufficiently general to be reusable for performance
21
experience,” Parallel Computing, vol. 30, no. 7, pp. 817-840, July 2004, doi: 10.1016/j.parco.2004.04.001.
Institute. This material has been approved for public release and unlimited distribution. DM-0001911.
[15] E. Imamagic and D. Dobrenic, “Grid Infrastructure Monitoring System Based on Nagios,” in Proc. 2007 Workshop on Grid Monitoring (GMW '07), Monterey, California, USA, 2007, pp. 23--28. doi: 10.1145/1272680.1272685.
9. REFERENCES [1] J. Weiner and N. Bronson. Facebook's Top Open Data Problems [Online]. https://research.facebook.com/blog/1522692927972019/face book-s-top-open-data-problems/ (Accessed 10 Nov 2014).
[16] J. Kowall and W. Cappelli, “Magic Quadrant for Application Performance Monitoring.” Gartner, Inc., Technical Report, G00262851, 2014.
[2] M. Finnegan, “Boeing 787s to create half a terabyte of data per flight, says Virgin Atlantic,” Computerworld UK, 6 March 2013, http://www.computerworlduk.com/news/infrastructure/34335 95/boeing-787s-to-create-half-a-terabyte-of-data-per-flightsays-virgin-atlantic/ (Accessed 20 Feb 2014).
[17] K. Ren, J. Lopez, and G. Gibson, “Otus: Resource Attribution in Data-intensive Clusters,” in Proc. Second International Workshop on MapReduce and Its Applications (MapReduce '11), 2011, pp. 1-8. doi: 10.1145/1996092.1996094
[3] P. Groves, B. Kayyali, D. Knott, et al., “The `big data' revolution in healthcare.” McKinsey & Company, Report, 2013, http://www.mckinsey.com/insights/health_systems_and_serv ices/the_big-data_revolution_in_us_health_care (Accessed 20 Feb 2014).
[18] J. Yin, P. Sun, Y. Wen, et al., “Cloud3DView: An Interactive Tool for Cloud Data Center Operations,” in Proc. ACM Conference on SIGCOMM (SIGCOMM '13), Hong Kong, China, 2013, pp. 499--500. doi: 10.1145/2486001.2491704
[4] V. Turner, J. F. Gantz, D. Reinsel, et al., “The Digital Universe of Opportunities: Rich Data and the Increasing Value of the Internet of Things.” International Data Corporation, White Paper, IDC_1672, 2014, http://idcdocserv.com/1678 (Accessed 10 Nov 2014).
[19] E. Garduno, S. P. Kavulya, J. Tan, et al., “Theia: Visual Signatures for Problem Diagnosis in Large Hadoop Clusters,” in Proc. 26th International Conference on Large Installation System Administration: Strategies, Tools, and Techniques (lisa'12), San Diego, CA, 2012, pp. 33--42.
[5] P. J. Sadalage and M. Fowler, NoSQL Distilled. AddisonWesley Professional, 2012.
[20] M. Shaw and D. Garlan, Software Architecture: Perspectives on an Emerging Discipline. Prentice Hall, 1996.
[6] W. Vogels, “Amazon.com: E-Commerce at Interplanetary Scale,” in Proc. O'Reilly Emerging Technology Conf., San Diego, CA, USA, 2005. http://conferences.oreillynet.com/cs/et2005/view/e_sess/5974 (Accessed 7 Nov 2014).
[21] D. Garlan, S.-W. Cheng, A.-C. Huang, et al., “Rainbow: Architecture-Based Self Adaptation with Reusable Infrastructure,” IEEE Computer, vol. 37, no. 10, October 2004, doi: 10.1109/MC.2004.175. [22] Y. He, X. Chen, and G. Lin, “Composition of Monitoring Components for On-demand Construction of Runtime Model Based on Model Synthesis,” in Proc. 5th Asia-Pacific Symposium on Internetware (Internetware '13), Changsha, China, 2013, pp. 20:1--20:4. doi: 10.1145/2532443.2532472
[7] J. Dean and L. A. Barroso, “The Tail at Scale,” Communications of the ACM, vol. 56, no. 2, pp. 74-80, February 2013. doi: 10.1145/2408776.2408794 [8] R. Bias, “Architectures for Open and Scalable Clouds,” in Proc. CloudConnect 2012, Santa Clara, CA, USA, 2012.
[23] J. S. Kim and D. Garlan, “Analyzing architectural styles,” Journal of Systems and Software, vol. 83, pp. 1216–1235, 2010, doi: 10.1016/j.jss.2010.01.049.
[9] BBC News. Instagram, Vine and Netflix hit by Amazon glitch [Online]. http://www.bbc.com/news/technology-23839901 (Accessed 7 Oct 2014).
[24] D. Garlan, R. T. Monroe, and D. Wile, “Acme: Architectural Description of Component-Based Systems”. In G. T. Leavens and M. Sitaraman, (Eds.), Foundations of Component-Based Systems (pp. 47-68). Cambridge University Press, 2000.
[10] B. Wong and C. Kalantzis. A State of Xen - Chaos Monkey & Cassandra [Online]. http://techblog.netflix.com/2014/10/astate-of-xen-chaos-monkey-cassandra.html (Accessed 30 Oct 2014).
[25] B. F. Cooper, A. Silberstein, E. Tam, et al., “Benchmarking Cloud Serving Systems with YCSB,” in Proc. 1st ACM Symp. on Cloud Computing (SoCC '10), 2010, pp. 143-154. doi: 10.1145/1807128.1807152.
[11] M. Nygard, Release it! Design and Deploy Production-ready Software, 1st Edition. Pragmatic Bookshelf, 2007. [12] J. O. Kephart and D. M. Chess, “The vision of autonomic computing,” Computer, vol. 36, no. 1, pp. 41-50, January 2003, doi: 10.1109/MC.2003.1160055.
[26] S. Patil, M. Polte, K. Ren, et al., “YCSB++: Benchmarking and Performance Debugging Advanced Features in Scalable Table Stores,” in Proc. 2nd ACM Symp. on Cloud Computing (SOCC '11), 2011, pp. 9:1--9:14. doi: 10.1145/2038916.2038925.
[13] C. Watson. Observability at Twitter [Online]. https://blog.twitter.com/2013/observability-at-twitter (Accessed 10 Nov 2014). [14] M. L. Massie, B. N. Chun, and D. E. Culler, “The ganglia distributed monitoring system: design, implementation, and
22