Animal Learning & Behavior 2002, 30 (4), 306–314
The pigeon’s discrimination of visual entropy: A logarithmic function MICHAEL E. YOUNG Southern Illinois University, Carbondale, Illinois and EDWARD A. WASSERMAN University of Iowa, Iowa City, Iowa We taught 8 pigeons to discriminate 16-icon arrays that differed in their visual variability or “entropy” to see whether the relationship between entropy and discriminative behavior is linear (in which equivalent differences in entropy should produce equivalent changes in behavior) or logarithmic (in which higher entropy values should be less discriminable from one another than lower entropy values). Pigeons received a go/no-go task in which the lower entropy arrays were reinforced for one group and the higher entropy arrays were reinforced for a second group. The superior discrimination of the second group was predicted by a theoretical analysis in which excitatory and inhibitory stimulus generalization gradients fall along a logarithmic, but not a linear scale. Reanalysis of previously published data also yielded results consistent with a logarithmic relationship between entropy and discriminative behavior.
The pigeon is a most perceptive and versatile creature. This “bird-brain” has proven to be an excellent messenger (the “homing” pigeon), a competent gunner (Capshew, 1993; Skinner, 1960), an adept recognizer of individual human beings (Herrnstein, Loveland, & Cable, 1976) and their facial expressions (Wasserman, Tassinary, Bhatt, & Sayasenh, 1989), as well as a capable classifier of art styles (Watanabe, Sakamoto, & Wakita, 1995). Recent research (Wasserman, 1995) has sought to determine whether the pigeon is also able to learn abstract conceptual discriminations and, if it is, then to uncover the mechanisms that underlie those discriminations. Although the differences between human and avian intelligencemay turn out to be substantial (cf. Macphail, 1996), our own investigations and those of others (e.g., Cook, Katz, & Cavoto, 1997) encourage the view that many abilities believed to be solely within the ken of humans also extend to other species (Delius, 1994; Thompson & Oden, 2000). Recent research in our laboratory has disclosed that pigeons are sensitive to differences in variability among arrays of numerous simultaneously presented visual items, such as those shown in Figure 1 (Wasserman, Hugart, & Kirkpatrick-Steger, 1995; Young & Wasserman, 1997; Young, Wasserman, & Garner, 1997), as well as to variability differences in a sequence of successively presented single visual items (Young, Wasserman, & Dalrymple, This research was supported by Research Grant IBN 99-04569 from the National Science Foundation. We thank Grisselle Betancourt and Shujing Shu for their assistance in conducting this research. Correspondence about this article should be addressed to M. E. Young, Department of Psychology, Mailcode 6502, Southern Illinois University, Carbondale, IL 62901-6502 (e-mail:
[email protected]).
Copyright 2002 Psychonomic Society, Inc.
1997; Young, Wasserman, Hilfers, & Dalrymple, 1999). This discovery has forced us to reassess the view that a same–different discrimination is qualitativein nature. Perhaps the pigeon discriminates different degrees of variability in a set of items in much the same way as it discriminates different degrees in the tilt of a line or different degrees of brightness in a stimulus. Although the idea is unconventional, we believe that a computationaldimension of variability is a possibility that is well worth exploring. If such a notion proves to have merit, then it might help us to understand the possible adaptive advantages of variability discrimination. Perhaps detecting the homogeneity or heterogeneity in their food supply, their predators, or their flock provides pigeons with some real survival benefit. Or perhaps variability detection is simply an incidental outgrowth of other cognitive and perceptual skills. More important, however, is the fact that variability and other abstractions such as number and oddity represent concepts that are not readily reducible to a basic perceptual property of the stimulus itself (e.g., Cook, Katz, & Cavoto, 1997; Emmerton, Lohmann, & Niemann, 1997; Thompson & Oden, 2000; Wasserman, Fagot, & Young, 2001; Young & Wasserman, 2001b). An organism can judge the variability of a collection and the number of items in that collection regardless of the items that constitute the collection. It is the relationship between the items that is important in judging variability, whether they are all the same, all different, or something intermediate. Of further interest is the fact that our research has disclosed that the pigeon’s discrimination of variability very closely accords with the entropy in the simultaneouslypresented array or the successively presented list of visual
306
ENTROPY ASYMMETRY
307
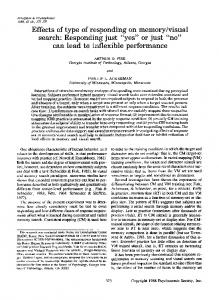
Figure 1. Examples of the 16-icon displays used in the present study. For each display, the icons were chosen from a set of 24, with these icons randomly located in a 5 3 5 grid. See the text for a complete explanation of the creation and function of the various stimulus displays.
items (Young, Wasserman, & Dalrymple, 1997; Young et al., 1999). Entropy is a precise mathematical measure of categorical variability that was proposed by Shannon and Weaver (1949): H ( A) = - å pa log2 pa ,
(1)
a ÎA
where H(A) is the entropy of categorical variable A, a is a category of A, and pa is the proportion of observed values within that category. When a display has 16 identicalicons, the entropy is 0.0; when it has 16 different icons, it has an entropy of 4.0 (see Figure 1 for representative displays). Displays with intermediate degrees of variability have intermediate levels of entropy (see Young & Wasserman, 2001c, for a Web-based calculator that computes entropy). Heretofore, the pigeon’s discrimination of visual variability has closely accorded with its use of entropy as an underlying psychological dimension (although other factors, such as selective attention, may also play a role;
Wasserman, Young, & Nolan, 2000). To illustrate, after pigeons are trained on two disparate entropy values, testing on intermediate entropy values reveals the familiar Sshaped sigmoid, a hallmark of dimensional stimulus control in psychophysics (e.g., Blough, 1996). But we do not know whether equivalent distances along the entropy scale correspond to equivalent distances along the psychological scale, thereby representing a linear relationship between entropy and discriminative behavior (see the top of Figure 2). Given the propensity for other dimensions to follow Weber’s law (Weber, 1834/1996), it is possible that equivalent entropy differences may be more discriminable at the lower end of the scale (where there is less heterogeneity) and less discriminableat the upper end of the scale (where there is more heterogeneity), thereby representing a logarithmic relationship (see the bottom of Figure 2). In our most recently published study (Young & Wasserman, 2002, Experiment 2), we gave pigeons a special training task that was designed to show whether the rela-
Figure 2. A graphical representation of the spacing between entropy values on a linear scale (top) and a logarithmic scale (bottom).
308
YOUNG AND WASSERMAN
tionship between entropy and discriminability would better conform to a linear or to a logarithmic relationship. Using a two-alternativeforced-choice procedure, we trained pigeons to discriminate either the lowest entropy display (entropy 0.0, a same display) from several others with higher entropy, or the highest entropy display (entropy 4.0, a different display) from several others with lower entropy. If the underlying psychological scale was linear, then these two discrimination tasks should have been equally difficult. But if the underlying psychological scale was logarithmic,then discriminatingan entropy 0.0 display from all others should have been much easier than discriminating an entropy 4.0 display from all others (in the logarithmic scale of Figure 2, the entropy 0.0 display is much farther from its nearest neighbors than the entropy 4.0 display is from its nearest neighbors). The results were clear: Our pigeons found it easier to discriminate uniformity from all levels of diversity. These results are thus consistent with a logarithmic relationship between entropy and discriminative behavior. In the present experiment, we arranged a second test of the psychophysical relationship between entropy and discriminative behavior in a completely different experimental setting. We trained pigeons on a go/no-go discrimination, in which the lower entropy displays (entropy less than 2.0) served as the S1 items and the higher entropy displays (entropy greater than 2.0) served as the S2 items (a golow discrimination) or in which the higher entropy displays (entropy greater than 2.0) served as the S1 items and the lower entropy displays (entropy less than 2.0) served as the S2 items (a go-high discrimination). If the underlying psychological scale was linear, the pigeons’ learning of the two tasks should be equally strong. However, if the underlying psychological scale was logarithmic, the gohigh discrimination should be decidedly easier to learn than the go-low discrimination. The source of the predicted learning differential between these conditions is the difference between the shapes of excitatory and inhibitory stimulus generalization gradients (Rilling, 1977): Excitatory gradients are high and steep, whereas inhibitory gradients are low and shallow.1 When the excitatory gradients are widely spaced, as is the case for the go-low condition (bottom of Figure 2), the excitatory gradients for the S1s will produce moderate generalization to one another (top of Figure 3). In contrast, when the excitatory gradients are close to one another, as is the case for the go-high condition (bottom of Figure 2), the excitatory gradients will produce significant generalization to adjacent values (bottom of Figure 3). This differential in the summation of excitatory gradients should produce differences in the discriminability of the S1s versus S2s for the two conditions. Although the inhibitory gradients would likewise exhibit more generalization when the gradients were close to one another, the already substantial overlap in these gradients in both conditions would necessarily produce relatively small changes in discrimination when their locations were manipulated (as shown in Figure 3).
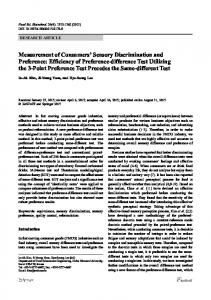
Figure 3 depicts the theoretics for these two discriminations; the excitatory and inhibitory gradients are designated by dashed lines, and the sum of those gradients is designated by the solid line. (Algebraic summation of the gradients is assumed for theoretical purposes. Although we do not claim that this theoretical summation will produce summation of the observed rates of responding, the ordinal predictions still hold.) The difference between the summed gradients (solid line) for the S1 stimuli and for the S2 stimuli is much greater in the go-high condition than it is in the go-low condition. The predicted difference between the discrimination conditions is made even more explicit in Table 1; this table contains the predicted levels of excitation and inhibition at each of the entropy values used in discrimination training. The difference between the average summed excitation and inhibition scores for the S1 stimuli and the average for the S2 stimuli is 54% higher in the go-high condition (4.09) than it is in the go-low condition (2.65). This prediction critically relies on the presence of multiple S1s and S2s in our design. The use of a single S 1 and a single S2 would be predicted to produce equivalent learning regardless of which one involved high entropy displays and which one involved low entropy displays. Therefore, one would anticipate that discrimination performance in these two training conditions would be identical if the underlying psychological scale was linear, but that the two training conditions would differ in a specific direction—go-high should be easier than go-low—if the scale was logarithmic. METHOD Subjects The subjects were 8 feral pigeons (Columba livia) maintained at 85% of their free-feeding weights by controlled daily feeding. The pigeons had earlier served in unrelated studies involving different visual stimuli in the same boxes. Just prior to the present project, we taught the birds to peck at the central and peripheral areas of the touch screen on an FR 30 schedule. Apparatus The experiment used four specially constructed chambers. One plywood wall of each chamber contained a large opening with an aluminum frame attached to the outside of the box. The frame held a clear touch screen (DuraTouch Model 70056-001, Elmwood Sensors, Pawtucket, RI); pecks on the touch screen were processed by a serial controller board (Model E271-2200, Elographics, Oak Ridge, TN). A brushed aluminum panel was placed directly in front of the touch screen in order to allow the pigeons access to circumscribed portions of a video monitor (13-in. AppleColor high-resolution RGB) that was located 0.9 cm behind the touch screen at its center and 1.1 cm at the outer edges (the difference being due to the slight convex curvature of the face of the monitor). There were five openings in the panel: a 7 3 7 cm square central “display” area in which the icon arrays appeared and four round “report” areas (1.9-cm diameter) located 2.3 cm from each of the four corners of the central opening. Only the central display area was used in the present study. A clear Plexiglas food cup was centered on the rear wall of the chamber to discourage the pigeons from perching on the food cup; it was recessed into the wire mesh floor so that the top of the cup was level with the floor. A pellet dispenser delivered 45-mg Noyes pigeon pel-
ENTROPY ASYMMETRY
309
Figure 3. Theoretical excitatory and inhibitory gradients (dashed lines) and the sum of those gradients (solid line) for the go-low (top) and go-high (bottom) conditions. Each of the generalization gradients was generated by a Gaussian (normal) function; the excitatory and inhibitory gradients were produced by using a sigma ( s) of .33 and 1.0, respectively. The x-axis depicts log(entropy + 1.0); we added 1.0 to entropy to avoid taking the undefined logarithm of an entropy of 0.0.
310
YOUNG AND WASSERMAN
Table 1 Predicted Excitatory (Positive) and Inhibitory (Negative) Values at Each of the Trained Entropy Values in the Two Experimental Conditions Condition Entropy 0.0 0.5 1.0 1.5 2.5 3.0 3.5 4.0 Mean for entropy less than 2.0 Mean for entropy greater than 2.0
Go Low
Go High
1.36 2.03 1.91 1.17 20.49 20.98 21.26 21.39 1.62 21.03
21.34 21.43 20.96 20.15 2.70 3.31 3.39 3.09 20.97 3.12
S1 trial arranged food on a fixed interval 15 sec (FI 15 sec) schedule; the first peck that occurred after the 15-sec presentation of a stimulus array delivered one or two pellets of food (the exact number varied as a function of the amount that was needed to maintain the pigeon at its 85% weight) and terminated the stimulus display. The stimulus display on an S2 trial terminated after 15 sec, irrespective of the bird’s behavior. Only the pecks that occurred during the first 15 sec of an S1 or an S2 trial were used to assess discriminative performance. Intertrial intervals averaged 8 sec (range: 6– 10 sec). Training was divided into 5-day blocks (days on which a bird occasionally failed to finish all 168 trials were not included in this count or subsequent analyses). All of the birds were pecking more to the S1 stimuli than to the S2 stimuli by Block 9 (as determined by individual statistically significant t tests for all 8 birds). After reaching this criterion, the birds were trained for an additional 20 days; we used this 20-day period for subsequent statistical analyses.
RESULTS lets through a vinyl tube into the food cup. A houselight, mounted on the upper rear wall of the chamber, provided illumination during experimental sessions. The houselight and pellet dispenser were controlled by a digital I/O interface board (Model NB-DIO-24, National Instruments, Austin, TX). Control of the peripheral stimuli (via the I/O interface card) and recording of the birds’ pecks (via the serial controller board) were accomplished by four Apple Macintosh 7100 computers. A video splitter connected each computer to the pigeon’s monitor and to an identical monitor located in an adjacent room. Programs driving the presentation of video stimuli and controlling the chamber houselight and feeder were developed in HyperCard (Version 2.3). Visual Stimuli and Experimental Design Twenty-four highly distinguishable Macintosh icons were chosen as the total item pool. The icons were selected from those used in Young, Wasserman, and Dalrymple (1997). The training displays comprised mixtures of icons in order to produce entropies of 0.0, 0.5, 1.0, 1.5, 2.5, 3.0, 3.5, and 4.0. The exact icon distributions that were used to generate these entropies are shown in Table 2. We used three different methods for producing displays with an entropy of 1.0 or 3.0 to verify that the pigeons were responding to entropy rather than to some other measure of visual variability (see later analyses). For any given display, each icon type (designated with a capital letter in Table 2) was randomly chosen without replacement from among the 24-icon set. The 16 selected icons were then randomly distributed over 25 locations arrayed in an invisible 5 3 5 grid. So, 16 of the 25 locations contained icons, and 9 were blank (see Figure 1 for representative displays). Procedure We randomly assigned the 8 pigeons to one of two training conditions: go-high or go-low. Training comprised 168 trials: 7 randomized blocks of 24 trials each. These 24 trials were composed of 3 each of displays with an entropy of 0.0, 0.5, 1.0, 1.5, 2.5, 3.0, 3.5, or 4.0 (each of the three entropy 1.0 and entropy 3.0 displays was generated using the three methods that are described in Table 2, whereas each of the other displays was generated using a single method). Birds assigned to the go-high condition (17B, 64Y, 76W, and 77R) were reinforced for pecks to the entropy 2.5, 3.0, 3.5, or 4.0 displays (the S1 stimuli), but not to the entropy 0.0, 0.5, 1.0, 1.5 displays (the S2 stimuli), whereas those assigned to the go-low condition (23B, 49B, 92Y, and 100B) were reinforced for pecks to the 0.0, 0.5, 1.0, and 1.5 entropy displays (the S1 stimuli), but not to the entropy 2.5, 3.0, 3.5, or 4.0 displays (the S2 stimuli). Each trial began by lighting the display area with a white field containing a black cross in the center. A single peck anywhere in the display area turned on the icon array as a black-on-white picture. An
The go-high pigeons reached the t test discrimination criterion by Blocks 3, 2, 2, and 3 for Birds 17B, 64Y, 76W, and 77R, respectively. The go-low pigeons reached the t test discrimination criterion by Blocks 2, 8, 9, and 6 for Birds 23B, 49B, 92Y, and 100B, respectively.2 As revealed by the speed at which each pigeon reached criterion, the gohigh condition produced generally faster learning than did the go-low condition—a marked asymmetry in discrimination performance. Subsequent performance on the final 20 days of training revealed the source of this asymmetry. Discriminative performance during the final 20 days of training is shown in Figure 4. The x-axis is labeled according to the number of 0.5-entropy steps that each S1 and S2 was from the middle entropy score (2.0). Good discriminative responding by either group should have produced high rates to the S1 stimuli and low rates to the S2 stimuli. If we ignore possible peak shift effects, then to the degree that responding is a function of entropy, peck rates should generally be ordered from S14 (highest peck rate for the S1 that is farthest from the boundary between the S1 and S2 categories) to S24 (lowest peck rate for the S2 that is farthest from the boundary between the S1 and S2 categories). As can be seen in Figure 4, the pigeons in the go-high condition showed high peck rates to the S1 stimuli (those with entropies greater than 2.0) with very little difference among the four S 1s; these pigeons showed much lower Table 2 The Mixture Displays and Their Entropy Scores Icon Distribution
Entropy
16A 14A2B 8A8B 12A3B1C 13A1B1C1D 11A1B1C1D1E1F 8A1B1C1D1E1F1G1H1I 2A2B2C2D2E2F2G2H 5A3B1C1D1E1F1G1H1I1J 6A1B1C1D1E1F1G1H1I1J1K 4A1B1C1D1E1F1G1H1I1J1K1L1M 1A1B1C1D1E1F1G1H1I1J1K1L1M1N1O1P
0.0 0.5 1.0 1.0 1.0 1.5 2.5 3.0 3.0 3.0 3.5 4.0
ENTROPY ASYMMETRY
311
Figure 4. Mean peck rate in each condition as a function of the number of 0.5 entropy steps from the middle 2.0 entropy value (not given to pigeons in either condition). The figure shows the means and standard errors of the data averaged across all 4 pigeons in each condition.
peck rates to the S2 stimuli, and the rates were systematically ordered as a function of entropy. The pigeons in the go-low condition showed high peck rates to the S1 stimuli (those with entropies greater than 2.0) with very little difference among the four S 1s; in contrast to the go-high condition, however, these pigeons’ response rates to the S2 stimuli were very similar and not much lower than those to the S1 stimuli. A repeated measures analysis of variance (ANOVA) of peck rate as a function of condition (go-high vs. go-low) and stimulus (S14 through S24) confirmed this description. This analysis revealed no main effect of condition [F(1,6) 5 1.76, MSe 5 20.7763, p . .10], a significant main effect of stimulus [F(7,42) 5 41.80, MSe 5 .2288, p , .0001], and, most importantly, a significant condition 3 stimulus interaction [F(7,42) 5 18.43, MSe 5 .2288, p , .0001]. Planned contrasts (a 5 .05) showed that the S1 stimuli produced higher peck rates than did the S2 stimuli in both conditions [t(42) 5 16.33, p , .0001 for gohigh, and t(42) 5 3.75, p , .001 for go-low], with a larger disparity in the go-high condition (0.56 pecks/sec) than in the go-low condition (0.13 pecks/sec). As a manipulation check, we examined peck rates for the three different methods of producing the entropy 1.0 stimuli and the entropy 3.0 stimuli. Repeated measures ANOVAs of the entropy 1.0 stimuli 3 condition interaction and the entropy 3.0 stimuli 3 condition interaction revealed no statistically significant effects (all Fs , 1). DISCUSSIO N Our aim in this study was to see whether equivalent differences along the entropy dimension would produce
equivalent changes in discriminative behavior or whether pigeons would find lower entropy values to be more discriminable from one another than higher entropy values. The present experiment and Experiment 2 of Young and Wasserman (2002) yielded clear evidence that is consistent with a logarithmic relationship between entropy and discriminability. In Experiment 2 of Young and Wasserman (2002), the logarithmic relationship was revealed by the greater ease with which pigeons discriminated an entropy 0.0 display from displays of higher entropy in comparison with the greater difficulty with which pigeons discriminated an entropy 4.0 display from displays of lower entropy. In the present experiment, the logarithmic relationship was revealed by pigeons’ faster acquisition of a go/no-go discrimination in which the S1 stimuli were high-entropy displays and the S2 stimuli were low-entropy displays in comparison with the slower acquisition of a discrimination in which the S1 stimuli were low-entropy displays and the S2 stimuli were high-entropy displays. Our application of generalization theory to values along a logarithmically spaced entropy scale (Figure 3) predicted this result. Although we have assumed that the relationship between entropy and discriminative behavior is logarithmic, other functional relationships will fit our data as well. All of these functions, however, must share one property: Values at the lower end of the scale must be more discriminable from one another than values at the higher end of the scale. This family of functions includes the logarithmic, the square root, and the reciprocal, but it excludes the linear, the square, and the exponential as well as a host of other functions. Our preference for the logarithmic over other functions with similar properties is rooted in the oft-
312
YOUNG AND WASSERMAN
observed logarithmic relation in other psychophysical dimensions (Weber, 1834/1996). A precise determination of the best mathematical descriptor of the relationship between entropy and the psychological assessment of variability awaits further study. Evidence of a Logarithmic Relationship in Earlier Studies Although our earlier work on same–different discrimination learning with pigeons suggested symmetry around the midpoint of the entropy scale (representing evidence of a linear relationship), our more recent work with humans (Young & Wasserman, 2001a) suggested a psychological midpoint that is shifted toward the lower end of the entropy scale (representing evidence of a logarithmic relationship3). To identify the psychologicalmidpoint in our human study, we fit a sigmoid (logistic) function to these data. This nonlinear fitting technique included two free parameters: gradient (corresponding to the steepness of the slope of the sigmoid function) and boundary (corresponding to the point of maximal inflection—i.e., the psychological midpoint). Using nonlinear regression (specifically, the Gauss–Newton iterative procedure), we fit the data using the following equation: 1
. (2) 1+ e The natural psychologicalmidpoint after training with entropies of 0.0 (all same items) and 4.0 (all different items) was about 0.6 for the majority (80%) of people, strongly shifted downward from the natural 2.0 midpoint of the entropy scale. Although visual examination of our earlier pigeon research suggested symmetry about the 2.0 midpoint, a reanalysis of the data from those first experiments (Young & Wasserman, 1997, Experiments 2, 3, and 4) reveals a measurable asymmetry (a midpoint of 1.73) that is shifted toward the presumably easier-to-discriminate lower entropy values. This observed midpointwas reliably lower than the 2.0 midpoint as disclosed by the regression’s 95% confidence interval for the boundary parameter (1.58– 1.89). - gradient × ( Entropy + boundary)
As is shown in Table 3, the precise location of the psychological midpoint depends on the additive factor that is used in the logarithmic transformation of the entropy scale [because log10(0.0) is negative infinity and one of our displays involves an entropy of 0.0, some degree of parameterization was necessary]. Column 1 shows the untransformed entropy scores; the midpoint of this scale is 2.0, halfway between the two endpoint values of 0.0 and 4.0. Column 2 shows a logarithmictransformation of the entropy scale in which 0.13 was added to each entropy score before applying the logarithmic transform. The midpoint of this transformed scale, 20.13, corresponds to an untransformed entropy score of 0.60. We chose 0.13 as the additive factor precisely because it produced a psychological midpoint consistent with that observed in our earlier human study (Young & Wasserman, 2001a). Column 3 shows a logarithmic transformation of the entropy scale in which 5.00 was added to each entropyscore before applyingthe logarithmic transform. The midpoint of this transformed scale, 0.83, corresponds to an untransformed entropy score of 1.71. We chose 5.00 as the additive factor because it produced a psychological midpoint consistent with that observed in our earlier pigeon study (Young & Wasserman, 1997). Table 3 thus shows that logarithmic transformations will produce mathematical midpoints on this new scale that correspond to entropy values below 2.0. Differences in the psychological midpoint across species or individuals may very well be observed; but a logarithmic relationship always predicts a midpoint that falls below 2.0. A logarithmic relationship between entropy and discriminative behavior should never produce a midpoint above 2.0 except due to measurement error. So, evidence of a logarithmic relationship between entropy and discriminative behavior has actually been present from the outset of our research program. This relationship was obvious in the behavior of our human participants, but it was subtler in the behavior of our pigeons that were trained with analogous methods. Our two most recent studies were specifically designed to discriminate between linear and logarithmic relationships; each yielded even stronger evidence of a logarithmic relationship.
Table 3 Mathematical Parameterization of Logarithmic Relationships Producing Different Psychological Midpoints Entropy
Log(Entropy 1 0.13)
Log(Entropy 1 5.00)
20.89 20.20 0.05 0.21 0.33 0.42 0.49 0.56 0.62 20.13 0.60
0.70 0.74 0.78 0.81 0.84 0.87 0.90 0.93 0.95 0.83 1.71
0.00 0.50 1.00 1.50 2.00 2.50 3.00 3.50 4.00 Midpoint of scale 2.00 Midpoint on entropy scale 2.00 Note—See text for complete explanation.
ENTROPY ASYMMETRY Possible Sources of the Asymmetry There is no a priori reason why the pigeon’s brain should be equivalentlysensitive to differences along the entire entropy dimension. Many examples exist of logarithmic relationships that are analogous to those reported here. The ubiquity of these phenomena gave rise to Weber’s wellknown law and its many variants (Fechner, 1860/1966; Stevens, 1957;Weber, 1834/1996). Just as people more readily detect a difference between 1 and 2 pounds than between 51 and 52 pounds, a pigeon more readily detects a difference between entropy 0.0 and entropy 0.5 than between entropy 3.5 and entropy 4.0. As one moves up the entropy scale, equivalent entropy differences map onto smaller and smaller psychological differences. Nevertheless, the mere observation of a relationship that conforms to Weber’s law does not constitute an explanation, but merely a description of the data; the relationship could arise from any number of possible perceptual or cognitive mechanisms. For example, the ease with which the uniform, entropy 0.0 display was discriminated from the entropy 0.5 display may be produced by “pop-out” effects (e.g., Cook, Cavoto, Katz, & Cavoto, 1997; Cook,Katz, & Cavoto, 1997; Müller, Heller, & Ziegler, 1995; Nothdurft, 1991; Treisman & Gelade, 1980). Pop-out occurs when a target stimulus is placed among other stimuli that are very similar to one another but are different from the target stimulus. So a red stimulus pops out against a background of blue stimuli, and a vertical line pops out against a background of horizontal lines. To the human eye, pop-out is observed when a small number of uniquely shaped icons is shown against a background of otherwise identical icons, as is the case in our entropy 0.5 displays (in which 2 icons of one kind are interspersed with 14 icons of another kind). Although pop-out might explain the distinctiveness of the entropy 0.5 display, it does not clearly explain the better discriminability among the other lower entropy displays than among the higher entropy displays (shown in Figure 4). Theories that attempt to explain pop-out (e.g., those of Treisman & Gelade, 1980; Wolfe, 1994) have not been applied to variability discrimination,and there are a number of degrees of freedom in specifying an appropriate mapping between these theories of visual search and the domain of variability discrimination.It is possible that an extension of these models might provide a mechanism for the computation of visual variabilityin a collectionof simultaneouslypresented objects, but their applicabilityto list variability with individually presented items is far more tenuous (Young, Wasserman, & Dalrymple, 1997; Young et al., 1999). In humans, the definition of sameness appears to be narrower than the definition of differentness (Young & Wasserman, 2001a, 2002). Our present analysis suggests that this asymmetry may be a function of a fundamental process that might differ in degree, but not in kind across individuals or species (e.g., the two different additive factors used in Table 3). Language learning may amplify this basic asymmetry by reserving the word same for homogeneous collections of items; the word different would thus denote any and all heterogeneous collections of items.
313
Dimensional Stimulus Control The pigeons’ same–different discrimination is quite notable, and it speaks both to our birds’ sensitivity to the degree of variability in complex visual displays and to the utility of information-theoreticconcepts in the field of experimental psychology. Our original quest to understand the pigeons’ discriminative performance on the 16-icon same–different procedure has led us to reevaluate the very nature of this task. Using larger numbers of items does appear to make the task more obvious to the pigeon, but in a manner that was wholly unexpected.Pigeons, and perhaps other species like baboons (Wasserman et al., 2001), may be translating the human concept of same–different into minimal versus maximal entropy. In contrast with a dichotomous same–different concept (Delius, 1994), entropy operationalizessame versus different visual displays as lying on the ends of a spectrum of stimulus variability. It may seem peculiar to treat an apparently qualitative concept such as same–different as if it were a quantitative one. But this is not the first time that an abstract concept has been shown to have a dimensional, and not merely a categorical, character. Most people believe that two objects or events are causally related or that they are not—a categorical distinction. But causal attribution is especially sensitive to degrees of temporal contiguity, spatial contiguity, and contingency, in both humans’ and pigeons’ behavioral reports (Killeen, 1981; Wasserman, 1990; Young, 1995). Symmetry– asymmetry is another example of a categorical distinction that may be better represented dimensionally. Humans have, in fact, been shown to be sensitive to degrees of symmetry and asymmetry (Wagemans, 1995). That each of these three dimensions—variability, causality, and symmetry—is abstract is suggested by their independence from the specific items being classified: Any two or more items can be the same as or different from one another; two objects or events are causally related if the occurrence of one is specially related to the occurrence of the other; and any group of three or more items can be presented in a symmetrical or an asymmetrical array. Our most recent results suggest that the mechanisms underlying the pigeon’s discrimination of visual variability may have a great deal in common with those underlying the discrimination of more familiar psychophysicaldimensions. The apparently qualitative difference between human and pigeon behavior on this task (cf. Young & Wasserman, 1997, 2001a, 2002) may instead be a quantitative difference. Whatever we ultimately identify as the underlying mechanism that gives rise to a logarithmic relationship between entropy and discriminative behavior, it is clear that an analogousmechanism is active across a wide range of species. REFERENCES Blough, D. S. (1996). Error factors in pigeon discrimination and delayed matching. Journal of Experimental Psychology: Animal Behavior Processes, 22, 118-131. Capshew, J. H. (1993). Engineering behavior: Project Pigeon, World
314
YOUNG AND WASSERMAN
War II, and the conditioning of B. F. Skinner. Technology & Culture, 34, 835-857. Cook, R. G., Cavoto, B. R., Katz, J. S., & Cavoto, K. K. (1997). Pigeon perception and discrimination of rapidly changing texture stimuli. Journal of Experimental Psychology: Animal Behavior Processes, 23, 390-400. Cook, R. G., Katz, J. S., & Cavoto, B. R. (1997). Pigeon same– different concept learning with multiple stimulus classes. Journal of Experimental Psychology: Animal Behavior Processes, 23, 417433. Delius, J. D. (1994). Comparative cognition of identity. In P. Bertelson, P. Eelen, & G. d’Ydewalle (Eds.), International perspectives on psychological science (Vol. 1, pp. 25-40). Hillsdale, NJ: Erlbaum. Emmerton, J., Lohmann, A., & Niemann, J. (1997). Pigeons’ serial ordering of numerosity with visual arrays. Animal Learning & Behavior, 25, 234-244. Fechner, G. T. (1966). Elements of psychophysics (Vol. 1) (H. E. Adler, Trans.). New York: Holt, Rinehart & Winston. (Original work published 1860) Herrnstein, R. J., Loveland, D. H., & Cable, C. (1976). Natural concepts in pigeons. Journal of Experimental Psychology: Animal Behavior Processes, 2, 285-302. Jenkins, H. M. (1965). Generalization gradients and the concept of inhibition. In D. I. Mostofsky (Ed.), Stimulus generalization (pp. 55-61). Stanford, CA: Stanford University Press. Killeen, P. R. (1981). Learning as causal inference. In M. L. Commons & J. L. Nevin (Eds.), Quantitative analyses of behavior: Vol. 1. Discriminative properties of reinforcement schedules (pp. 89-112). Cambridge, MA: Ballinger. Macphail, E. M. (1996). Cognitive function in mammals: The evolutionary perspective. Cognitive Brain Research, 3, 279-290. Müller, H. J., Heller, D., & Ziegler, J. (1995). Visual search for singleton feature targets within and across feature dimensions. Perception & Psychophysics, 57, 1-17. Nothdurft, H.-C. (1991). Texture segmentation and pop-out from orientation contrast. Vision Research, 31, 1073-1078. Rilling, M. (1977). Stimulus control and inhibitory processes. In W. K. Honig & J. E. R. Staddon (Eds.), Handbook of operant behavior (pp. 432-480). Englewood Cliffs, NJ: Prentice-Hall. Shannon, C. E., & Weaver, W. (1949). The mathematical theory of communication. Urbana: University of Illinois Press. Skinner, B. F. (1960). Pigeons in a pelican. American Psychologist, 15, 28-37. Stevens, S. S. (1957). On the psychophysical law. Psychological Review, 64, 153-181. Thompson, R. K. R., & Oden, D. L. (2000). Categorical perception and conceptual judgments by nonhuman primates: The paleological monkey and the analogical ape. Cognitive Science, 24, 363-396. Treisman, A. M., & Gelade, G. (1980). A feature-integration theory of attention. Cognitive Psychology, 12, 97-136. Wagemans, J. (1995). Detection of visual symmetries. Spatial Vision, 9, 9-32. Wasserman, E. A. (1990). Detecting response–outcome relations: Toward an understanding of the causal structure of the environment. In G. H. Bower (Ed.), The psychology of learning and motivation (Vol. 26, pp. 27-82). San Diego: Academic Press. Wasserman, E. A. (1995). The conceptual abilities of pigeons. American Scientist, 83, 246-255. Wasserman, E. A., Fagot, J., & Young, M. E. (2001). Same–different conceptualization by baboons (Papio papio). Journal of Comparative Psychology, 115, 42-52. Wasserman, E. A., Hugart, J. A., & Kirkpatrick-Steger,K. (1995). Pigeons show same–different conceptualization after training with complex visual stimuli. Journal of Experimental Psychology: Animal Behavior Processes, 21, 248-252. Wasserman, E. A., Tassinary, L. G., Bhatt, R. S., & Sayasenh, P. (1989, November). Pigeons discriminate emotion and identity from
photographs of the human face. Paper presented at the annual meeting of the Psychonomic Society, Atlanta. Wasserman, E. A., Young, M. E., & Nolan, B. C. (2000). Display variability and spatial organization as contributors to the pigeon’s discrimination of complex visual stimuli. Journal of Experimental Psychology: Animal Behavior Processes, 26, 133-143. Watanabe, S., Sakamoto, J., & Wakita, M. (1995). Pigeons’ discrimination of paintings by Monet and Picasso. Journal of the Experimental Analysis of Behavior, 63, 165-174. Weber, E. H. (1996). E. H. Weber on the tactile senses (H. E. Ross & D. J. Murray, Trans.). Hove, U.K.: Erlbaum. (Original work published 1834) Wolfe, J. M. (1994). Guided Search 2.0: A revised model of visual search. Psychonomic Bulletin & Review, 1, 202-238. Young, M. E. (1995). On the origin of personal causal knowledge. Psychonomic Bulletin & Review, 2, 83-104. Young, M. E., & Wasserman, E. A. (1997). Entropy detection by pigeons: Response to mixed visual displays after same–different discrimination training. Journal of Experimental Psychology: Animal Behavior Processes, 23, 157-170. Young, M. E., & Wasserman, E. A. (2001a). Entropy and variability discrimination. Journal of Experimental Psychology: Learning, Memory, & Cognition, 27, 278-293. Young, M. E., & Wasserman, E. A. (2001b). Evidence for a conceptual account of same–different discrimination learning in the pigeon. Psychonomic Bulletin & Review, 8, 677-684. Young, M. E., & Wasserman, E. A. (2001c). Stimulus control in complex arrays. In R. Cook (Ed.), Avian visual cognition [On line]. Available: http://www.pigeon.psy.tufts.edu/avc. Young, M. E., & Wasserman, E. A. (2002). Detecting variety: What’s so special about sameness? Journal of Experimental Psychology: General, 131, 131-143. Young, M. E., Wasserman,E. A., & Dalrymple,R. M. (1997).Memorybased same–different conceptualization by pigeons. Psychonomic Bulletin & Review, 4, 552-558. Young, M. E., Wasserman, E. A., & Garner, K. L. (1997). Effects of number of items on the pigeon’s discrimination of same from different visual displays. Journal of Experimental Psychology: Animal Behavior Processes, 23, 491-501. Young, M. E., Wasserman, E. A., Hilfers, M. A., & Dalrymple, R. M. (1999). An examination of the pigeon’s variability discrimination using lists of successively presented stimuli. Journal of Experimental Psychology: Animal Behavior Processes, 25, 475-490. NOTES 1. Note, however, that the source of these differential gradients may be due to the method of measurement (response rate; see Jenkins, 1965). Be that as it may, our theoretical treatment simply requires differential gradients without reference to the source of those differences. 2. One of the pigeons (92Y) failed to show learning by Day 28; this pigeon was subsequently moved to an FI 20 sec schedule for 14 days. Although this more punishing FI produced discernible learning, the bird began failing to finish sessions (it finished on only 5 of the 14 days), thus prompting a return to the FI 15 sec schedule. The learning that was evidenced on the FI 20 sec schedule was maintained after the return to the FI 15 sec schedule. 3. In Figure 2, a vertical line drawn through the middle of the figure would intersect at Entropy 2.0 for the linear scale, but at about Entropy 1.0 for the logarithmic scale. Thus, a logarithmic relationship between entropy and psychological behavior should produce a psychological midpoint below 2.0. The precise location of the midpoint, however, depends on the parameterization of the logarithmic relationship (see Table 3). (Manuscript received January 10, 2002; revision accepted for publication June 18, 2002.)