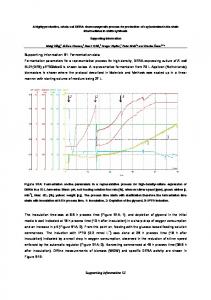
Corresponding time series plots are shown below, with significant linear fits indicated by a solid line. Sample sizes: spring (n = 47); fall (n = 54). Spring. Fall.
S1 Supporting Information. Stock Summaries
Table of Contents
Atlantic Cod (Georges Bank) ................................................................................................................... 2 Atlantic Cod (Gulf of Maine) ..................................................................................................................... 6 Red Hake (Northern) .............................................................................................................................. 10 Red Hake (Southern) ............................................................................................................................. 14 Silver Hake (Northern) ........................................................................................................................... 18 Silver Hake (Southern) ........................................................................................................................... 22 White Hake (Unit) ................................................................................................................................... 26 Yellowtail Flounder (Georges Bank) ...................................................................................................... 30 Yellowtail Flounder (Southern New England-Mid Atlantic) .................................................................... 34
2
Species: Atlantic Cod (Gadus morhua) Stock: Georges Bank
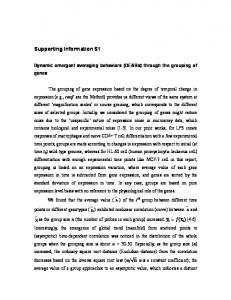
Northeast Fisheries Science Center bottom trawl survey offshore strata on the continental shelf of the Northeast United States. Atlantic cod (Georges Bank) stock strata are shown in blue.
NEFSC surveys used in the most recent assessment: Spring & Fall
Link to most recent benchmark assessment: Northeast Fisheries Science Center. 55th Northeast regional stock assessment workshop (55th SAW) assessment report. US Dept Commer, Northeast Fish Sci Cent Ref Doc. 2013; 13-11. 845 pp. Available from: http://nefsc.noaa.gov/publications/crd/crd1311/. Link to most recent assessment update: Northeast Fisheries Science Center. Operational assessment of 19 Northeast groundfish stocks, updated through 2016. US Dept Commer, Northeast Fish Sci Cent Ref Doc. 2017; 17-17. 259 pp. Available from: http://www.nefsc.noaa.gov/publications/crd/crd1717/.
3
Time-series analysis Estimate, standard error, t-value and p-value for linear regressions of Atlantic cod (Georges Bank) center of gravity (XCG, YCG), inertia, depth and positive area (PA) as a function of year. P-values < 0.05 are in bold. Corresponding time series plots are shown below, with significant linear fits indicated by a solid line. Sample sizes: spring (n = 47); fall (n = 54).
XCG YCG Inertia Depth PA
Estimate 1.00 0.66 -3.34 0.47 -284.19
Spring SE t-value 0.23 4.28 0.14 4.59 27.55 -0.12 0.12 4.02 50.38 -5.64
p-value < 0.001 < 0.001 0.904 < 0.001 < 0.001
Estimate 0.31 0.17 51.47 -0.17 -349.35
Fall SE t-value 0.37 0.85 0.12 1.48 27.95 1.84 0.11 -1.52 32.18 -10.86
p-value 0.399 0.146 0.071 0.134 < 0.001
4
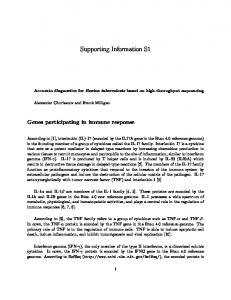
Predictor variables Time-series of predictor variables for Atlantic cod (Georges Bank). Predictors and associated units are: Northeast Fisheries Science Center (NEFSC) bottom trawl survey stratified mean kg per tow (biomass), catch/NEFSC stratified mean kg per tow (relative F) and NEFSC stratified mean bottom temperature (°C). Data for all three predictors were set to NA for years in which there were insufficient bottom temperature recordings to calculate a stratified mean. Sample sizes: spring (n = 37); fall (n = 41).
5
Relative importance of predictors on spatial distribution Relative importance of predictor variables on spatial indicators for Atlantic cod (Georges Bank). Spatial indicators and associated units are: geographically referenced longitude and latitude of the center of gravity (XCG and YCG, respectively; km), inertia (km2), depth (m) and positive area (PA; km2). Predictor variables are: Northeast Fisheries Science Center (NEFSC) bottom trawl survey stratified mean kg per tow (biomass; kg), catch/NEFSC stratified mean kg per tow (relative F) and NEFSC stratified mean bottom temperature (°C). Predictor variables with the highest summed Akaike weights for each indicator are in bold.
Predictor XCG YCG Inertia Depth PA
Biomass 0.57 0.89 0.22 0.99 0.99
Spring Relative F Temperature 0.71 0.88 0.54 1.00 0.91 0.91 0.21 0.34 0.76 0.23
Biomass 0.40 0.44 0.59 0.28 1.00
Fall Relative F 0.67 0.75 0.87 0.29 0.91
Temperature 0.23 0.24 0.26 0.28 0.41
Model-averaged parameter estimates Model-averaged predictor estimates by spatial indicator for Atlantic cod (Georges Bank). Spatial indicators and associated units are: geographically referenced longitude and latitude of the center of gravity (XCG and YCG, respectively; km), inertia (km2), depth (m) and positive area (PA; km2). Predictor variables are: Northeast Fisheries Science Center (NEFSC) bottom trawl survey stratified mean kg per tow (biomass; kg), catch/NEFSC stratified mean kg per tow (relative F) and NEFSC stratified mean bottom temperature (°C).
XCG YCG Inertia Depth PA
Biomass -5.41 -6.28 5.45 -8.05 4656.29
Spring Relative F Temperature -16.07 -9.01 -19.46 -2.77 1591.91 1447.26 -0.18 -0.83 2009.67 -120.85
Biomass -4.27 -1.35 -689.10 0.54 6667.70
Fall Relative F -10.94 -3.85 1380.98 0.68 1219.72
Temperature -0.21 0.15 77.63 0.50 -225.40
6
Species: Atlantic Cod (Gadus morhua) Stock: Gulf of Maine
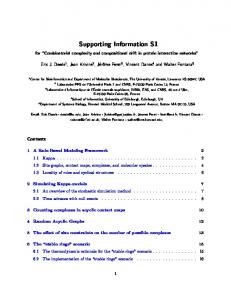
Northeast Fisheries Science Center bottom trawl survey offshore strata on the continental shelf of the Northeast United States. Atlantic cod (Gulf of Maine) stock strata are shown in blue.
NEFSC surveys used in the most recent assessment: Spring & Fall
Link to most recent benchmark assessment: Northeast Fisheries Science Center. 55th Northeast regional stock assessment workshop (55th SAW) assessment report. US Dept Commer, Northeast Fish Sci Cent Ref Doc. 2013; 13-11. 845 pp. Available from: http://nefsc.noaa.gov/publications/crd/crd1311/. Link to most recent assessment update: Northeast Fisheries Science Center. Operational assessment of 19 Northeast groundfish stocks, updated through 2016. US Dept Commer, Northeast Fish Sci Cent Ref Doc. 2017; 17-17. 259 pp. Available from: http://www.nefsc.noaa.gov/publications/crd/crd1717/.
7
Time-series analysis Estimate, standard error, t-value and p-value for linear regressions of Atlantic cod (Gulf of Maine) center of gravity (XCG, YCG), inertia, depth and positive area (PA) as a function of year. P-values < 0.05 are in bold. Corresponding time series plots are shown below, with significant linear fits indicated by a solid line. Sample sizes: spring (n = 48); fall (n = 54).
XCG YCG Inertia Depth PA
Estimate -0.75 -1.11 -39.96 -1.01 -277.70
Spring SE t-value 0.45 -1.67 0.13 -8.33 46.71 -0.86 0.42 -2.43 77.96 -3.56
p-value 0.101 < 0.001 0.397 0.019 < 0.001
Estimate -1.20 -0.46 -44.49 -0.87 -300.80
Fall SE t-value 0.48 -2.50 0.15 -3.02 35.64 -1.25 0.25 -3.54 67.91 -4.43
p-value 0.016 0.004 0.218 < 0.001 < 0.001
8
Predictor variables Time-series of predictor variables for Atlantic cod (Gulf of Maine). Predictors and associated units are: Northeast Fisheries Science Center (NEFSC) bottom trawl survey stratified mean kg per tow (biomass), catch/NEFSC stratified mean kg per tow (relative F) and NEFSC stratified mean bottom temperature (°C). Catch data in the most recent assessment (NEFSC, 2013) begins in 1982, so data for all three predictors were set to NA for years prior. Additionally, data for all three predictors were set to NA for years in which there were insufficient bottom temperature recordings to calculate a stratified mean. Sample sizes: spring (n = 31); fall (n = 29).
9
Relative importance of predictors on spatial distribution Relative importance of predictor variables on spatial indicators for Atlantic cod (Gulf of Maine). Spatial indicators and associated units are: geographically referenced longitude and latitude of the center of gravity (XCG and YCG, respectively; km), inertia (km2), depth (m) and positive area (PA; km2). Predictor variables are: Northeast Fisheries Science Center (NEFSC) bottom trawl survey stratified mean kg per tow (biomass; kg), catch/NEFSC stratified mean kg per tow (relative F) and NEFSC stratified mean bottom temperature (°C). Predictor variables with the highest summed Akaike weights for each indicator are in bold.
XCG YCG Inertia Depth PA
Biomass 0.22 0.32 0.30 0.26 0.52
Spring Relative F Temperature 0.32 0.34 0.20 0.37 0.41 0.44 0.30 0.84 0.24 0.24
Biomass 0.68 0.25 0.31 0.68 0.39
Fall Relative F 0.23 0.49 0.24 0.25 0.30
Temperature 0.21 0.24 0.22 0.26 0.20
Model-averaged parameter estimates Model-averaged predictor estimates by spatial indicator for Atlantic cod (Gulf of Maine). Spatial indicators and associated units are: geographically referenced longitude and latitude of the center of gravity (XCG and YCG, respectively; km), inertia (km2), depth (m) and positive area (PA; km2). Predictor variables are: Northeast Fisheries Science Center (NEFSC) bottom trawl survey stratified mean kg per tow (biomass; kg), catch/NEFSC stratified mean kg per tow (relative F) and NEFSC stratified mean bottom temperature (°C).
XCG YCG Inertia Depth PA
Biomass -0.80 -1.22 -417.07 0.59 1577.41
Spring Relative F Temperature 3.71 -4.29 1.26 -0.05 549.07 -761.45 12.87 -2.44 120.90 274.31
Biomass 15.37 -0.93 355.58 -10.05 785.95
Fall Relative F -1.16 -3.11 -154.02 1.18 361.13
Temperature -1.12 1.22 -172.54 1.96 17.41
10
Species: Red Hake (Urophycis chuss) Stock: Northern
Northeast Fisheries Science Center bottom trawl survey offshore strata on the continental shelf of the Northeast United States. Red hake (northern) stock strata are shown in blue.
NEFSC surveys used in the most recent assessment: Spring only
Link to most recent benchmark assessment: Northeast Fisheries Science Center. 51st Northeast regional stock assessment workshop (51st SAW) assessment report. US Dept Commer, Northeast Fish Sci Cent Ref Doc. 2011; 11-02. 856 pp. Available from: http://www.nefsc.noaa.gov/publications/crd/crd1102/. Link to most recent assessment update: New England Fisheries Management Council. Small-mesh multispecies fishing year 2016-2017 specifications supplemental information report (SIR), and regulatory flexibility analysis (RFA). 2016. 33 pp. Available from: http://s3.amazonaws.com/nefmc.org/2016-2017-Specifications-SupplementalInformation-Report.pdf.
11
Time-series analysis Estimate, standard error, t-value and p-value for linear regressions of red hake (northern) center of gravity (XCG, YCG), inertia, depth and positive area (PA) as a function of year. P-values < 0.05 are in bold. Corresponding time series plots are shown below, with significant linear fits indicated by a solid line. Sample sizes: spring (n = 48); fall (n = 54).
XCG YCG Inertia Depth PA
Estimate 0.81 0.13 9.26 0.34 758.00
Spring SE t-value 0.16 5.18 0.15 0.90 12.72 0.73 0.14 2.50 84.19 9.00
p-value < 0.001 0.375 0.470 0.016 < 0.001
Estimate 0.42 -0.13 -34.64 0.82 833.72
Fall SE t-value 0.15 2.74 0.23 -0.59 18.63 -1.86 0.21 3.91 135.51 6.15
p-value 0.008 0.558 0.069 < 0.001 < 0.001
12
Predictor variables Time-series of predictor variables for red hake (northern). Predictors and associated units are: Northeast Fisheries Science Center (NEFSC) bottom trawl survey stratified mean kg per tow (biomass), catch/NEFSC stratified mean kg per tow (relative F) and NEFSC stratified mean bottom temperature (°C). Data for all three predictors were set to NA for years in which there were insufficient bottom temperature recordings to calculate a stratified mean. Sample sizes: spring (n = 41); fall (n = 46).
13
Relative importance of predictors on spatial distribution Relative importance of predictor variables on spatial indicators for red hake (northern). Spatial indicators and associated units are: geographically referenced longitude and latitude of the center of gravity (XCG and YCG, respectively; km), inertia (km2), depth (m) and positive area (PA; km2). Predictor variables are: Northeast Fisheries Science Center (NEFSC) bottom trawl survey stratified mean kg per tow (biomass; kg), catch/NEFSC stratified mean kg per tow (relative F) and NEFSC stratified mean bottom temperature (°C). Predictor variables with the highest summed Akaike weights for each indicator are in bold.
Predictor XCG YCG Inertia Depth PA
Biomass 0.43 0.32 0.77 0.82 0.33
Spring Relative F Temperature 0.22 0.67 0.22 0.61 0.35 0.22 0.71 0.48 0.97 0.99
Biomass 0.29 0.57 0.25 0.90 0.99
Fall Relative F 0.76 0.35 0.44 0.41 0.72
Temperature 0.76 0.26 0.51 0.37 0.89
Model-averaged parameter estimates Model-averaged predictor estimates by spatial indicator for red hake (northern). Spatial indicators and associated units are: geographically referenced longitude and latitude of the center of gravity (XCG and YCG, respectively; km), inertia (km2), depth (m) and positive area (PA; km2). Predictor variables are: Northeast Fisheries Science Center (NEFSC) bottom trawl survey stratified mean kg per tow (biomass; kg), catch/NEFSC stratified mean kg per tow (relative F) and NEFSC stratified mean bottom temperature (°C).
XCG YCG Inertia Depth PA
Biomass -3.25 -1.24 -440.26 -6.42 699.35
Spring Relative F Temperature -4.36 -0.18 -1.69 -0.05 -42.34 -10.61 -2.89 -2.18 -6813.92 5170.80
Biomass -1.01 8.64 40.03 15.65 10950.10
Fall Relative F -3.74 1.26 137.32 -2.08 -3336.08
Temperature -6.10 -0.90 -304.24 1.45 3620.09
14
Species: Red Hake (Urophycis chuss) Stock: Southern
Northeast Fisheries Science Center bottom trawl survey offshore strata on the continental shelf of the Northeast United States. Red hake (southern) stock strata are shown in blue.
NEFSC surveys used in the most recent assessment: Spring only
Link to most recent benchmark assessment: Northeast Fisheries Science Center. 51st Northeast regional stock assessment workshop (51st SAW) assessment report. US Dept Commer, Northeast Fish Sci Cent Ref Doc. 2011; 11-02. 856 pp. Available from: http://www.nefsc.noaa.gov/publications/crd/crd1102/. Link to most recent assessment update: New England Fisheries Management Council. Small-mesh multispecies fishing year 2016-2017 specifications supplemental information report (SIR), and regulatory flexibility analysis (RFA). 2016. 33 pp. Available from: http://s3.amazonaws.com/nefmc.org/2016-2017-Specifications-SupplementalInformation-Report.pdf.
15
Time-series analysis Estimate, standard error, t-value and p-value for linear regressions of red hake (southern) center of gravity (XCG, YCG), inertia, depth and positive area (PA) as a function of year. P-values < 0.05 are in bold. Corresponding time series plots are shown below, with significant linear fits indicated by a solid line. Sample sizes: spring (n = 36); fall (n = 40).
XCG YCG Inertia Depth PA
Estimate 6.18 1.76 -107.47 1.03 53.54
Spring SE t-value 0.97 6.36 0.30 5.95 93.65 -1.15 0.36 2.84 163.78 0.33
p-value < 0.001 < 0.001 0.259 0.008 0.746
Estimate 2.68 0.28 190.47 0.51 138.09
Fall SE t-value 0.79 3.38 0.21 1.35 129.04 1.48 0.16 3.16 112.54 1.23
p-value 0.002 0.185 0.148 0.003 0.227
16
Predictor variables Time-series of predictor variables for red hake (southern). Predictors and associated units are: Northeast Fisheries Science Center (NEFSC) bottom trawl survey stratified mean kg per tow (biomass), catch/NEFSC stratified mean kg per tow (relative F) and NEFSC stratified mean bottom temperature (°C). Data for all three predictors were set to NA for years in which there were insufficient bottom temperature recordings to calculate a stratified mean. Sample sizes: spring (n = 20); fall (n = 21).
17
Relative importance of predictors on spatial distribution Relative importance of predictor variables on spatial indicators for red hake (southern). Spatial indicators and associated units are: geographically referenced longitude and latitude of the center of gravity (XCG and YCG, respectively; km), inertia (km2), depth (m) and positive area (PA; km2). Predictor variables are: Northeast Fisheries Science Center (NEFSC) bottom trawl survey stratified mean kg per tow (biomass; kg), catch/NEFSC stratified mean kg per tow (relative F) and NEFSC stratified mean bottom temperature (°C). Predictor variables with the highest summed Akaike weights for each indicator are in bold.
Predictor XCG YCG Inertia Depth PA
Biomass 0.40 0.55 0.29 0.17 0.45
Spring Relative F Temperature 0.18 0.42 0.25 0.22 0.17 0.25 0.17 0.24 0.18 0.45
Biomass 0.98 0.94 0.31 0.31 0.26
Fall Relative F 0.16 0.19 0.16 0.35 0.23
Temperature 0.16 0.42 0.45 0.33 0.31
Model-averaged parameter estimates Model-averaged predictor estimates by spatial indicator for red hake (southern). Spatial indicators and associated units are: geographically referenced longitude and latitude of the center of gravity (XCG and YCG, respectively; km), inertia (km2), depth (m) and positive area (PA; km2). Predictor variables are: Northeast Fisheries Science Center (NEFSC) bottom trawl survey stratified mean kg per tow (biomass; kg), catch/NEFSC stratified mean kg per tow (relative F) and NEFSC stratified mean bottom temperature (°C).
XCG YCG Inertia Depth PA
Biomass -22.75 -9.42 774.86 0.74 2944.08
Spring Relative F Temperature -19.22 -1.85 -2.11 1.49 122.14 716.58 -0.36 -1.36 -2742.04 456.29
Biomass -79.93 -19.28 -1487.41 -1.35 1239.30
Fall Relative F -1.36 0.64 -114.00 -1.47 -703.24
Temperature 1.13 -2.88 1774.50 0.77 952.64
18
Species: Silver Hake (Merluccius bilinearis) Stock: Northern
Northeast Fisheries Science Center bottom trawl survey offshore strata on the continental shelf of the Northeast United States. Silver hake (northern) stock strata are shown in blue.
NEFSC surveys used in the most recent assessment: Fall only
Link to most recent benchmark assessment: Northeast Fisheries Science Center. 51st Northeast regional stock assessment workshop (51st SAW) assessment report. US Dept Commer, Northeast Fish Sci Cent Ref Doc. 2011; 11-02. 856 pp. Available from: http://www.nefsc.noaa.gov/publications/crd/crd1102/. Link to most recent assessment update: New England Fisheries Management Council. Small-mesh multispecies fishing year 2015-2017 specifications environmental assessment regulatory impact review and initial regulatory flexibility analysis. 2015. 136 pp. Available from: http://s3.amazonaws.com/nefmc.org/2015-2017-SpecificatinsDocument-2.pdf.
19
Time-series analysis Estimate, standard error, t-value and p-value for linear regressions of silver hake (northern) center of gravity (XCG, YCG), inertia, depth and positive area (PA) as a function of year. P-values < 0.05 are in bold. Corresponding time series plots are shown below, with significant linear fits indicated by a solid line. Sample sizes: spring (n = 48); fall (n = 54).
XCG YCG Inertia Depth PA
Estimate 0.15 0.72 42.33 -0.63 606.28
Spring SE t-value 0.31 0.47 0.24 2.97 19.71 2.15 0.28 -2.25 168.75 3.59
p-value 0.643 0.005 0.037 0.029 < 0.001
Estimate -0.01 0.76 1.06 -0.11 205.82
Fall SE t-value 0.18 -0.07 0.25 3.05 15.40 0.07 0.17 -0.61 45.58 4.52
p-value 0.944 0.004 0.945 0.547 < 0.001
20
Predictor variables Time-series of predictor variables for silver hake (northern). Predictors and associated units are: Northeast Fisheries Science Center (NEFSC) bottom trawl survey stratified mean kg per tow (biomass), catch/NEFSC stratified mean kg per tow (relative F) and NEFSC stratified mean bottom temperature (°C). Data for all three predictors were set to NA for years in which there were insufficient bottom temperature recordings to calculate a stratified mean. Sample sizes: spring (n = 41); fall (n = 46).
21
Relative importance of predictors on spatial distribution Relative importance of predictor variables on spatial indicators for silver hake (northern). Spatial indicators and associated units are: geographically referenced longitude and latitude of the center of gravity (XCG and YCG, respectively; km), inertia (km2), depth (m) and positive area (PA; km2). Predictor variables are: Northeast Fisheries Science Center (NEFSC) bottom trawl survey stratified mean kg per tow (biomass; kg), catch/NEFSC stratified mean kg per tow (relative F) and NEFSC stratified mean bottom temperature (°C). Predictor variables with the highest summed Akaike weights for each indicator are in bold.
Predictor XCG YCG Inertia Depth PA
Biomass 0.95 0.78 0.29 0.97 0.27
Spring Relative F Temperature 0.39 0.23 0.31 0.80 0.28 0.58 0.50 0.27 0.55 0.96
Biomass 0.25 0.66 0.30 0.95 0.94
Fall Relative F 0.39 0.52 0.26 0.60 0.97
Temperature 0.27 0.24 0.30 0.35 0.43
Model-averaged parameter estimates Model-averaged predictor estimates by spatial indicator for silver hake (northern). Spatial indicators and associated units are: geographically referenced longitude and latitude of the center of gravity (XCG and YCG, respectively; km), inertia (km2), depth (m) and positive area (PA; km2). Predictor variables are: Northeast Fisheries Science Center (NEFSC) bottom trawl survey stratified mean kg per tow (biomass; kg), catch/NEFSC stratified mean kg per tow (relative F) and NEFSC stratified mean bottom temperature (°C).
XCG YCG Inertia Depth PA
Biomass 17.86 -9.40 111.63 24.91 392.62
Spring Relative F Temperature 2.75 -0.68 -8.18 1.39 -250.52 131.91 5.47 -1.34 -3593.93 1457.86
Biomass -0.50 11.07 -129.87 15.88 2555.15
Fall Relative F -1.10 -3.42 -33.77 3.02 -1311.50
Temperature -0.78 -0.61 -108.94 1.63 398.52
22
Species: Silver Hake (Merluccius bilinearis) Stock: Southern
Northeast Fisheries Science Center bottom trawl survey offshore strata on the continental shelf of the Northeast United States. Silver hake (southern) stock strata are shown in blue.
NEFSC surveys used in the most recent assessment: Fall only
Link to most recent benchmark assessment: Northeast Fisheries Science Center. 51st Northeast regional stock assessment workshop (51st SAW) assessment report. US Dept Commer, Northeast Fish Sci Cent Ref Doc. 2011; 11-02. 856 pp. Available from: http://www.nefsc.noaa.gov/publications/crd/crd1102/. Link to most recent assessment update: New England Fisheries Management Council. Small-mesh multispecies fishing year 2015-2017 specifications environmental assessment regulatory impact review and initial regulatory flexibility analysis. 2015. 136 pp. Available from: http://s3.amazonaws.com/nefmc.org/2015-2017-SpecificatinsDocument-2.pdf
23
Time-series analysis Slope (β), standard error, t-value and p-value for linear regressions of silver hake (southern) center of gravity (XCG, YCG), inertia, depth and positive area (PA) as a function of year. P-values < 0.05 are in bold. Corresponding time series plots are shown below, with significant linear fits indicated by a solid line. Sample sizes: spring (n = 37); fall (n = 40).
XCG YCG Inertia Depth PA
Estimate 5.56 2.37 -198.63 0.29 80.23
Spring SE t-value 1.60 3.48 0.59 4.04 143.79 -1.38 0.28 1.03 171.23 0.47
p-value 0.001 < 0.001 0.176 0.309 0.642
Estimate 2.90 0.84 67.61 0.20 -12.20
Fall SE t-value 0.60 4.86 0.17 4.81 115.46 0.59 0.11 1.76 105.48 -0.12
p-value < 0.001 < 0.001 0.562 0.087 0.909
24
Predictor variables Time-series of predictor variables for silver hake (southern). Predictors and associated units are: Northeast Fisheries Science Center (NEFSC) bottom trawl survey stratified mean kg per tow (biomass), catch/NEFSC stratified mean kg per tow (relative F) and NEFSC stratified mean bottom temperature (°C). Data for all three predictors were set to NA for years in which there were insufficient bottom temperature recordings to calculate a stratified mean. Sample sizes: spring (n = 20); fall (n = 21).
25
Relative importance of predictors on spatial distribution Relative importance of predictor variables on spatial indicators for silver hake (southern). Spatial indicators and associated units are: geographically referenced longitude and latitude of the center of gravity (XCG and YCG, respectively; km), inertia (km2), depth (m) and positive area (PA; km2). Predictor variables are: Northeast Fisheries Science Center (NEFSC) bottom trawl survey stratified mean kg per tow (biomass; kg), catch/NEFSC stratified mean kg per tow (relative F) and NEFSC stratified mean bottom temperature (°C). Predictor variables with the highest summed Akaike weights for each indicator are in bold.
Predictor XCG YCG Inertia Depth PA
Biomass 0.18 0.16 0.60 0.25 0.26
Spring Relative F Temperature 0.33 0.43 0.30 0.85 0.19 0.19 0.36 0.61 0.17 0.18
Biomass 1.00 0.86 0.16 0.62 0.75
Fall Relative F 0.83 0.71 0.17 0.16 0.16
Temperature 0.46 0.14 0.17 0.54 0.15
Model-averaged parameter estimates Model-averaged predictor estimates by spatial indicator for silver hake (southern). Spatial indicators and associated units are: geographically referenced longitude and latitude of the center of gravity (XCG and YCG, respectively; km), inertia (km2), depth (m) and positive area (PA; km2). Predictor variables are: Northeast Fisheries Science Center (NEFSC) bottom trawl survey stratified mean kg per tow (biomass; kg), catch/NEFSC stratified mean kg per tow (relative F) and NEFSC stratified mean bottom temperature (°C).
XCG YCG Inertia Depth PA
Biomass -1.00 -0.17 5834.55 3.06 1273.35
Spring Relative F Temperature -10.57 10.75 -4.44 16.36 -539.81 440.29 -9.97 -3.35 232.26 350.86
Biomass -114.72 -18.66 221.68 -4.89 8621.01
Fall Relative F -23.29 -6.96 -179.62 -0.14 -246.27
Temperature 3.74 0.14 185.05 2.72 60.81
26
Species: White Hake (Urophycis tenuis) Stock: Unit
Northeast Fisheries Science Center bottom trawl survey offshore strata on the continental shelf of the Northeast United States. White hake (unit) stock strata are shown in blue.
NEFSC surveys used in the most recent assessment: Spring & Fall
Link to most recent benchmark assessment: Northeast Fisheries Science Center. 56th Northeast regional stock assessment workshop (56th SAW) assessment report. US Dept Commer, Northeast Fish Sci Cent Ref Doc. 2013; 13-10. 868 pp. Available from: http://nefsc.noaa.gov/publications/crd/crd1310/. Link to most recent assessment update: Northeast Fisheries Science Center. Operational assessment of 19 Northeast groundfish stocks, updated through 2016. US Dept Commer, Northeast Fish Sci Cent Ref Doc. 2017; 17-17. 259 pp. Available from: http://www.nefsc.noaa.gov/publications/crd/crd1717/.
27
Time-series analysis Estimate, standard error, t-value and p-value for linear regressions of white hake (unit) center of gravity (XCG, YCG), inertia, depth and positive area (PA) as a function of year. P-values < 0.05 are in bold. Corresponding time series plots are shown below, with significant linear fits indicated by a solid line. Sample sizes: spring (n = 48); fall (n = 54).
XCG YCG Inertia Depth PA
Estimate 0.73 -0.11 -13.76 0.45 57.49
Spring SE t-value 0.29 2.48 0.16 -0.73 16.80 -0.82 0.23 1.99 85.81 0.67
p-value 0.017 0.467 0.417 0.053 0.506
Estimate 0.53 -0.17 -33.67 0.51 171.68
Fall SE t-value 0.18 2.96 0.10 -1.71 17.18 -1.96 0.09 5.38 94.52 1.82
p-value 0.005 0.093 0.056 < 0.001 0.075
28
Predictor variables Time-series of predictor variables for white hake (unit). Predictors and associated units are: Northeast Fisheries Science Center (NEFSC) bottom trawl survey stratified mean kg per tow (biomass), catch/NEFSC stratified mean kg per tow (relative F) and NEFSC stratified mean bottom temperature (°C). Data for all three predictors were set to NA for years in which there were insufficient bottom temperature recordings to calculate a stratified mean. Sample sizes: spring (n = 41); fall (n = 46).
29
Relative importance of predictors on spatial distribution Relative importance of predictor variables on spatial indicators for white hake (unit). Spatial indicators and associated units are: geographically referenced longitude and latitude of the center of gravity (XCG and YCG, respectively; km), inertia (km2), depth (m) and positive area (PA; km2). Predictor variables are: Northeast Fisheries Science Center (NEFSC) bottom trawl survey stratified mean kg per tow (biomass; kg), catch/NEFSC stratified mean kg per tow (relative F) and NEFSC stratified mean bottom temperature (°C). Predictor variables with the highest summed Akaike weights for each indicator are in bold.
Predictor XCG YCG Inertia Depth PA
Biomass 0.25 0.22 0.22 0.22 0.66
Spring Relative F Temperature 0.22 0.43 0.23 0.28 0.24 0.24 0.22 0.22 0.50 0.91
Biomass 0.34 0.24 0.37 0.23 0.52
Fall Relative F 0.38 0.33 0.37 0.23 0.82
Temperature 0.22 0.26 0.23 0.25 0.43
Model-averaged parameter estimates Model-averaged predictor estimates by spatial indicator for white hake (unit). Spatial indicators and associated units are: geographically referenced longitude and latitude of the center of gravity (XCG and YCG, respectively; km), inertia (km2), depth (m) and positive area (PA; km2). Predictor variables are: Northeast Fisheries Science Center (NEFSC) bottom trawl survey stratified mean kg per tow (biomass; kg), catch/NEFSC stratified mean kg per tow (relative F) and NEFSC stratified mean bottom temperature (°C).
XCG YCG Inertia Depth PA
Biomass -1.06 -0.07 -8.67 0.05 3163.54
Spring Relative F Temperature 4.74 -0.01 -0.31 -0.92 40.12 -40.19 0.07 0.17 -2071.75 4735.55
Biomass -1.97 -0.20 -241.23 -0.09 3011.93
Fall Relative F 2.38 -1.20 208.56 -0.08 -6049.66
Temperature 0.01 0.57 -7.42 0.68 874.97
30
Species: Yellowtail Flounder (Limanda ferruginea) Stock: Georges Bank
Northeast Fisheries Science Center bottom trawl survey offshore strata on the continental shelf of the Northeast United States. Yellowtail flounder (Georges Bank) stock strata are shown in blue.
NEFSC surveys used in the most recent assessment: Spring & Fall
Link to most recent benchmark assessment: Legault CM, Alade L, Gross WE, Stone HH. Stock assessment of Georges Bank yellowtail flounder for 2014. Transboundary Resources Assessment Committee Ref Doc. 2014; 2014/01. 214 pp. Available from: http://www.nefsc.noaa.gov/saw/trac/TRD_2014_01_E_.pdf. Link to most recent assessment update: Legault CM, McCurdy QM. Stock Assessment of Georges Bank Yellowtail Flounder for 2017. Transboundary Resources Assessment Committee Work Pap. 2017; 2017/03. 66 pp. Available from: https://www.nefsc.noaa.gov/saw/trac/wp3_legault_gb_yellowtail_assessment.pdf.
31
Time-series analysis Estimate, standard error, t-value and p-value for linear regressions of yellowtail flounder (Georges Bank) center of gravity (XCG, YCG), inertia, depth and positive area (PA) as a function of year. P-values < 0.05 are in bold. Corresponding time series plots are shown below, with significant linear fits indicated by a solid line. Sample sizes: spring (n = 47); fall (n = 54).
XCG YCG Inertia Depth PA
Estimate 0.94 0.54 -57.08 0.24 -38.74
Spring SE t-value 0.37 2.54 0.29 1.89 18.27 -3.12 0.08 2.89 45.62 -0.85
p-value 0.015 0.065 0.003 0.006 0.400
Estimate 1.21 0.63 -63.59 0.18 -208.55
Fall SE t-value 0.25 4.78 0.24 2.65 14.51 -4.38 0.09 1.93 101.56 -2.05
p-value < 0.001 0.011 < 0.001 0.060 0.045
32
Predictor variables Time-series of predictor variables for yellowtail flounder (Georges Bank). Predictors and associated units are: Northeast Fisheries Science Center (NEFSC) bottom trawl survey stratified mean kg per tow (biomass), catch/NEFSC stratified mean kg per tow (relative F) and NEFSC stratified mean bottom temperature (°C). Data for all three predictors were set to NA for years in which there were insufficient bottom temperature recordings to calculate a stratified mean. Sample sizes: spring (n = 37); fall (n = 41).
33
Relative importance of predictors on spatial distribution Relative importance of predictor variables on spatial indicators for yellowtail flounder (Georges Bank). Spatial indicators and associated units are: geographically referenced longitude and latitude of the center of gravity (XCG and YCG, respectively; km), inertia (km2), depth (m) and positive area (PA; km2). Predictor variables are: Northeast Fisheries Science Center (NEFSC) bottom trawl survey stratified mean kg per tow (biomass; kg), catch/NEFSC stratified mean kg per tow (relative F) and NEFSC stratified mean bottom temperature (°C). Predictor variables with the highest summed Akaike weights for each indicator are in bold.
Predictor XCG YCG Inertia Depth PA
Biomass 0.23 0.25 0.69 0.22 0.97
Spring Relative F Temperature 0.27 0.79 0.46 0.57 0.23 0.92 0.42 0.67 0.23 0.32
Biomass 0.41 0.42 0.22 0.29 0.70
Fall Relative F 0.70 0.40 0.94 0.56 0.25
Temperature 0.48 0.77 0.48 0.22 0.66
Model-averaged parameter estimates Model-averaged predictor estimates by spatial indicator for yellowtail flounder (Georges Bank). Spatial indicators and associated units are: geographically referenced longitude and latitude of the center of gravity (XCG and YCG, respectively; km), inertia (km2), depth (m) and positive area (PA; km2). Predictor variables are: Northeast Fisheries Science Center (NEFSC) bottom trawl survey stratified mean kg per tow (biomass; kg), catch/NEFSC stratified mean kg per tow (relative F) and NEFSC stratified mean bottom temperature (°C).
XCG YCG Inertia Depth PA
Biomass 0.54 0.67 -421.77 0.07 2507.68
Spring Relative F Temperature -8.10 0.83 -3.71 2.49 537.74 -1.25 -1.58 -0.76 26.89 375.32
Biomass -2.70 -2.13 9.35 -0.33 1796.86
Fall Relative F -6.23 -1.59 742.26 -1.12 -38.24
Temperature 2.77 4.53 -145.84 0.02 -605.08
34
Species: Yellowtail Flounder (Limanda ferruginea) Stock: Southern New England-Mid Atlantic
Northeast Fisheries Science Center bottom trawl survey offshore strata on the continental shelf of the Northeast United States. Yellowtail flounder (Southern New England-Mid Atlantic) stock strata are shown in blue.
NEFSC surveys used in the most recent assessment: Spring & Fall
Link to most recent benchmark assessment: Northeast Fisheries Science Center. 54th Northeast regional stock assessment workshop (54th SAW) assessment report. US Dept Commer, Northeast Fish Sci Cent Ref Doc. 2012; 12-18. 600 pp. Available from: http://www.nefsc.noaa.gov/publications/crd/crd1218/. Link to most recent assessment update: Northeast Fisheries Science Center. Operational assessment of 19 Northeast groundfish stocks, updated through 2016. US Dept Commer, Northeast Fish Sci Cent Ref Doc. 2017; 17-17. 259 pp. Available from: http://www.nefsc.noaa.gov/publications/crd/crd1717/.
35
Time-series analysis Estimate, standard error, t-value and p-value for linear regressions of yellowtail flounder (Southern New England-Mid Atlantic) center of gravity (XCG, YCG), inertia, depth and positive area (PA) as a function of year. P-values < 0.05 are in bold. Corresponding time series plots are shown below, with significant linear fits indicated by a solid line. Sample sizes: spring (n = 49); fall (n = 54).
XCG YCG Inertia Depth PA
Estimate 1.16 0.85 -193.15 0.08 -664.93
Spring SE t-value 0.37 3.10 0.17 4.95 37.49 -5.15 0.04 2.25 196.87 -3.38
p-value 0.003 < 0.001 < 0.001 0.029 0.002
Estimate 0.26 0.28 -119.23 0.10 -442.91
Fall SE t-value 0.46 0.57 0.15 1.85 36.32 -3.28 0.04 2.38 59.07 -7.50
p-value 0.570 0.070 0.002 0.021 < 0.001
36
Predictor variables Time-series of predictor variables for yellowtail flounder (Southern New England-Mid Atlantic). Predictors and associated units are: Northeast Fisheries Science Center (NEFSC) bottom trawl survey stratified mean kg per tow (biomass), catch/NEFSC stratified mean kg per tow (relative F) and NEFSC stratified mean bottom temperature (°C). Data for all three predictors were set to NA for years in which there were insufficient bottom temperature recordings to calculate a stratified mean. Sample sizes: spring (n = 46); fall (n = 51).
37
Relative importance of predictors on spatial distribution Relative importance of predictor variables on spatial indicators for yellowtail flounder (Southern New England-Mid Atlantic). Spatial indicators and associated units are: geographically referenced longitude and latitude of the center of gravity (XCG and YCG, respectively; km), inertia (km2), depth (m) and positive area (PA; km2). Predictor variables are: Northeast Fisheries Science Center (NEFSC) bottom trawl survey stratified mean kg per tow (biomass; kg), catch/NEFSC stratified mean kg per tow (relative F) and NEFSC stratified mean bottom temperature (°C). Predictor variables with the highest summed Akaike weights for each indicator are in bold.
Predictor XCG YCG Inertia Depth PA
Biomass 0.97 0.99 0.84 0.61 1.00
Spring Relative F Temperature 0.26 0.47 0.28 0.22 0.69 0.25 0.23 0.39 0.22 0.22
Biomass 0.26 0.36 0.54 0.29 1.00
Fall Relative F 0.25 0.45 0.86 0.30 0.33
Temperature 0.29 0.24 0.48 0.95 0.91
Model-averaged parameter estimates Model-averaged predictor estimates by spatial indicator for yellowtail flounder (Southern New EnglandMid Atlantic). Spatial indicators and associated units are: geographically referenced longitude and latitude of the center of gravity (XCG and YCG, respectively; km), inertia (km2), depth (m) and positive area (PA; km2). Predictor variables are: Northeast Fisheries Science Center (NEFSC) bottom trawl survey stratified mean kg per tow (biomass; kg), catch/NEFSC stratified mean kg per tow (relative F) and NEFSC stratified mean bottom temperature (°C).
XCG YCG Inertia Depth PA
Biomass -12.28 -7.48 1171.33 -0.47 7973.86
Spring Relative F Temperature 1.25 2.89 -0.62 -0.04 1260.67 80.79 -0.03 0.24 32.79 2.73
Biomass -0.87 -0.67 401.00 -0.12 4547.13
Fall Relative F 0.91 -1.67 1467.03 0.18 274.95
Temperature -1.47 -0.13 -407.92 1.86 -1434.00