S3 Fig. Hemocyte phenotypes of ird1 mutants and in ird1-suppressed larvae, with or with- out the Tl10b ... The white frame indicates the segmental area used to ...
are shown in bold red text followed by protospacer adjacent sequence (PAM) in bold black text. LOCUS. Hz_TO_Ex6. 145 bp DNA. DEFINITION guides analysis ...
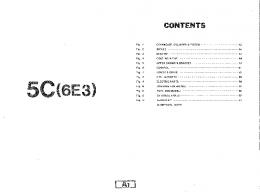
This Parts Catalogue is related to the parts in use for the Yamaha outboard motor
5C '85. (653). When you are ordering replacement parts for the SC '85 (653), ...
B. VFLYIKKVVKKPKDNEILPPAARRQDPQEMEDYPGHNTAAPVQETLHGCQPVTQEDGKESRISVQERQVTDSIALRPLV. TRAF6. TRAF2/3. Box2. mT6. mT23.
S3 Fig. Comparison with the structure of MERS-CoV Mpro with that of SARS-. CoV Mpro (A) and those of ligand-bound complex, dimeric C148A mutant and bat-.
S3 Fig: Inhibition of ERK½ phosphorylation by U0126. Representative blots showing effect of U0126 pre-treatment on phosphorylation of ERK½ with or without ...
S3 Fig. Virtual cut through an array of helical (or sinusoidal) tubules obtained through a series of successive cuts through individual tubules. Simulation of the.
S3 Fig. Species accumulation curves based on different bacterial taxonomic categories: phylum to family (a), genera (b), and OTU0.03 level (c). Colors in a) ...
Sox7 CKO/+; Tie2-Crex Sox7 CKO/CKO. Sox7 +/-% Sox17 +/-. Genotype of Progeny Live. O. Sox7 CKO/CKO, Tie 2-Cre0. Sox7 +/-; Sox17 +/-. 1. Sox7 --.
S3 Fig. Growth rates (mm d-1) measured as a change in length over the experimental exposure duration for copper and blue rockfish as a function of pCO2 ...
S3 Fig. PNS differentiation from NL+ cells. Ãâ ¢ tubulin. DAPI day14. 100µM. A. % of Max. CD73. CD105. CD90. CD45. CD44. HLA-DR. % of Max.
Figure S3. Percentage of borders of a given robustness score. Data for borders aligning within 10 kb (a) or exactly in the same bin (b). The plot on the left of the ...
S3 Fig. Heat map dendrogram. (Same as Fig 6, but with RNA names shown) This figure shows the heat map dendrogram of sequence similarity (upper-left ...
S3 Fig. Heat map dendrogram. (Same as Fig 6, but with RNA names shown) This figure shows the heat map dendrogram of sequence similarity (upper-left triangle) and fingerprint similarity (Extended Jaccard Similarity, lower-right triangle) of all the curated RNA structures (represented by IDs followed by their names, corresponding to S5 Table). Similarity is shown in different colors, ranging from 0 (blue) to 1 (red) at steps of 0.1. A neighbor-joining tree calculated according to the fingerprint similarity is shown on the right side of the heat map (branching showing the tree topology but branch lengths are not the true distances between nodes).