in the saccade direction, the localization error being a time function. When the 9-msec ... at a single reti- nal point is not processed separately at each moment;.
Perception & Psychophysics 1978, Vol. 24 (3), 215-224
Saccadic eye movements and localization of visual stimuli STEFAN MATEEFF Institute ofPhysiology, Bulgarian Academy ofSciences, 1113 Sofia, Bulgaria
Visual localization phenomena were studied before, during, and after a saccade. Light flashes of .5 and 9 msec duration presented before and during the eye movement were mislocated in the saccade direction, the localization error being a time function. When the 9-msec duration stimulus and saccade did not overlap in time, a stripe was reported, when they did not, the stimulus was perceived as a point. If a long-duration stimulus moved perpendicularly to the saccade direction with the same "sigmoidal" velocity, a curvilinear trace was perceived, regardless of the linear trace of the image on the retina. A stimulus with stabilized retinal image was perceived as a stationary point during the saccade. A possible theory to deal with the data was suggested by modifying the algebra of outflow-inflow theories.
When a visual stimulus is presented, one of the tasks presented to our visual system is to answer the question, "Where is it?" Our everyday experience shows this task to be performed relatively well. What is more, usually we localize surrounding objects properly, no matter where we look. In spite of the fact that a shift of gaze results in changes of the loci of the retinal image, under normal conditions object localization remains constant. This property of the visual system is known as "position constancy." Two of the explanations of position constancy are provided by the outflow and inflow theories, which are described briefly as follows. A center, or mechanism, which receives two "messages" is assumed to exist in the visual system. The first of these "messages" concerns the locus of the retinal image. The second provides information about the position of the eye. These two "messages" are somehow summated algebraically, and the resultant of this operation determines the perceived locus of the object. The difference between the two theories concerns the source of the information about eye position. According to the outflow theory (Holst, 1954; Holst & Mittelstaedt, 1950), this "message" comes from a hypothetical neural center from which the command to turn the eye originates, and it is thought that the "message" is a copy of the command for the eye movement. According to the alternative inflow theory (Sherrington, 1918), eye muscle proprioception provides this information. We will not deal with the outflow-inflow controversy in the present paper. The fact of importance The author is greatly indebted to Professor L. Mitrani and to Dr. N. Yakimoff from the Institute of Physiology, Sofia, and to Dr. M. S. Smirnov from the Institute of Problems of Information Transmission, Moscow, for their fruitful participation in the discussion of the work and for their recommendations.
for us is that both theories imply the same algebraic operations between information about the retinal locus of the object and about position of the eye. Thus, we shall consider them as one theory and call it "subtraction theory." Several authors (Bischof & Kramer, 1968; Matin, 1972; Matin & Matin, 1972; Matin, Matin, &Pearce, 1969; Matin, Matin, & Pola, 1970; Matin & Pearce, 1965; Monahan, 1972) have shown that a brief light stimulus presented during or just before voluntary saccadic eye movements is frequently mislocated by considerable amounts. The size of the error depends on the time at which the stimulus is presented relative to the saccade onset. Matin, Matin, and Pearce (1969) and Matin, Matin, and Pola (1970) showed that if subtraction theory was to be viable enough to deal with their data it would have to be substantially modified. They assumed that the information about the eye movement did not parallel the actual course of the saccade. More than a simple mismatch of latencies between information regarding the retinal locus of the image and the position of the eye was required, however; they also found that it was necessary to assume that the information regarding the change in eye position extended over a much longer time than is taken by the saccade itself. In the present paper, we develop a quantitative model involving a temporally extended signal regarding the eye movement and show that this predicts the data if we add several additional assumptions: (1) The information regarding events at a single retinal point is not processed separately at each moment; the localization center integrates information over a considerable length of time. (2) The localization center processes the information about the locus of each stimulated point on the retina separately from every other point.
215
216
MATEEFF
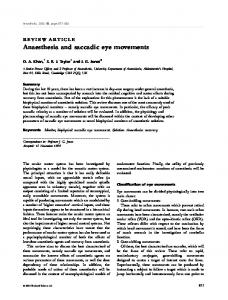
Figure 1. The scale with divisions; 1 angular degree = 2 scale units. 1, 2 = fixation points. The stimulus is labeled above the zero scale division.
EXPERIMENT 1 Method The experimental arrangement (Figure 1) resembled that used by Bischof and Kramer (1968). The subject sat 57 em in front of a screen of black paper. A horizontal scale with divisions was mounted on the screen at the subject's eye level. Two fixation points 12° apart were placed on the scale. The experiment was carried out in darkness, with only the scale and the fixation points illuminated and clearly visible. There was a circular hole, 15' in diameter, in the black screen above the zero scale division. The cathode-ray tube of a monitor was placed on the rear of the screen. The electron beam was focused to produce a bright flash on the hole. The parameters of the flash were determined by settings of a square-wave generator which had provisions for varying the delay and duration of single rectangular pulses. The output of this generator was fed to the intensity-modulating input of the monitor. Thus, the stimulus consisted of a circle of light of about .5 msec duration I and was always presented above the zero scale division, straight in front of the subject (Figure 1). The screen and the scale were viewed binocularly. The subject's eye movements were registered photoelectrically (Mitrani, Mateeff, & Yakimoff, 1970). The light from an incandescent bulb passed through an infrared filter and illuminated the right eye. After reflection from the eye, the light fell on two appropriately placed phototransistors connected in a bridge circuit. The output was thus related to. the rotation of the eye in the horizontal plane. This was fed to an oscilloscope, and the experimenter was able to observe the movement visually. The smallest eye movement that could be registered by this method was about 10' -15' . The subject was instructed to perform a saccade from the left fixation point to the right one immediately after an auditory signal. The square-wave generator was started simultaneously with the signal. When the delay of the generator output was longer than the subject's reaction time for saccade performance, the stimulus was presented after the saccade onset, and vice versa. The experimenter varied the stimulus delay arbitrarily during the experiment. Thus, due to the natural variations of the reaction time, the stimulus was presented practically randomly in time. The signal from the eye-movement registering system triggered a discriminator at the very beginning of the saccade. The time interval between the stimulus and the pulse from the discriminator was measured by two electronic chronometers (made in Bulgaria). The first of these measured the time interval when the stimulus appeared before the saccade onset, the second, when the saccade onset came before the stimulus. Thus, the moment of stimulus presentation before as well as after the saccade onset was determined with a precision of about 1-2 msec. After the saccade performance, the subject had to report verbally the scale division above which he had seen the stimulus. Reports of "I did not see" or "I cannot say" were allowed. The experimenter monitored the correct performance of the eye movement on the oscilloscope. Trials were rejected when, instead of a single 12° saccade, a smaller one or other saccades occurred before or after the main eye movement. After each performance,
the experimenter registered the subject's report and the moment of stimulus presentation, determined as described above. Three subjects with normal vision, aged 20-25 years, participated in the experiment. About 600 successful trials were carried out with each of them. The subjects were told that the stimulus would be presented at various scale divisions, and until the end of the experiment they did not guess that its place of presentation was, in fact, always the same.
Results The time interval of about 150 msec before to 60 msec after the saccade was investigated. It was divided into subintervals of 10 msec, and the subject's reports to stimuli presented in each subinterval were averaged and the 95070 confidence limits were determined. The results for all subjects were shown in Figures 2a, 2b, and 2c. The moment of stimulus presentation, t, is plotted in milliseconds on the abscissa, the zero point being the saccade onset. The subinterval averages of the subject's reports, y*, measured in angular degrees from the zero scale division are plotted on the ordinate. The data show that a stimulus presented in the time interval [-120 msec, 60 msec) is mislocated mainly in the direction of the saccade. The maximum mislocation error of 3°_5° occurs at the saccade onset, such that such stimuli are localized near the right fixation point. Long before and after the saccade, the subjects reported the stimulus always to be above the zero division.
EXPERIMENT 2 Method The arrangement of the second experiment was the same as that in Experiment I, but the stimulus duration was 9 msec. The subjects were told they would be presented with a horizontal light stripe above the scale during each saccade performance, and the length and locus of the stripe would vary randomly from trial to trial. Their task was to localize the stripe by reporting verbally the numeral of the scale division that coincided with each of the two ends of the stripe. If the subjects perceived the stripe as being reduced to a point, they were to report only one scale division. Three subjects with normal vision, aged 20-25, participated in the experiment; about 400 successful trials were carried out with each of them.
Results The results from Experiment 2 for all subjects are shown in Figures 3a, 3b, and 3c. They were averaged in subintervals, in a fashion similar to that of the previous experiment. The moment of stimulus onset, t, is plotted in milliseconds on the abscissa, the subject's reports, yt and yt, for the location of the left and the right end of the stripe, respectively, are plotted on the ordinate. The data show that the subjects perceive the stimulus correctly only when it is presented beyond the time interval [-100 msec, 60 msec). If a stimulus
SACCADIC EYE MOVEMENTS
217
overlap the eye-movement duration, it is perceived as a stripe mislocated in the direction of the saccade. The time course of the curves yn:t)and y1(t)resembles the time course of y*(t) obtained in Experiment 1 (Figures 2a, 2b, and 2c).
sU~ject P.M.
subject NY
.
-100
-1
•
fig 2a
• • •
\
• •
0--