294. Choi & Seo method that can effectively deal with all of the safety aspects systematically by incorporating expert's experi- ences and intuition, site conditions, ...
Computer-Aided Civil and Infrastructure Engineering 24 (2009) 293–301
Safety Assessment Using Imprecise Reliability for Corrosion-Damaged Structures Hyun-Ho Choi Expressway Design Evaluation Office, Korea Expressway Corporation, Seongnam, Kyung-gi, Korea
&
Jongwon Seo∗ Department of Civil and Environmental Engineering, Hanyang University, Seoul, Korea
Abstract: Safety assessment procedure including imprecise reliability for corrosion-damaged structures is proposed in this article. The proposed procedure may be used for the safety assessment of corroded structures when the data for safety analysis are insufficient or when a decision for safety management is urgently required. In case exact measurement such as nondestructive test cannot be utilized to assess a corroded point for any reason, expert’s estimation with simple visual inspection based on the data of nondestructive test at near point can be used. The system reliability-based safety assessment may then be performed approximately but rationally by simply converting the qualitative expert’s estimation to quantitative terms in this proposed procedure. Moreover, the approximate safety expressed as a safety range could also be evaluated effectively in hazardous environments such as typhoon where data collection for deterioration is very difficult. The proposed safety assessment procedure using the imprecise reliability was also applied to a cablestayed bridge in Korea to demonstrate its effectiveness and applicability.
∗ To whom correspondence should be addressed. E-mail: jseo@ hanyang.ac.kr.
� C 2009 Computer-Aided Civil and Infrastructure Engineering. DOI: 10.1111/j.1467-8667.2009.00597.x
1 INTRODUCTION There is a high degree of uncertainty in measurements of the loss of thickness of corroded elements. Unfortunately, current inspection techniques for thickness or crack length measurement are far from perfection, and the spatial variability of corrosion makes the measurement even more difficult. Although extensive studies on the probabilistic safety analysis based on the reliability assessment techniques were performed to deal with uncertainties for such special facilities as nuclear power plants, gas facilities, pipelines, and long spanned bridges (Farhey et al., 1997; Fisher, 1996; Rackwitz and Fiessler, 1978; Nowak and Yamani, 1995), it is difficult to find practical applications of safety analysis for complex structures characterized by uncertain corrosion state of numerous structural members. Therefore, the safety analysis of corrosion-damaged structures often relies on expert’s experience and intuition because of the complexity and the limitation of visual inspection. However, the significant studies on explicit quantitative safety analysis and evaluation techniques effectually considering those subjective judgments based on expert’s experiences and intuitions do not seem to be available yet. Considering the insufficiency of the data available for the probabilistic safety assessment of most construction projects, a rational safety assessment
294
Choi & Seo
method that can effectively deal with all of the safety aspects systematically by incorporating expert’s experiences and intuition, site conditions, and analyzed data is urgently needed. The objective of this article is to propose a procedure of safety assessment using imprecise reliability for corrosion-damaged structures. The proposed procedure could be used for the safety assessment of corroded structures when the data for safety analysis are insufficient or when a decision for safety management is urgently required. In case exact measurement such as nondestructive test cannot be utilized to assess a corroded point for any reason, expert’s estimation with simple visual inspection based on the data of nondestructive test at near point can be used. The system reliabilitybased safety assessment may then be performed approximately but rationally by simply converting the qualitative expert’s estimation to quantitative terms in this proposed procedure. Moreover, the approximate safety expressed as a safety range could also be evaluated effectively in hazardous environments such as typhoon where data collection for deterioration is very difficult. It is believed that the system reliability-based safety assessment using imprecise reliability could be reasonably and easily performed in practice based on the proposed procedure because the expert’s experience and the previous data of nondestructive test or visual inspection at near point can be effectively utilized.
is also presented in detail in Kozine and Filimonv (2000). As a summary, logical independence is the weakest one and conditional independence is similar to conventional system reliability. The equations of logical independence are as follows: ⎧ Pl (X ∩ Y) = max[0, P(X) + P(Y) − 1] ⎪ ⎪ ⎪ ⎪ ⎪ ⎪ ⎪ ⎪ Pl (X ∩ Y) = min[P(X), P(Y)] ⎨ (1) ⎪ ⎪ Pl (X ∪ Y) = max[P(X), P(Y)] ⎪ ⎪ ⎪ ⎪ ⎪ ⎪ ⎩ Pl (X ∪ Y) = min[1, P(X) + P(Y)] Designation “Pl ” with the sub l indicates that the resulting probabilities are obtained based on the judgment of logical independence. The equations of conditional independence are as follows: ∗
In series: Pc (X ∩ Y) = P(X)P(Y), Pc (X ∩ Y) = P(X)P(Y) (2a)
∗
Pc (X ∪ Y) = P(X) + P(Y) − P(X)P(Y) In parallel: Pc (X ∪ Y) = P(X) + P(Y) − P(X)P(Y)
(2b)
where the sub c indicates that the resulting probabilities are obtained based on the judgment of conditional independence.
2 IMPRECISE RELIABILITY THEORY In this article, imprecise reliability theory well described in Kozine and Filimonv (2000) is used for safety assessment procedure to handle and analyze the uncertainties. Unlike conventional reliability theory, the lower and upper probabilities of event A, P(A), and P(A), of the unions and intersections (depending on the lower and upper probabilities of X and Y) can be obtained without the judgment of conditional dependence or independence (Kozine and Filimonv, 2000). Here, X and Y are called logically independent events. Therefore, conditional dependence can be ignored. Thus, because precise probabilities cannot be obtained for adequate and credible models of the real structures, imprecise reliability could be effectively used in many reliability applications. A general procedure for imprecise reliability is the following: (1) eliciting any probability judgments that express the desirability of specific gambles; (2) checking that these judgments avoid sure loss; (3) then constructing coherent lower probabilities. Two methods of imprecise system reliability are logical independence and conditional independence, which
3 CORROSION-DAMAGED STRUCTURES Generally the thickness of corroded elements varies from one location of the element to another depending on the degree of corrosion (Sarveswaran et al., 1998). Thus, in this article, Sarveswaran model for corroded thickness and varying thickness loss is used to generate an imprecise probability of failure. These models are described in detail in Sarveswaran et al. (1998). The equation of corroded thickness is modeled as follows: T C = [Tc , T c ]
(3)
where T C is corroded element of a beam (flange, web or stiffener); Tc and T c are the lower and upper bounds of the corroded thickness. A corrosion decay model (varying thickness loss model) has also been developed by Sarveswaran et al. (1998) using percentage thickness loss of elements . T c = T N − cξ T N
(4)
where T N is the as-new thickness of the element, c is a constant (0.7∼1.3), ξ = %LT/100, and %LT is the average percentage loss of thickness. In this article, it has
Safety assessment using imprecise reliability for corrosion-damaged structures
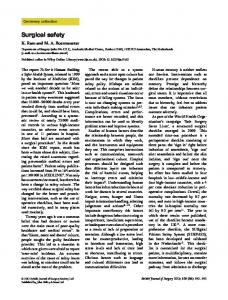
Data Collection
Structural Modeling
Visual Inspection
Subjective Judgments Based on Information Data
Formulation G1 = X2 - 2X3
Safety Management
Reliability Analysis
Structural Analysis
Probability Interval of Imprecise Elements Probability interval
1 0 -2
Automated Program for Partial ETA
A = 0 .1 , k = 1
1 0 -3
295
1.0
1 0 -4
1 0 -5
S
Possibility space
R
A = 0 .0 1 , k = 2 1 0 -6 1
10
1 00
10 00
10 0 00
Monte Carlo Simulation
Find Min & Max Strength
0
0.075
0.2235
Percentage loss of thickness of X1
Fig. 1. Procedure of safety assessment using imprecise reliability.
been emphasized that a practical approach is to estimate the value of ξ on some basis.
4 PROCEDURE OF SAFETY ASSESSMENT USING IMPRECISE RELIABILITY Safety assessment using imprecise reliability can be performed by the following procedure as shown in Figure 1. As shown in Figure 1, the first step is to collect the data such as the general description of the selected structure, the state of the deterioration, the previous inspection data, etc. Structural modeling is performed at the second step. Next, if imprecision that has upper and lower probabilities such as corroded thickness are determined, subjective judgments based on the inspection data are made. That is, expert’s estimation with simple visual inspection based on the previous data of nondestructive test or visual inspection at near point can be used. Then, reliability analysis is carried out using probability interval of imprecision by simply converting the qualitative expert’s estimation to quantitative terms in this proposed procedure. At this step, the numerical values of random variables and the limit state functions should also be investigated for structural analysis. Finally, it is determined whether safety maintenance action is needed or not depending on the results of reliability analysis and the risk-acceptance criteria described later in this article. As described earlier, the procedure of safety assessment is proposed when the data for safety analysis are insufficient or when a decision for safety management is urgently required in hazardous environments such as typhoon or where data collection for deterioration is very difficult. The resulting interval reliability index will
be helpful to decide safety-management options such as urgent repair of critical point or to decide whether more exact and precise safety analysis including nondestructive test (NDT) inspection is needed or not, if available.
5 APPLICATION 5.1 Data collection and structural modeling The structure selected for this study is a cable-stayed bridge. Cable-stayed bridges are complex structures. Therefore, nonlinear analysis approaches and algorithms for robust control of them have been studied (Adeli and Zhang, 1995; Kim and Adeli, 2005). The selected cable-stayed bridge constructed in Jeon-Nam area, Korea, has a deck system consisting of a threespan continuous single steel box with a main span of 344 m and the side spans of 70 m as shown in Figure 2. The stay-cables are arranged in a fan configuration that converges at the top of an A-frame tower. Each tower carries 34 stay-cables. The two towers reach 69 m above their fixed base on piers. The design live load is HS-20 generally used in AASHTO (1998). The cross-section of the single stiffened steel box girder with closed ribs has a hexagonal shape as shown in Figure 2b. The Aframe towers, stayed cables, and girder system constitute a three-dimensional space structure.
5.2 Subjective judgments and probability intervals In this application, as there is a large variation in measurements of the thickness of corroded elements, the thickness of corroded elements is considered as
296
Choi & Seo
344,000
20m
70,000
70,000
180m Ve rtical Curve
200m navigation Channel
(a) Longitudinal Section
(b) Top View
(c) Typical Cross Section of Deck
(d) Pylon
Fig. 2. Section property of applied bridge.
imprecision that has upper and lower probabilities. This variation was found to be directly related to the degree of corrosion; in other words the degree of corrosion increases as the variation increases. Also, there is a considerable degree of uncertainty in a visual assessment of thickness loss. The remaining thickness of a severely corroded element may be represented by an imprecise interval over which the uncertainty about the corrosion thickness is present. In this application, we only used the field data of corrosion location in the inspection report (2003). However, previous data of nondestructive test and corrosion states of cables are not included due to some limitation. Therefore, expert’s estimation is assumed by engineering judgment in this case. Let us assume that we have the information on the components as the following subjective judgments. (1) The average percentage loss of thickness at the point C, as shown in Figure 3, is at least two times more severe than the average percentage loss of thickness at the point E. (2) The average percentage loss of thickness at the point A, as shown in Figure 3, is less severe than
the 1.5 times of the average percentage loss of thickness at the point E. (3) The average percentage loss of thickness at the point A is more than 0.075. (4) The average percentage loss of thickness at the point C is less than 0.3. Thus, all the judgments can be formalized as follows: (1) (2) (3) (4)
G1 = X2 − 2X3 ≥ 0 G2 = 1.5X3 − X1 ≥ 0 G3 = X1 − 0.075 ≥ 0 G4 = 0.3 − X2 ≥ 0
where G is judgment function; X 1,2,3 is average percentage loss of thickness at the point A, C, and E, respectively. 5.3 Reliability analysis Cable-stayed bridges that consist of many cable elements, deck, and pylons are generally known to be highly redundant and have multiple potential failure modes (Bruneau, 1992). Then, the collapse of a bridge
Safety assessment using imprecise reliability for corrosion-damaged structures
K(2.82~4.08)
J(3.51~3.55)
L(2.60~4.16)
B(6.72)
M(2.33~3.31) I(6.77~6.81)
H(6.89~6.93) A(6.87~6.97)
297
C(6.87~7.23)
D(5.41)
E(6.98~7.28)
F(4.70~4.72)
G(6.72~6.76)
(a) Element Reliability Index (Level 1)
J(3.46~3.54)
K(2.50~3.90)
L(2.51~4.25) I(6.71~6.83)
H(6.87~6.93) A(6.88~7.00)
B(6.72)
C(6.87~7.17)
D(5.28~5.42)
E(6.97~7.27)
F(4.29~4.79)
G(6.70~7.08)
(b) Reliability Index (Level 2: Cable Fracture at M) Fig. 3. Results of system reliability analysis with corrosion.
occurs by taking multiple failure paths involving various intermediate damage or failure state after the initial failure. Therefore, the system failure can occur in more than one path according to multiple limit state failure modes; and consequently there can be several system failure modes as expressed Level 1, Level 2, etc. Level 1 of the system failure state of a cable-stayed bridge is defined as the initial failure mode. Level 2 is defined as a failure mode that assumes the most critical element. As results of G1–G4 equation, interval data of corrosion thickness are estimated. Similar to sensitivity analysis, every case of min and max of interval data of corrosion thickness is inputted to the structural analysis step. Then, structural analysis is performed several times with respect to interval data of corrosion thickness to find maximum or minimum strength such as bending moment, buckling moment, etc. Finally, interval results from structural analysis are estimated and reliability analysis using Monte Carlo simulation (MCS) with 10,000 samples each is performed according to the numerical values of random variables and the limit state functions. In this application, automated program for partial event tree analysis (ETA) model that automatically calculates the failure probabilities of the failure events and the occurrence probabilities of failure scenarios are made interfaced with structural analysis program MIDAS that is a common commercial software in Korea. To estimate the system failure probability of each event tree, the conditional failure probability including the prior failure events (Level 1, for example,
Cable M point is considered as virtually collapsed) is calculated for each failure state. In the system modeling, the system reliability problem for cable-stayed bridges may thus be formulated as a partial ETA model considering only dominant failure paths. It may also be noted that the load effects of each element are obtained from the linear elastic analysis of a three-dimensional Finite Element Method (FEM) model. In general, the system reliability at mixed level is expected to be higher than the element reliability (Tabsh and Nowak, 1991). 5.3.1 Limit state model. In particular, the study of structural safety is concerned with the violation of the ultimate or safety limit state for the structures. Because this study is concerned with the safety assessment, only the strength limit state is considered in this article. Moreover, for more realistic modeling, the code-specified nonlinear interaction limit state model is used for the combined load effects at the critical sections of pylons and stiffened girders of cable-stayed bridges. The linear strength limit state model at the element level as shown in Equation (5) is dominantly used for the axial force of cable tension (Cho et al., 1997). g(·) = PT R − (PT D + PTL)
(5)
where P TR is resistance of axial force; and P TD , P TL is tension of dead load and live load, respectively. For the combined axial and bending load effects at all critical sections of stiffened girders, the nonlinear interaction strength limit state equation may be expressed as follows (Cho et al., 1997):
298
Choi & Seo
Table 1 Numerical values of random variables
Resistance Load effects
Item
Nominal ratio
COV
Distribution type
Reference
FY Tower and deck E Elastic modulus Dead load Live load
1.10 1.08 1.05 1.24
0.12 0.10 0.10 0.25
Normal Normal Normal Log normal
Bruneau (1992) Bruneau (1992) Cho (1989) Cho (1989)
⎤
⎡ ⎢ PC D + PCL g(·) = 1.0 − ⎢ + Cm ⎣ PC R
Table 2 Element reliability indices of no corrosion and corrosion damage
⎥ MD + ML
⎥ PC D + PCL ⎦ MC R 1 − Pe (6)
where C m is modification factor; P e is Euler buckling load; P CR is axial buckling strength; M CR is ultimate bending strength; P CD , P CL are axial dead and live load effects, respectively; and M D , M L are bending moment due to dead load and live load, respectively. 5.3.2 Uncertainties. Some basic uncertainties of resistance and load effects of the structure taken from Cho and Ang (1989) and Bruneau (1992) are summarized in Table 1. The imposed loads and the resistance of the structures are treated in the work as random variables. These parameters themselves are the functions of several basic random variables such as material properties, section dimensions, etc. Because the applied load and resistance are random variables, the reduction in safety of corrosion-damaged structures can be expressed in terms of reliability. 5.4 The results of safety assessment using imprecise reliability In this study, the safety assessment of a cable-stayed bridge using imprecise reliability is performed based on the corrosion-damaged varying thickness model. The results of the safety assessment for the applied bridge based on the subjective judgment and the probability intervals described previously are presented in Table 2 and Figure 3. As shown in Table 2 and Figure 3, it can be expected that the back-stay cable at M point shows the lowest reliability bounds (β e = 2.33∼3.31). Based on these observations, it may be stated that the cable at M point governs the element reliability in this application. Moreover, the critical point using the partial ETA model at the Level 2 is point K after cable M is virtually collapsed. The results of the failure probability based on the system reliability assessment for the cable-stayed bridge are summarized in Table 3 and Figure 4. The system
Corrosion damage (Imprecise reliability) No corrosion Point A B C D E F G H I J K L M
Level 1
Level 2
Level 1
Level 2
Lower
Upper
Lower
Upper
6.97 6.72 7.23 5.41 7.28 4.70 6.76 6.89 6.77 3.51 4.22 4.40 3.42
6.88 6.72 7.17 5.28 7.27 4.30 7.09 6.87 6.83 3.46 4.10 4.56 -
6.87 6.72 6.87 5.41 6.98 4.70 6.72 6.89 6.77 3.51 2.82 2.60 2.33
6.97 6.72 7.23 5.41 7.28 4.72 6.76 6.93 6.81 3.55 4.08 4.16 3.31
6.88 6.72 6.87 5.28 6.97 4.29 6.70 6.87 6.71 3.46 2.50 2.51 -
7.00 6.72 7.17 5.42 7.27 4.79 7.08 6.93 6.83 3.54 3.90 4.25 -
Table 3 Summarized results of no corrosion and corrosion damage No corrosion System failure probability System reliability index
7.99 × 10⁻⁸ 5.24
Corrosion damage (Imprecise reliability) 6.27× 10⁻⁵ ∼ 2.18× 10⁻⁸ 3.84∼5.48
reliability index and failure probability in series as shown in Table 1 were obtained by the Ditlevsen second-order bound (Ang and Tang, 1984) based on element reliability indices of deck, pylon, and cable (maximum critical value at each level). It can be clearly observed that the difference exists between the results of system reliability with no corrosion (7.99 × 10⁻⁸ ) and with corrosion (6.27× 10⁻⁵ ∼ 2.18× 10⁻⁸ ). These results indicate that the imprecise reliability may be used as an alternative rational method in case where the precise information such as corrosion is not available because of the limited data or inevitable situation, etc. In fact, the
Safety assessment using imprecise reliability for corrosion-damaged structures
Hinge at A Pf = 3.22E-12~1.60E-12
Pf = 3.22E-12~1.60E-12
Hinge at B Pf = 9.14E-12
Pf = 9.14E-12
Hinge at C
Pf = 3.13E-12~2.51E-13
Pf = 3.13E-12~2.51E-13 Hinge at D Pf = 3.16E-8
Governing Failure Path
299
Pf = 3.16E-8 Hinge at A Pf = 1.28E-12~3.02E-12
Cable fracture at M
Hinge at B
Pf = 1.00E-2~4.58E-4
Pf = 9.14E-12 Cable fracture at J Pf = 2.00E-4~2.71E-4
Pf = 1.28E-14~1.39E-15
Pf = 9.16E-14~4.19E-15
Pf = 2.00E-6~1.24E-7
Cable fracture at K Pf = 6.25E-3~4.76E-5
Pf = 6.27E-5~2.18E-8
Cable fracture at L Pf = 6.11E-3~1.05E-5
Pf = 6.13E-5~4.85E-9
Hinge at C Pf = 3.16E-12~3.86E-13
Pf = 3.17E-14~1.77E-17
Cable fracture at K Pf = 2.40E-3~2.26E-5 Cable fracture at L Pf = 4.71E-3~1.57E-5
Pf = 2.40E-3~2.26E-5
Pf = 4.71E-3~1.57E-5
Fig. 4. Results of partial event tree for system reliability analysis.
level of uncertainty about the structural performance increases due to inherent uncertainty of the deterioration process. Therefore, in many of practical situations, we can hardly expect precise reliability assessments of a specific structure because it is difficult to obtain precise data. As described in the imprecise reliability example, the resulting range of imprecise reliability assessment is relatively wide. 5.5 Sensitivity of imprecise reliability For the sensitivity study, a simple H-type steel beam model is used, and its material type and the section type are SM400 (tension strength is 400/mm2 ) and H 800(h) × 300(b) × 14(t1)/26(t2) (m/m), unit weight 210 Kg/m, respectively. For reliability analysis, it is designed as simple beam with 10 m span, 10 tones force load at center, and support condition is also designed as common. Corrosion damage of a beam is modeled as the percentage thickness loss, that is, thickness of flanges and
Fig. 5. Reliability index decreased as 5% loss model.
web is decreased as 5% loss model such as 100%, 95%, 90%, 85%, and 80% of the actual size. As shown in Figure 5, if it is assumed that the thickness of flanges and web is corroded as random variables of a normal distribution with mean of 5∼15%, and coefficient of variation (COV) is assumed as 0.1, according to its thickness
300
Choi & Seo
Table 4 Risk-acceptance criteria using reliability index (JCSS, 2001) Consequence cost High Normal Low
Minor consequences of failure
Moderate consequences of failure
Large consequences of failure
ß = 2.3(P f = 10−2 ) ß = 3.1(P f = 10−3 ) ß = 3.7(P f = 10−4 )
ß = 3.1(P f = 10−3 ) ß = 3.7(P f = 10−4 ) ß = 4.3(P f = 10−5 )
ß = 3.7(P f = 10−4 ) ß = 4.3(P f = 10−5 ) ß = 4.7(P f = 10−6 )
loss, then the range of reliability index is 3.58 < β < 4.72 (1.718× 10−04 < P f < 1.181× 10−06 ). In the conventional point-estimate reliability, only one value of corrosion-thickness loss is estimated from visual inspection. For example, it is roughly estimated through the visual inspection that the thickness of flanges and web of simple H-type steel beam is corroded as much as 10% due to a limited time and few historic data. As it cannot be assured without an exact NDT investigation of member, it certainty must be somewhat doubtful. In this case, in the conventional reliability method, the varied COVs are often used for considering the uncertainty degree and for sensitivity studies. However, it is noted that reliability indices are too sensitive according to the varied COVs. For example, if it is assumed that the thickness of flanges and web is corroded as 10% with normal distribution type, then considering 0.1 < COV < 0.4 for uncertainty, the range of reliability index is varied within the range of 1.14 < β < 4.17 (1.271× 10−01 < P f < 1.524× 10−05 ). As a result, it is difficult to accept the reliability index that is too sensitive to the uncertainty degree considered based on the varied COVs. Moreover, it is almost impossible to exactly estimate the remaining thickness in the field investigation within a limited time. Consequently, in the case of the greater degree of uncertainty such as corrosion, imprecise interval reliability can be practically applied while maintaining the appropriate safety.
5.6 Safety-management strategy A risk-acceptance criterion has been used as a guideline for making decisions with regard to the risks to be accepted or not. In Table 4, the target failure probabilities and the corresponding target reliability indices are given for the ultimate limit states, respectively, based on the recommendations of JCSS (2001). Note that the use of the target reliability indices recommended by JCSS (2001) in the article is not justified. However, as a riskacceptance criterion, we do not have any other guideline for making decisions considering site-to-site variability yet. Thus, this guidance will be upgraded as a future study. In this corrosion-damaged cable-stayed bridge application, the cost of the safety measure would be
considered as “normal” and the consequence of the failure would be “large” because of the bridge’s scale. Therefore, the target reliability index for safety is 4.3 as shown in Table 4. Because the range of the system reliability index calculated in this application is 3.84∼5.48 as shown in Table 3, the result of the system reliability analysis with corrosion belongs to “as low as reasonably practicable (ALARP)” among three Criteria (Intolerable, ALARP, Negligible) of JCSS (2001). If the majority of the safety is within the ALARP region, it means that the risk needs to be reduced after a costbenefit analysis is performed (JCSS, 2001). In contrast, the risks within the intolerable region are the risks that need to be reduced for sure. Thus, this assessment indicates that the bridge has a safety level that is slightly lower than the risk-acceptance criteria, and it could require a maintenance and/or rehabilitation following a cost-benefit analysis. That is, NDT inspection and more precise analysis following a cost-benefit analysis should be performed for reliability updating because these results need a more precise reliability index. Then, maintenance and/or rehabilitation action is decided with respect to a more precise reliability index.
6 CONCLUSION This study is to propose a methodology and a procedure of safety assessment using imprecise reliability for corrosion-damaged structures. The suggested procedure could be effectively used when the data for safety analysis are insufficient or when a decision for safety management is urgently required in hazardous environments such as typhoon or where data collection for deterioration is very difficult. The proposed safety assessment procedure is also applied to a cable-stayed bridge in Korea to demonstrate its effectiveness and applicability. Based on the results from the application of the imprecise reliability of corroded elements to the safety assessment of a cable-stayed bridge, the main observations and findings of this study can be summarized as follows: (1) Because it is almost impossible to exactly estimate the remaining thickness in the field investigation
Safety assessment using imprecise reliability for corrosion-damaged structures
(2)
(3)
(4)
(5)
within a limited time, in the case of the greater degree of uncertainty such as corrosion, imprecise interval reliability can be practically applied while maintaining the appropriate safety. The system reliability-based safety assessment may then be performed approximately but rationally by simply converting the qualitative expert’s estimation to quantitative terms in this proposed procedure. As described in the imprecise reliability example, the resulting range of imprecise reliability assessment is relatively wide. However, it is observed that the interval of conventional reliability is included in the interval of imprecise reliability. That is, although the interval of imprecise reliability is relatively wide, it may be stated that the results of imprecise reliability analysis is rational and reasonable. The application presented in this study shows that the results of system reliability analysis with corrosion indicate that the bridge considered has a safety level that is slightly lower than the riskacceptance criteria, meaning that the bridge needs to be strengthened or replaced after an economic analysis. In our opinion, results of imprecise probabilities could be more rational and reasonable than that of conventional probabilities although the uncertainty still remains in imprecise reliability. REFERENCES
AASHTO. (1998), Standard Specifications for Highway Bridges, Washington, D.C. Adeli, H. & Zhang, J. (1995), Fully nonlinear analysis of composite girder cable-stayed bridges, Computers and Structures, 54(2), 267–77.
301
Ang, A. H.-S. & Tang, W. H. (1984), Probabilistic Concepts in Engineering Planning and Design, vol. 1 & 2, John Wiley & Sons Inc., New York. Bruneau, M. (1992), Evaluation of system-reliability methods for cable-stayed bridge design, Journal of Structural Engineering, ASCE, 118(4), 1106–120. Cho, H. N. & Ang, A. H.-S. (1989), Reliability assessment and reliability-based rating of existing road bridges, in Proceedings of the 5th International Conference on Structural Safety and Reliability (ICOSSAR ’89), San Francisco, CA, pp. 2235–38. Cho, H. N., Lim, J. K. & Park, K. H. (1997), System reliability and system reliability-based carrying capacity evaluation of long span bridges, in Proceedings of the 7th International Conference on Structural Safety and Reliability (ICOSSAR’97), pp. 1927–34, Kyoto, Japan. Farhey, D. N., Thakur, A. M., Buchanan, R. C., Aktan, A. E. & Jayaraman, N. (1997), Structural deterioration assessment for steel bridges, Journal of Bridge Engineering, 2(3), 116–24. Fisher, J. W. (1996), Assessing damage and reliability of steel bridges, Boase Lecture in Structural Engineering, University of Colorado at Boulder. JCSS. (2001), Probabilistic model code, The Joint Committee on Structural Safety. Kim, H. & Adeli, H. (2005), Wavelet hybrid feedback-LMS algorithm for robust control of cable-stayed bridges, Journal of Bridge Engineering, ASCE, 10(2), 116–23. Kozine, I. O. & Filimonv, Y. V. (2000), Imprecise reliabilities: Experiences and advances, Reliability Engineering & System Safety, 67, 75–83. Nowak, A. S. & Yamani, A. S. (1995), A reliability analysis for girder bridges, Structural Engineering, Elsevier, 7(3), 251– 56. Rackwitz, R. & Fiessler, B. (1978), Structural reliability under combined random load sequences, Computers and Structures, Pergamon Press, 9, 489–94. Sarveswaran, V., Smith, J. W. & Blockley, D. I. (1998), Reliability of corrosion-damaged steel structures using interval probability theory, Structural Safety, 20, 237– 55. Tabsh, S. W. & Nowak, A. S. (1991), Reliability of highway girder bridge, Journal of Structural Engineering, ASCE, 117(8), 2372–88.