5/F Sigma Center, No.49 Zhichun Road, P.R. China 100080. {xingx .... compactness. If Sizeconvexhull < 80% of the feature map area, we call it a Non-.
Salient Region Detection using Weighted Feature Maps based on the Human Visual Attention Model Yiqun Hu2? , Xing Xie1 , Wei-Ying Ma1 , Liang-Tien Chia2 and Deepu Rajan2 1
Microsoft Research Asia 5/F Sigma Center, No.49 Zhichun Road, P.R. China 100080 {xingx, wyma}@microsoft.com 2 Center for Multimedia and Network Technology School of Computer Engineering Nanyang Technological University, Singapore 639798 {p030070, asltchia, asdrajan}@ntu.edu.sg
Abstract. Detection of salient regions in images is useful for object based image retrieval and browsing applications. This task can be done using methods based on the human visual attention model [1], where feature maps corresponding to color, intensity and orientation capture the corresponding salient regions. In this paper, we propose a strategy for combining the salient regions from the individual feature maps based on a new Composite Saliency Indicator (CSI) which measures the contribution of each feature map to saliency. The method also carries out a dynamic weighting of individual feature maps. The experiment results indicate that this combination strategy reflects the salient regions in an image more accurately.
Keywords: Salient Region Detection, Visual Attention Model, Feature Combination Strategy
1
Introduction
Visual attention analysis is generally an effective mechanism for salient region detection which is useful for region/object based image processing such as region/object based image indexing, matching, retrieval and so on. There are several computational visual attention models for simulating human visual attention [1–3]. Two of the most effective models are described in [1] and [2]. The model in [1] is adept in its biological plausibility where three low-level features (color, intensity and orientation) are considered. The model in [2] is attractive for its simplicity since only color contrast in LUV space is considered. It is observed that in some cases, using only one feature as in [2] yields salient regions ?
This work was performed when the first author was a visiting student at Microsoft Research Asia
that are similar to, if not better than in [1]. This phenomenon indicates that more number of features will not necessarily enhance saliency detection. Hence, there is a need for evolving strategies to decide features that are useful and to dynamically combine them. In [4], Itti et al. compare four different feature combination strategies. Among the four strategies, the method of linear combination with learned weights is a supervised learning method which requires a prior knowledge about the salient region of the training images. Another iterative non-linear local competition strategy is proposed to overcome the defects of global non-linear normalization method. But these methods do not achieve satisfatory performance across different images because all features are given positive weights even if they may erode saliency. On the other hand, Ma and Zhang [2] consider the contrast of one fixed feature (color) for computational simplicity, but it may not be robust for the cases where color is not the most useful feature to detect saliency. A similar idea about selecting useful feature(s) for saliency is introduced in [5] where the authors select the feature map which contributes most to the strongest point in saliency map as the winning map. However, considering only the contribution to the strongest point cannot indicate the contribution to the whole region. Moreover, the combination of the feature maps could also result in an erroneous strongest point resulting in an erroneous selection of the feature map as the winning map. In this paper, we present an algorithm that uses an indicator, which we call the Composite Saliency Indicator (CSI) to measure the contribution of each feature to the saliency map. Furthermore, we present a dynamic combination strategy to finally detect the salient regions in an image. CSI takes into account the feasibility of using a certain feature map and determines the weights to be associated with each feature map that is selected to yield the saliency map. Our requirement is to locate the salient region more accurately and compactly for our subsequent object extraction combining salient region and edge information [6]. The rest of this paper is organized as follows. In Section 2, the principle of Composite Saliency Indicator (CSI) is introduced. New feature combination strategy according to CSI is outlined in Section 3. Section 4 illustrates experiment evaluation compared with the combination methods of Itti et al. [4]. Finally the conclusion and discussion are listed in Section 5.
2
Composite Saliency Indicator
We follow the model in [1] to generate the three feature maps corresponding to color, intensity and orientation. Each feature map contributes saliency differently. If strong salient points occur in a small area compared to the total size of the image, the saliency in this area can be said to be compact and distinct. An indicator called the Composite Saliency Indicator (CSI) is used to measure the contribution of each feature map to the salient region. The measure consists of two factors - Spatial Compactness and Saliency Density. In the following subsections we describe these in more detail.
2.1
Salient Point Selection
The first step is to detect the salient points. This is obtained by simply thresholding the color, intensity and orientation maps. The value of the threshold is decided by histogram entropy thresholding analysis [7]. Accordingly, the threshold is obtained by maximizing l0 = arg max(−
l X
pµ
log Pl
pµ
−
L X
pµ Pl
2.2
µ=1
v=1
pv
v=1
pv
µ=l+1
1−
v=1
pv
log
pµ Pl
)) pv (1) where pi is the number of pixels with intensity i, L is the total number of gray levels and l is the threshold. The salient point set is defined as the set of pixels whose value is above the threshold. l
Pl
1−
v=1
Spatial Compactness
The spatial compactness of salient point set indicates the conspicuousness of potential salient region. In our work, we use convex hull to measure spatial compactness of salient point set. The procedure consists of two steps: 1. Compute convex hull polygon of salient point set using ”Gift Wrapping” algorithm [8]. The algorithm begins by locating the lowest-rightmost point and then finds the point that has the smallest positive angle (with respect to the horizontal axis). A hull edge is found that joins these two points. The algorithm then proceeds to find the point with the smallest angle from this established hull edge in a counterclockwise sense. The process continues until the lowest-rightmost point is again reached. 2. Calculate the area of the polygon using the trapezoid method. We first identify the left-most vertex A of the polygon and then rearrange the vertices starting from A in a clockwise sense. The area is calculated as, Sizeconvexhull =
K+1 X k=1
(yk+1 + yk ) × (xk+1 − xk ) 2
(2)
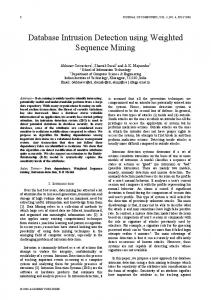
where (xi , yi ) are co-ordinates of the vertex and K is the total number of vertices in the convex hull. Figure 1 is an example of convex hull calculation. For the images with multiple salient regions, the above procedure can be applied to each connected salient point subset and summed up over all convex hulls to get a measure of spatial compactness. 2.3
Saliency Density
The second part of the CSI is the saliency density. The saliency is indicated by the gray-level value of the points. Spatial compactness only considers the spatial
(a)
(b)
(c)
(d)
Fig. 1. Example of Spatial Compactness Measure using Convex Hull; (a) Original Image; (b) Intensity Feature Map; (c) Salient Point Set; (d) Convex Hull
relationship of salient points. Two salient point sets with the same spatial compactness can have different effects for salient region indication. The feature map with strong saliency density in one or few specific areas is better for extracting salient region. We calculate saliency density as P |I(p)−I(q)| P q∈θn (p) Dsaliency =
p∈θ
|θn (p)|
|θ|
(3)
Where I(x) is the intensity of the feature map at location x, θn (p) is the set of all neighboring salient points of p and θ is the set of salient points. If all salient points with similar saliency value are close to each other, Dsaliency will give a small value indicating that the saliency of this map is conspicuous. A large value of Dsaliency implies inconspicuity of saliency. Note that the saliency density is measured using intensity values from the feature map but only for those locations in the salient point set.
3
Feature Combination Strategy
Based on the saliency measure Sizeconvexhull and Dsaliency , a two level feature combination strategy is designed for feature map combination. The advantage of the proposed combination strategy lies in that it dynamically decides whether a feature will be selected, and if so, what will be its weight. The result of such a combination strategy is to effectively remove regions that are not parts of the salient region as determined by the human visual system. Compared to the color contrast model of [2], the method proposed here is more flexible because our method allows proper selection of one or more feature maps. Moreover, in comparison to the combination strategy of [4], the detected salient regions are more accurate vis-a-vis the human visual system. The feature maps are first classified into two categories according to its spatial compactness. If Sizeconvexhull < 80% of the feature map area, we call it a Nonuniform Map, else it is called a Uniform Map. In a uniform map, the saliency is not sparse implying that it does not contain much useful information with regard to human visual attention; hence, a uniform map is not considered while determining the saliency map. Among non-uniform feature maps, the feature map with smallest Sizeconvexhull is selected as the Reference Map (RM). Then the
similarity between each non-uniform map and the Reference Map is examined. The similarity measure used is dp (fi , fj ) = (
M X N X
|fi (m, n) − fj (m, n)|p )1/p
(4)
m=1 n=1
where fi and fj are the M × N feature maps and p = 2 for Euclidean distance. The projection vectors are used to reduce the dimension of the feature space. c They are denoted by lnr and lm for the nth row and mth column, respectively, PM PN r c i.e., ln (f ) = m=1 f (m, n) and lm (f ) = n=1 f (m, n). Substituting these in equation (4), we get dˆp (fi , fj ) = (
M N X X 1 1 c 1 c | (lm (fi ) − lm (fj ))|p ) p | (lnr (fi ) − lnr (fj ))|p + M N m=1 n=1
(5)
Based on this similarity measure, non-uniform maps are further divided into two categories - if dˆp (fi , fRM ) < Tt , where Tt is a threshold, then we call the non-uniform map as Related Map, else it is called an Unrelated Map. Unrelated maps are ignored in the combination. In the second level, the related maps are linearly combined with the reference map. The weighting coefficients are calculated according to spatial compactness and saliency density according to X (Sizeconvexhull (p) × Dsaliency (p)) (6) Wtotal = p∈Φ
Wi = q P
Wtotal Sizeconvexhull (i)×Dsaliency (i) Wtotal 2 p∈Φ ( Sizeconvexhull (p)×Dsaliency (p) )
(7)
where φ is the set of all Related Maps. Table 1. Rules for Feature Map Combination Index Concept Condition 1 Uniform Map Sizeconvexhull > 80% of map area 2 Reference Map min Sizeconvexhull 3 Related Map dˆp (fi , fRM ) < Tt ˆ 4 Unrelated Map dp (fi , fRM ) >= Tt
Combination Strategy Skip during combination Weighted combination Weighted combination Skip during combination
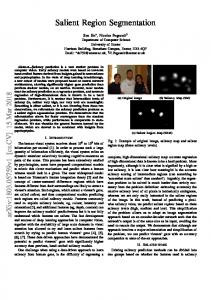
Table 1 summarizes the rules of the proposed feature combination strategy. Figure 2 compares the result of the combination strategy proposed in this paper with that in [1]. Since the salient point sets corresponding to the orientation map and the intensity map do not satisfy the saliency rules, they are ignored. As a
Original Image
Original Image
Color Map
Orientation Map
Intensity Map
Salient Point Set
Salient Point Set
Salient Point Set
Convex Hull
Convex Hull
Color Map
Convex Hull
Orientation Map
Intensity Map
Global Non-linear Combination Saliency Map
Saliency Map
(a)
(b)
Fig. 2. Comparison of (a) the proposed combination strategy using CSI with that of (b) non-linear combination [1].
result, We see that the detected salient region is more compact and closer to the human visual system using the method described in this paper. The dynamic weighting scheme of the proposed strategy is illustrated in Figure 3. Notice that the weights are chosen according to the Related Map and the Reference Map for each individual image and they adapt themselves to each image. After combining all related feature maps and generating a global saliency map, any region extraction methods can be used to extract salient region such as Seeded Region Growing [9]. In this paper, for the purpose of comparison of different combination strategies, we first scan the image to find different regions. For each region, extraction method using convex hull polygon of salient points is applied on the combined saliency map to compare the performance of each combination strategy on all regions.
4
Experiments and Evaluation
We use 600 images randomly selected from the standard Corel Photo Library as the test data set to evaluate the performance of the proposed feature combination strategy. Figure 4 shows several examples of the experiment. Notice that the saliency map obtained using the proposed CSI reflects the salient regions more
Color Map
Uniform Map Wc=0
Intensity Map Orientation Map
Reference Map Wi=0.7535 Related Map Wo=0.6574
(a) Intensity Map is RM. Color Map is ignored
Color Map
Reference Map Wc=1
Intensity Map Orientation Map
Uniform Map Wi=0 Uniform Map Wo=0
(c) Color Map is RM. Intensity Map and Orientation Map are both ignored
Color Map
Intensity Map Orientation Map
Related Map Wi=0.6705
Uniform Map Wc=0
Reference Map Wo=0.7419
(b) Orientation Map is RM. Color Map is ignored
Color Map
Intensity Map Orientation Map
Related Map Wc=0.5978
Uniform Map Wi=0
Reference Map Wo=0.8013
(d) Orientation Map is RM. Intensity Map is ignored
Fig. 3. Dynamic Combination Strategy
accurately than that obtained by the non-linear combination method of [1]. As a result, the cropped image is more compact and is able to isolate the object that captures the visual attention. Our method is also able to successfully capture more than one salient region as shown in the last row of Figure 4. Due to the subjective nature of the problem, a user study was conducted to evaluate the results of the experiment. Six subjects are invited to each view any 40 of the 600 images. The subjects were asked if the cropped regions reflected the human visual attention region of the image for the proposed method as well as for the the method of [1]. Table 2 shows the result of the user study. The proposed combination strategy using CSI outperforms the non-linear combination strategy in more than 50% of the cases. About 35% of the responses indicate that both the strategies are equally good. However, about 10% of the responses suggest that the output of the non-linear combination strategy was better. This can be attributed
(a)
(b)
(c)
(d)
(e)
Fig. 4. (a) Original Image; (b) Saliency Map using Itti et al’s model [4]; (c) Cropped Image using Itti et al’s model [4]; (d) Saliency Map using CSI; (e) Cropped Image using CSI.
to the incorrect threshold values selected from the entropy thresholding model discussed in Section 2.1. We point out that if any one of the feature maps shows a salient region clearly, we get a better result of the cropped image using CSI. However, if none of the feature maps shows a distinct salient region, the result is no worse than the non-linear combination strategy.
5
Conclusion and Discussion
In this paper, we propose a method to identify useful feature maps that capture salient regions based on the human visual attention model. We then present a method to dynamically weight each of the selected feature maps to locate salient regions in an image. Compared to existing feature combination strategies, it improves the accuracy of salient region detection. The improvement of proposed feature combination strategy according to the new proposed measure of CSI is useful in subsequent processing such as object extraction. Such object extraction methods can then be used for image retrieval and browsing [6].
References 1. Itti, L., Koch, C., Niebur, E.: A model of saliency-based visual attention for rapid scene analysis. IEEE Transactions on Pattern Analysis and Machine Intelligence 20 (1998) 1254–1259
Table 2. User Study Result Evaluation User CSI Better Non-linear combination Better Both Equally Good 1 55.0% 10.0% 35.0% 2 57.5% 10.0% 32.5% 3 45.0% 17.5% 37.5% 4 57.5% 7.5% 35.0% 5 57.5% 10.0% 32.5% 6 52.5% 7.5% 40.0% Average 54.2% 10.4% 35.4%
2. Ma, Y.F., Zhang, H.J.: Contrast-based image attention analysis by using fuzzy growing. In: Proceedings of the eleventh ACM international conference on Multimedia. Volume 1. (2003) 374–381 3. Kadir, T., Brady, M.: Saliency, scale and image description. International Journal of Computer Vision 45 (2001) 83–105 4. Itti, L., Koch, C.: A comparison of feature combination strategies for saliency-based visual attention systems. In: Proc. SPIE Human Vision and Electronic Imaging IV (HVEI’99), San Jose, CA. Volume 3644. (1999) 473–482 5. Walther, D., Itti, L., Riesenhuber, M., Poggio, T., Koch, C.: Attentional selection for object recognition - a gentle way. Lecture Notes in Computer Science 25 (2002) 472–279 6. Hu, Y., Xie, X., Ma, W.Y., Rajan, D., Chia, L.T.: Salient object extraction combining visual attention and edge information. Technical Report (2004) 7. Wong, A., Sahoo, P.: A gray-level threshold selection method based on maximum entropy principle. IEEE Transactions on Systems, Man, and Cybernetics (1989) 866–871 8. Sugihara, K.: Robust gift wrapping for the three-dimensional convex hull. J. Comput. Syst. Sci. 49 (1994) 391–407 9. Adams, R., Bischof, L.: Seeded region growing. IEEE Transactions on Pattern Analysis and Machine Intelligence 16 (1994) 641–647