SAMPLING ERRORS OF TIPPING-BUCKET RAIN GAUGE MEASUREMENTS By Emad Habib,1 Witold F. Krajewski,2 and Anton Kruger3 ABSTRACT: In this study we investigated sampling-related errors of tipping-bucket (TB) rain gauge measurements, focusing on the gauge’s ability to represent the small-scale rainfall temporal variability. We employed a simple TB simulator that used ultra-high-resolution measurements from an experimental optical rain gauge. The simulated observations were used to provide TB rain rate estimates on time scales as low as one minute. The simulation results showed that the TB estimates suffer from significant errors if based on time scales less than 10 to 15 minutes. We provide the approximate formulas used to characterize the TB sampling errors at several time scales. Our results show the importance of using fine resolution of both the sampling time interval and the bucket size so that the TB rain rate estimates have minimum levels of uncertainty.
INTRODUCTION Rainfall measurements play a key role in many climatological and hydrological applications. Despite recent advances in the use of remote sensing, rain gauge observations are still required for operational and calibration purposes. For urban hydrology applications, rain gauge data represent the main input to the rainfall-runoff simulation models. Uncertainties of recorded data on rainfall intensity and duration have a significant effect on the design and analysis of urban drainage systems (Schilling 1991; Zhu and Schilling 1996). Rain gauge observations are also used to calibrate radar rainfall estimation algorithms (Anagnostou and Krajewski 1998, 1999a,b). A fundamental problem associated with radar rainfall estimation is the use of imperfect rain gauge measurements to adjust and validate the radar observations. Comparisons of the two sensors—radars and rain gauges—cannot be made without understanding the sampling properties of the rain gauge and its associated measurement errors (Ciach and Krajewski 1999). Several types of rain gauges have been developed such as weighing gauges, capacitance gauges, tipping-bucket (TB) gauges, optical gauges, disdrometers, underwater acoustic sensors, and others. However, TB rain gauges are often used for ground-based rainfall measurements by agencies such as the National Weather Service, the U.S. Geological Survey, and the U.S. Forest Service (Humphrey et al. 1997). TBs are widely used in urban hydrology to provide rainfall depths and frequencies. Flash flood observing systems use TB gauges, among other tools, to provide emergency management agencies and local communities with necessary warnings. Effectiveness of agronomic management practices in terms of reduced runoff and soil erosion are assessed using TB synchronous data on rainfall and runoff rates (Yu et al. 1997). TB data provide rain rate statistics for assessment of slant path attenuation models used in earth-satellite communications (Goldhirsh et al. 1992). TB gauges are also used in rainfall processing of products from Next Generation Weather Radar (NEXRAD) radar systems (Young et al. 1999). Recently, TB networks around the globe have been deployed to provide 1 Grad. Res. Asst., Iowa Inst. of Hydr. Res., The Univ. of Iowa, Iowa City, IA 52242. 2 Prof., Iowa Inst. of Hydr. Res., The Univ. of Iowa, Iowa City, IA (corresponding author). E-mail:
[email protected]. 3 Asst. Res. Engr., Iowa Inst. of Hydr. Res., The Univ. of Iowa, Iowa City, IA. Note. Discussion open until September 1, 2001. To extend the closing date one month, a written request must be filed with the ASCE Manager of Journals. The manuscript for this paper was submitted for review and possible publication on June 14, 1999; revised April 4, 2000. This paper is part of the Journal of Hydrologic Engineering, Vol. 6, No. 2, March/ April, 2001. 䉷ASCE, ISSN 1084-0699/01/0002-0159–0166/$8.00 ⫹ $.50 per page. Paper No. 21235.
ground validation products for the Tropical Rainfall Measuring Mission (TRMM) satellite (Simpson et al. 1988). The wide use of data from TB gauges indicates the importance of understanding their measurement errors and their ability to capture the complex structure of the rainfall process. Several studies showed that TB gauge data are corrupted by errors, both random and systematic (Sevruk and Lapin 1993). The systematic error is the most significant source of error and includes losses due to wind, wetting, evaporation, and splashing. The wind-induced error, which is the largest component, has been extensively investigated using different methodologies ranging from field intercomparisons [e.g. Sevruk and Hamon (1984)] to the use of numerical simulation of the airflow around the gauge body [e.g. (Nesˇpor and Sevruk 1999)]. Another significant source of TB error is due to the nonconformance of the bucket size with the constant calibration volume specified by the manufacturer. Niemczynowicz (1986) and Humphrey et al. (1997) recommended a dynamic calibration to account for the nonlinear behavior of the gauge, especially at the high rain rates. TB gauges also suffer from mechanical and electrical problems, as they may occasionally fail to tip during an event. The failure may be caused by partial or complete clogging of the funnel that drains into the bucket, data transmission interruption, or temporary power failure. Such errors are unpredictable and some attempts have been made to develop on-line detection and data quality techniques (Giuliani et al. 1997). To help detect malfunctioning instruments, Krajewski et al. (1998) and Ciach and Krajewski (1999) advocate the use of dual gauges side by side. Most of the errors we discussed so far can be either accounted for or removed with a certain degree of accuracy from the rain gauge observations. However, another source of error that has not been addressed as extensively as the others is the sampling mechanism of the TB gauge. The operational principle of the TB is rather simple: falling rain is collected into a fixed-size bucket that tips and drains when it gets full. Recording the number of tips along with information about their time of occurrence can be used to estimate rainfall accumulations and rates. Various recording strategies are followed to collect the TB data. One may record the number of tips that occur during a prespecified period of time (e.g., number of tips every minute). Alternatively, the time each tip occurs can be recorded with a certain time resolution (e.g., the recording device checks every 2 s whether the bucket has tipped). The bucket size and how frequently the recording device samples determines the accuracy of the TB gauge. Transforming the time-recorded number of tips into rainfall intensities can be made on different time scales to provide rainfall data products for numerous applications. The uncertainties associated with the different recording scenarios, and the chosen time scale of the final products of the TB gauges need to be investigated. JOURNAL OF HYDROLOGIC ENGINEERING / MARCH/APRIL 2001 / 159
The literature records only a few attempts to investigate such uncertainties. Fankhauser (1997) studied the effect of the rainfall data recording scheme. He focused on the impact of the TB uncertainties on the rainfall-runoff simulation, and said little about the statistical behavior of the TB sampling error. Nystuen (1998) studied the temporal sampling requirements for automatic rain gauge recordings. Due to power limitations at remote locations (e.g., ocean buoys) Nystuen (1998) addressed the feasibility and the consequences of using fractional duty cycles strategy for rainfall recordings. In a comparison study of six different types of automatic rain gauge systems, Nystuen and Proni (1996) indicated that the TB gauge has a relatively poor precision especially at small time scales. Steiner (1996) investigated the uncertainty of the estimated mean areal rainfall introduced by decreasing the sampling resolution. Goldhirsh et al. (1992) discussed the inability of the TB measurements to provide accurate knowledge of the rain rate distributions at the lower rain rates. Yet, no attempt was made to characterize such inaccuracy. Sadler and Busscher (1989) reported on the determination of high-intensity rain rate from TB data where counts of tips in 1-min interval were used. Yu et al. (1997) investigated the sampling errors of TB measurements due to the discrete nature of the sampling mechanism. However, their analysis was based on a hypothetical constant rainfall intensity. The present work aims at understanding the ability of the TB gauge to represent rainfall characteristics, such as intensity, especially at small time scales on the order of a few minutes. We also attempt to introduce a statistical characterization of the behavior of the TB gauge error that is caused by its sampling mechanism. In this study, a simple TB simulator is used to assess the sampling efficiency of the gauge. The input to the simulator is experimental rainfall time series data recorded by an optical gauge with ultra-high sampling resolution. This paper is organized in the following manner. First, we describe the experimental rainfall time series that were used as input to the simulations. Then, we present the simulator used to mimic the TB recordings. Next, errors obtained under different recording scenarios and with different time scales are statistically analyzed. We also introduce approximate formulas that help to quantify the TB sampling errors. We close with conclusions and recommendations.
with a standard deviation in the range of 1 mm/h to 45 mm/ h. The maximum recorded 1-min rain rate reached a high of about 200 mm/h, with most events in the range of a few millimeters up to 100 mm/h. The duration of most storms was in the order of a few hours, with a frequency of occurrence between a few days and a few weeks. Analysis of the experimental data showed that the storms are characterized by significant temporal variability and intermittency. SIMULATION OF TIPPING-BUCKET RECORDINGS In the present study we use a simple simulator to produce the TB recordings. The input to the simulator is the data set from the ORG rainfall recordings described above. A careful inspection of the ORG data was conducted to remove any possible outliers. Despite its own inherent errors, we consider the ORG observations as ‘‘true’’ measurements. For simulation purposes, the high-resolution temporal sampling of the ORG is more crucial than its absolute accuracy. We considered the ORG measurements as reference data against which we evaluated the accuracy of the TB. Based on the ORG high resolution rainfall rate R, the simulator works in such a way that it records the number of tips, N, that would happen during a specified sampling time period
冘
⌬T/⌬t
N(⌬T ) =
R(⌬t)i(⌬t)i
i=1
⌬V
(1)
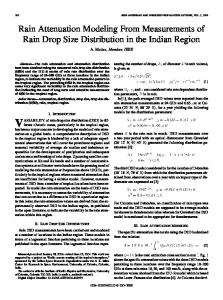
EXPERIMENTAL DATA The Iowa Institute of Hydraulic Research at the University of Iowa has operated a unique, ultra-high-resolution surface meteorological station for more than five years (Georgakakos et al. 1994; Krajewski et al. 1998). The station consists of several colocated instruments, namely, a TB rain gauge with a 0.254-mm (0.01-in.) resolution, optical rain gauge (ORG), hygrometer, temperature sensor, wind speed and direction sensors, and barometric pressure sensor, among others. The outputs from all these sensors are continuously sampled and archived every 2 s. The high-temporal-resolution recordings of the ORG make it possible to simulate the observations of the TB at different time and volume resolutions. Recordings of the ORG rainfall rate for the summer months of 1996, 1997, and 1998 were used in the study. Within the three-year summer months, more than 100 events were recorded. Fig. 1 shows a frequency distribution of the 1-min rain rates computed from the entire data set of the high-resolution ORG recordings. The statistics of the recorded storms indicated that they are mostly dominated by intense convective systems. The total rainfall per storm ranged from a few millimeters up to about 60 mm. Some extreme events were also observed where the total accumulation reached over 250 mm in 24 h. The storm average of 1-min rain rate ranged from less than 1 mm/h up to about 24 mm/h, 160 / JOURNAL OF HYDROLOGIC ENGINEERING / MARCH/APRIL 2001
FIG. 1. Frequency Distribution of 1-min Rain Rates Averaged from ORG High-Resolution Observations
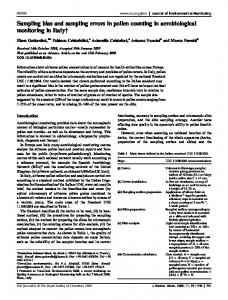
FIG. 2. Performance of Tipping-Bucket (TB) Simulator (Solid Curve ⴝ Rain Rate Measured with Optical Rain Gauge (ORG); Solid Vertical Lines ⴝ Measured Tip Times from TB Colocated with ORG; Open Circles ⴝ Tip Times Obtained from TB Simulator)
where ⌬V = volume of the bucket; R = input rain rate of the ORG; ⌬t = sampling resolution of the ORG; ⌬T = sampling resolution of the simulated TB; and N = number of tips. If the rain rate R during any time period ⌬T was not sufficient to cause the TB to tip, the volume of the accumulated rain was saved and used in the next ⌬T. By doing so, the total volume of the incident rainfall would be preserved. The evaluation of the simulator’s performance as a tool that is used to reproduce the underlying structure of the rainfall process is not within the scope of this study. However, a qualitative evaluation is possible through using the recordings of a real TB gauge located at the same experimental site and next to the ORG. The real TB rain gauge takes observations that are synchronized with the ORG, and we found it interesting to compare the output from our simulator against the recordings of the real TB. Fig. 2 shows an example of one storm recorded by the ORG and the real colocated TB. In the figure, the recorded tips of the real TB gauge are shown as vertical lines. Also shown are the tips of the simulated TB in the form of small circles, qualitatively, the agreement is good. One should not expect a perfect match between the time of both the recorded and simulated tips, since the real TB is subject to many other environmental and operational factors that affect its observation. ESTIMATION OF RAIN RATE FROM RAW TB DATA Using the simulator with certain time and volume resolutions (⌬T and ⌬V ), the ORG data set can now be converted into TB recordings in the form of number of tips per sampling interval. The next step is to convert the time-recorded tips into some rainfall measure, such as rainfall rate, that is useful for other hydrological/climatological applications. First we have to choose the time scale of the rain rate estimates (⌬). The simplest way to convert the ⌬T, number of tips, into ⌬, rain rate, is by counting the number of tips, N, that were recorded during each ⌬ interval R(⌬) =
N(⌬)⌬V ⌬
(2)
Such conversion will result in a coarse resolution of the estimated ⌬, rain rates, since R(⌬) will always be multiples of the bucket volume. As an example, if ⌬ = 1 min and ⌬V = 0.254 mm, then the 1-min rain rate R would always have the discrete values of multiples of 15.24 mm/h. Such rough resolution is associated with an error on the order of one tip volume (15.24 mm/h in our example). An alternative way to convert the number of tips into rain rates is by considering that a tip is the result of the rain that fell since the time of the preceding tip. Consequently, the rain rate during the intertip time interval is assumed constant R(Ti ⫺ Ti⫺1) =
⌬V Ti ⫺ Ti⫺1
(3)
where Ti and Ti⫺1 = times of occurrence of two consecutive tips. This also works if more than one tip was recorded during the sampling period ⌬T where we distribute the number of tips over the time interval between consecutive TB recordings. The rain rate R(⌬) can then be estimated by performing a linear interpolation across the time domain Ti(i = 1 . . . total number of tips). A similar approach was followed by Fankhauser (1997). An implied assumption of this method is the uniformity of the rain rate within the duration between consecutive tips. Such an assumption may not be fully acceptable if the TB has a coarse sampling interval and if the observed events are associated with low rain rates. A typical problem of such a transformation scheme is that the rain rate is never zero even in the periods when the rainfall process shows intermittence.
FIG. 3. Comparison of Rain Rates from Optical Rain Gauge (ORG) and Tipping-Bucket (TB) Simulator (Rain Rates for Storm Measured with ORG Are Shown in Solid Lines; Corresponding Rates from TB Simulator, Using Eq. (3) with Sampling Resolution of 5 s and Bucket Size of 0.254 mm, Are Shown in Broken Lines)
In zero-rate periods within a certain event, the TB estimates would always give very low values as the next tip is distributed over such periods. Fig. 3 shows an example of this transformation scheme where one storm recorded by the ORG was used to simulate the TB recordings, which were then transformed into a 1-min rainfall rate using (3) with the linear interpolation. In this transformation, we used a tip volume ⌬V = 0.254 mm and a time resolution ⌬T = 5 s as the simulator parameters. We will show later that the parameters ⌬T and ⌬V determine with how much accuracy the TB would be able to reproduce small-scale details of the temporal varibility that characterizes the rainfall process. Comparing the recorded and simulated storms of Fig. 3 shows that the TB was not able to capture the fine details of the event. It can also be noticed that the TB fails to predict both the start and the ending time of the rainfall event. However, this simulation/transformation process was able to reproduce the general behavior of the storm. Accordingly, we used the proposed simulation/transformation scheme for this study to evaluate the performance of the TB gauge and its uncertainties as a device for sampling the rainfall process. UNCERTAINTIES OF TB GAUGE MEASUREMENTS The sampling-related uncertainty of the TB rainfall measurements can be estimated by comparing the TB simulated rain rates versus the ORG measured ones. The comparison should be performed for the two devices on the same time scale. For the ORG, the high-temporal-resolution data can always be averaged to yield a certain time-scale rain rate. For the TB, the raw data are in the form of tips sampled with a certain resolution, and we need to find out on which time scale the conversion into rain rate should be made so that the corresponding error is sufficiently small. The question, then, is, should the rain rate be provided for 1 min, 5 min, 1 h, or 1 day? We used the simulated TB and observed ORG quantities to address this issue. In this study, we convert the simulated TB tips into rain rates at a variety of time scales and then compare them versus the ‘‘true’’ ORG data. As we mentioned earlier, two main parameters control the operation of the TB rain gauge: the sampling time resolution ⌬T, and the bucket volume resolution ⌬V. First, we kept those two parameters constant (⌬V = 0.254 mm, ⌬T = 5 s) to investigate the issue of the time scale of the rain rate estimates. Later, we examined the effect of varying ⌬T and ⌬V on the performance of the TB. In this study, we calculated TB rain rate estimates for three time scales: 1, 5, and 15 min. The lower limit of these time JOURNAL OF HYDROLOGIC ENGINEERING / MARCH/APRIL 2001 / 161
FIG. 4. Tipping-Bucket Error for Three Simulation Time Scales: 1, 5, and 15 min Obtained with Constant Sampling Resolution of 5 s and Constant Bucket Size of 0.254 mm
scales if of more interest for applications that need information about small-scale temporal variability. For instance, many of the hydrologic models use rainfall time series with relatively fine scales on the order of a few minutes, e.g., Holman-Dodds et al. (1999). It would be interesting to see whether the TB gauge is capable, as a rainfall-sampling device, of representing the rainfall process at fine scales and with satisfactory levels of certainty. For each time scale we simulated the TB observations using the entire data set of the high-resolution ORG observations. Then we converted the TB tips into rain rate at the chosen time scale. Finally we compare the TB estimated rain rate versus the ORG values averaged over the same scale. The TB error can be expressed as follows: ETB = RTB ⫺ RORG
(4)
where RTB = TB rate estimated for a certain time scale; RORG = ORG measured rate averaged over the same time scale; and ETB is the TB error of the RTB estimate at the applied time scale. The results are shown in Fig. 4 where the TB error is plotted versus the simulated TB rain rate for each of the time scales. Among the three simulated time scale, the largest error magnitudes were obtained in the case of 1-min rain rate estimates. For a certain simulated rain rate, the error defined by (4) achieves its maximum overestimating limit when the ORG is not recording any rain, RORG = 0. This explains the upper linear threshold that bounds the scatter of the error values as shown in the figure. The error attains negative values when the TB tends to underestimate the rain rate. The underestimation is not bounded, and can get as high as several orders of magnitude of the simulated value. With a 5-min time scale, the scatter of the error is significantly reduced in comparison with the 1-min case. Further increase of the averaging time scale results in a significant reduction of the error magnitude as shown in the case of the 15-min scale. If the estimates were made with much higher time scale, e.g., 1 h (not included), the errors are almost negligible. By examining the individual simulated storms, we can provide some explanations for the observed TB errors. A typical problem that affects the performance of the TB and any transformation scheme is the determination of both the beginning and the end of a rain event. The only information that a TB gauge provides about the beginning of an event is the time of its first tip. Then one has to decide, based on some rather arbitrary criteria, exactly when the rain event actually started. There is no one unique criterion that can work for all events. As shown in Figs. 3, 6, and 8, different storms show different temporal structures at their initial durations, which will lead 162 / JOURNAL OF HYDROLOGIC ENGINEERING / MARCH/APRIL 2001
to some discrepancy between the starting times of the simulated and measured storms. The same applies to the end of the event, where the time of the last tip does not help to define when it actually stopped raining. Similarly, isolated tips within the storm would impose similar difficulties. An alternative approach may be used, where a nonlinear interpolation/extrapolation converts the number of tips into rain rate [e.g., Sadler and Busscher (1989); GSP-TRMM (1999)]. However, the results of such an approach would depend on the applied extrapolation method rather than on the actual structure and type of rainfall within that event. With any preset criterion about the first, the last, and the isolated tips, the TB would fail to capture both the starting and ending times of the rain periods within the storm, as well as their corresponding low rain rates. This explains why the TB error achieved its highest values at the low rain rates as shown in Fig. 4. Another problem that characterizes the TB gauge is its poor performance in events that have mostly low rain rates. As an accumulating device that tries to give an estimate for a continuous process, the response of the TB would always be delayed when rainfall rates are low. Similar observations were reported by Goldhirsh et al. (1992), who indicated that the TB has a long integration time when the rain rates are relatively low. Accordingly, recorded tips would happen either too late or too soon because of residual accumulation. The TB also suffers from accuracy problems at high rain rates: it is usually unable to give an accurate estimate of the peak values within the event. This is mainly due to the high gradient of the rain rates at the peaks and valleys of the rainfall time series. We should mention that at high rates, the TB uncertainty would be dominated by errors due to the lack of dynamic calibration. Our study does not report on such problems as they have been investigated in previous works, e.g., Humphrey et al. (1997). The problems we have just discussed are significant. However, we found that most of these problems with TB performance were alleviated, though not completely eliminated, when the time scale of the TB estimates was increased to 5 or 15 min (Fig. 4). Based on such observations, we can conclude that the TB gauge is associated with significant uncertainty levels if used at very small time scales (less than 5 min). It becomes more reliable when the rainfall rates are estimated on time scales that are in the range of 10–15 min. For longer time scales, such as 1 h, the sampling errors are negligible. EFFECT OF SAMPLING RESOLUTION ON TB ACCURACY The two parameters that control the operation of the TB device, bucket volume ⌬V and sampling resolution ⌬T, were
FIG. 5.
Scatter Plot of the Tipping-Bucket Error Obtained with Two Bucket Sizes, Compare with 0.254-mm Resolution in Fig. 4
FIG. 6.
Example of Event Simulated with Different Bucket Sizes
kept constant at 0.254 mm and 5 s, respectively, during the previous calculations. Many of the operational rain gauge networks use coarse resolution of these two parameters, while more recently deployed networks tend to use TB gauges with finer resolutions. To examine the effect of the sampling resolution on the TB performance accuracy, we repeated the simulations using various values of ⌬V and ⌬T. The 1-min estimates obtained in the previous section with ⌬V = 0.254 mm and ⌬T = 5 s were used as a comparison reference. Volume Resolution In addition to the default value of ⌬V = 0.254 mm, other commercial TB gauges are available with a variety of volume resolutions, such as 0.1, 0.5, and 1 mm. To investigate the effect of the bucket volume, we performed simulations using two more resolutions of 0.1 and 0.5 mm. The results of the simulated TB error given by (4) are shown in Fig. 5. A significant reduction in the error values was obtained when ⌬V is reduced from 0.254 mm to 0.1 mm. When the bucket volume is set to ⌬V = 0.5 mm, the error gets higher for most of the simulated rain rate range and it becomes more and more scattered. In Fig. 6, we show an example of one of the events as observed by the ORG along with the corresponding TB values simulated with the three different bucket-volume resolutions. A close look at the details of the storm shows how the TB with coarser ⌬V values could not match the observed storm rates, especially in the peaks and valleys of the storm. The figure shows that when a smaller bucket is used, the beginning and ending times of the rain event were detected with higher accuracy. Based on these observations, the use of a bucket-volume that is larger than 0.254 mm (0.01 in.) would
introduce an additional source of error to the TB observations. Peak rain rates and the fine temporal variability of the rainfall time series were captured only when a small bucket volume was used. Sampling Time Resolution The second parameter that affects the operation and performance of the TB is its sampling rate ⌬T. All the previous results were obtained for a TB that sampled every 5 s. In many of the operational networks, the gauges operate at a much coarser sampling resolution. Sampling with higher rates translates into more expensive data acquisition systems and also larger data storage requirements. Here we examined whether the use of coarse sampling rate affected the accuracy of the TB measurements. We investigate this by reperforming the simulations using various sampling time intervals. The TB error distribution associated with sampling intervals of 30 s and 1 min is shown in Fig. 7. Compared with the case of 5-s resolution, the decrease of the TB sampling rate induced much larger errors at both low and high rain rates. It is also interesting to see the binning of the TB estimated rain rates into coarse discrete values. With a 1-min sampling rate, the simulated rain rate is always given as multiples of the bucket-volume per minute. This would lead to a poor representation of the rainfall event, as can be seen in Fig. 8, which shows an event simulated with various sampling rates. The results obtained with other values of the sampling rate (not included) showed that the fine temporal variability of the rainfall event would be missed if a TB with a sampling rate larger than 10 s were used. JOURNAL OF HYDROLOGIC ENGINEERING / MARCH/APRIL 2001 / 163
FIG. 7. Fig. 4)
Scatter Plot of Tipping-Bucket Error Obtained with Two Different Sampling Resolutions (Compare with 5-s Resolution in
RETB 兩 TBi =
FIG. 8. Example of Event Simulated with Different Sampling Resolutions
APPROXIMATE FORMULAS FOR TB ERRORS The results obtained in the previous sections showed that the TB rainfall estimates are subject to sampling-related errors that depend on the estimation time scale and also on the parameters that control its operation, namely the sampling rate and the bucket volume resolutions. Such levels of uncertainties can be characterized by examining the basic statistics of the TB error distribution obtained under different time scales. The statistics were calculated based on a relative error (RETB) defined as follows: RETB =
RTB ⫺ RORG RORG
(5)
Also, the error statistics will be conditioned on the rain rate of the simulated TB. The rain rate range is divided into bins so that the mean and standard deviation of RETB can be expressed in a conditional sense, RETB 兩 TBi and RETB 兩 TBi, where TBi is the rain rate of the ith bin. Expressing the error in a relative sense and in a conditional way is more convenient from the practical point of view. Given a certain observation TBi, the relative error and its statistics would give a measure of how much the TB is off with respect to the true rainfall that was represented by the ORG. Conditional mean RETB 兩 TBi and standard deviation RETB 兩 TBi of the relative error can be obtained for each time scale of the rain rate estimates as follows: 1 RETB 兩 TBi = n
冘
(RETB)j 兩 TBi
(6a)
j
164 / JOURNAL OF HYDROLOGIC ENGINEERING / MARCH/APRIL 2001
1 n
冑冘
[(RETB)j 兩 TBi ⫺ (RETB 兩 TBi)]2
(6b)
j
where n = sample size of each TBi with a particular estimation time scale. The simulated TB rate range was divided into variable-size bins, TBi, where the summation was made over the sample size of each bin. The bin size was chosen to be 5 mm/h for small rain rate, and as the sample size got smaller for the higher rain rates, the bin size was increased so that the computed statistics are still meaningful. The two statistics were computed for different TB simulation scenarios. Various sampling rates of 5, 10, and 30 s were applied to obtain TB rain rate estimates at three time scales of 1, 5, and 15 min. A constant bucket volume of 0.254 mm (0.01 in.) was used. The mean and standard deviation for some of the simulation scenarios, computed by (6), are shown in Fig. 9 where the horizontal-line segments represent the bin widths of the TB rain rates. The upper panels are the statistics obtained with a 5-s sampling resolution applied for each of the three time scales. The lower panels are for a single time scale (5 min) estimated with various sampling rates. The error conditional mean as shown in Fig. 9 indicates that the TB estimates have either overestimated or underestimated the true rates, especially for the low range of the observed rain rate. The discussion given in the previous two sections about the limitations of the TB gauge can explain the over/underestimation of the relative mean error. This was significantly reduced with the increase of both the time scale of the rain rate estimates and the TB sampling resolution. For higher rain rates, the mean relative error gets much smaller, and almost vanishes for the largest time scale (15 min). Fig. 9 also shows that the standard deviation of the TB relative error decreased significantly as the observed rain rate increased. However, with low rain rates, the standard deviation maintains its high levels even with the largest time scale; here it gets as high as 50%, which reflects the significant scatter of the error as was discussed in previous sections. The error also keeps its high values when a poor volume resolution is used. In the following, we attempt to characterize the TB sampling-related errors using approximate formulas that describe its distribution. Both the mean and standard deviation of the relative conditional error were approximated using a power formula of the following form: RETB 兩 TB = ␣m ⭈ TB⫺m ⫺ ␥m ⫺s
RETB 兩 TB = ␣s ⭈ TB
(7a) (7b)
where ␣m, m, ␥m, ␣s, and s = best-fit coefficients. Tables 1 and 2 show the values of these parameters obtained for each
FIG. 9. Comparison of Tipping-Bucket Error Statistics: Upper Figures Correspond to Various Time Scales with One Sampling Resolution of 5 s, Lower Figures Correspond to One Time Scale of 5 min with Various Sampling Resolutions (Constant Bucket Size of 0.254 mm Was Used)
TABLE 1. Fitting Coefficients of Error Approximate (Formulas: Mean of Relative Error) Time scale (min) (1)
Sampling resolution (s) (2)
Error upper bound (%) (3)
␣m (4)
m (5)
␥m (6)
R (%) (7)
1
5 10 30 5 10 30 60
12.2 12.3 12.5 3.3 3.3 3.5 3.8
17.2 17.5 19.8 9.0 9.0 9.6 10.4
1.06 1.02 0.83 1.10 1.05 0.76 0.56
0.9 1.10 2.07 0.50 0.60 1.06 2.06
87 84 83 87 85 86 84
5
2
Note: Mean of relative error is negligible for time scale of 15 min; bucket volume = 0.254 mm (0.01 in.).
TABLE 2. Fitting Coefficients of Error Approximate (Formulas: Standard Deviation of Relative Error) Time scale (min) (1) 1 5
15
Sampling resolution (s) (2)
Error upper bound (%) (3)
␣s (4)
s (5)
R2 (%) (6)
5 10 30 5 10 30 60 5 10 30 60 300
50.6 51.0 51.8 28.4 28.4 29.0 32.0 13.4 13.5 14.2 16.9 34.7
130 135 137 119 122 123 136 68 68 68 75 98
0.82 0.80 0.50 1.27 1.26 1.10 1.00 1.48 1.46 1.38 1.31 0.96
96 96 83 99 98 94 84 99 99 97 96 96
Note: Bucket volume = 0.254 mm (0.01 in.).
combination of time scale and sampling rate, along with the determination coefficient of the fitting. Based on the computed statistics, an upper bound is given for the fitted formulas to avoid the overestimation introduced by the power relation of (7) at low rain rates. It should be noted that these formulas are for a TB gauge with a bucket size of 0.254 mm (0.01 in.). We chose this particular size since it is widely used in both operational and experimental networks. The formulas provided should be considered as first-order approximations, due to the size of the sample: for high rain rates, the experimental data set used in this study did not provide enough samples. Also, with the increase of the estimation time scale, the sample size gets even smaller, which imposes some limitations on the accuracy of these formulas. Nevertheless, the formulas serve as rough, yet practical, guidelines for evaluation of the TB sampling associated errors.
CONCLUSIONS In this study we attempted to characterize the errors associated with tipping-bucket rain gauges when used to provide rainfall intensity estimates at small temporal scales. The main source of the TB gauge sampling error is its sampling mechanism and its inability to capture the small temporal features of the rainfall time series. We found significant error levels in the 1-min estimates especially at low rain rates, but we also found that as the time scale of the computed rain rates increased, the error decreased substantially. With time scales longer than 15 min, the error becomes negligible. The gauge’s performance and its associated errors are sensitive to the applied sampling interval and the bucket volume. Therefore, we recommend sampling intervals on the order of 5–10 s, along JOURNAL OF HYDROLOGIC ENGINEERING / MARCH/APRIL 2001 / 165
with a bucket size no larger than 0.254 mm (0.01). Finally, we provided approximate formulas of the TB sampling error obtained under various operational schemes. Our analysis was based on rainfall observations that were mostly dominated by convective storms with few stratiform events. Similar analysis may be needed to investigate the scope of applicability of the developed formulas under different climatological regimes. However, the formulas serve as a first-order approximation that can be used in practical applications. ACKNOWLEDGMENTS The experimental equipment used in the study was funded by the National Science Foundation, the U.S. Army Research Office, and the Iowa Institute of Hydraulic Research. Additional support was provided by The University of Iowa College of Engineering and the NOAA Grant No. NA76-GP-0483.
APPENDIX I.
REFERENCES
Anagnostou, E. N., and Krajewski, W. F. (1998). ‘‘Calibration of WSR88D precipitation processing subsystem.’’ Weather Forecasting, 13, 396–406. Anagnostou, E. N., and Krajewski, W. F. (1999a). ‘‘Real-time radar rainfall estimation Part I: Algorithm formulation.’’ J. Atmospheric and Oceanic Technol., 16, 189–197. Anagnostou, E. N., and Krajewski, W. F. (1999b). ‘‘Real-time radar rainfall estimation Part II: Case study.’’ J. Atmospheric and Oceanic Technol., 16, 198–205. Ciach, G. J., and Krajewski, W. F. (1999). ‘‘On the estimation of radar rainfall error variance.’’ Adv. Water Res., 22(6), 585–595. Fankhauser, R. (1997). ‘‘Influence of systematic errors from tipping bucket gauges on urban runoff simulation. Use of historical rainfall series for hydrological modeling.’’ Preprints, 3rd Int. Workshop on Rainfall in Urban Areas, R. Fankhauser, T. Einfalt, and K. ArnbjergNielsen, eds., 37–44. Georgakakos, K. P., Carsteanu, A. A., Sturdevant, P. L., and Cramer, J. A. (1994). ‘‘Observation and analysis of Midwestern rain rates.’’ J. Appl. Meteorology, 33, 1433–1444. Giuliani, S., Mourot, G., Boukhirs, A., and Auchet, P. (1997). ‘‘Rain gauge failure detection and isolation for urban sewer network control. Use of historical rainfall series for hydrological modeling.’’ Preprints, 3rd Int. Workshop on Rainfall in Urban Areas, R. Fankhauser, T. Einfalt, and K. Arnbjerg-Nielsen, eds., 45–52. Goldhirsh, J., Krichevsky, V., and Gebo, N. E. (1992). ‘‘Rain-rate duration statistics and fade distributions at 20 and 30 GHz derived from a network of rain gauges in the Mid-Atlantic coast over a five-year period.’’ IEEE Trans. Antennas Propagation, 40(11), 1408–1415. GSP-TRMM. (1999). ‘‘Gauge software package.’’ TRMM Office home page, NASA, Washington, D.C. 具http://trmm-fc.gsfc.nasa.gov/trmm㛭 gv/典 (2 December 2000) Holman-Dodds, J., Bradley, A. A., and Sturdevant-Rees, P. L. (1999). ‘‘Effect of sampling of precipitation on hydrologic model calibration.’’ J. Geophys. Res., 104(D16), 19645–19654. Humphrey, M. D., Istok, J. D., Lee, J. Y., Hevesi, J. A., and Flint, A. L. (1997). ‘‘A new method for automated dynamic calibration of tippingbucket rain gauges.’’ J. Atmospheric and Oceanic Technol., 14, 1513– 1519. Krajewski, W. F., Kruger, A., and Nesˇpor, V. (1998). ‘‘Experimental and numerical studies of small-scale rainfall measurements and variability.’’ Water Sci. and Technol., 37(11), 131–138. Nesˇpor, V., and Sevruk, B. (1999). ‘‘Estimation of wind-induced error of rainfall gauge measurements using a numerical simulation.’’ J. Atmospheric and Oceanic Technol., 16, 450–464. Niemczynowicz, J. (1986). ‘‘The dynamic calibration of tipping-bucket raingauges.’’ Nordic Hydrol., Lyngby, Denmark, 17, 203–214. Nystuen, J. A., and Proni, J. R. (1996). ‘‘A comparison of automatic rain gauges.’’ J. Atmospheric and Oceanic Technol., 13, 62–73.
166 / JOURNAL OF HYDROLOGIC ENGINEERING / MARCH/APRIL 2001
Nystuen, J. A. (1998). ‘‘Temporal sampling requirements for automatic rain gauges.’’ J. Atmospheric and Oceanic Technol., 15, 1253–1260. Sadler, E. J., and Busscher, W. J. (1989). ‘‘High-intensity rainfall rate determination from tipping-bucket rain gauge data.’’ Agronomy J., 68, 126–129. Schilling, W. (1991). ‘‘Rainfall data for urban hydrology: what do we need?’’ Atmospheric Res., 27, 5–21. Sevruk, B., and Hamon, W. R. (1984). ‘‘International comparison of national precipitation gauges with a reference pit gauge, instruments and observing methods.’’ Rep. No. 17, World Meteorological Organization, Geneva. Sevruk, B., and Lapin, M., eds. (1993). ‘‘Precipitation measurement & quality control.’’ Proc., Int. Symp. on Precipitation and Evaporation, Vol. 1, Slovak Hydrometeorological Institute, Bratislava, Slovakia. Simpson, J., Adler, R. F., and North, G. R. (1988). ‘‘A proposed Tropical Rainfall Measuring Mission (TRMM) satellite.’’ Bull. Am. Meteorological Soc., 69, 278–295. Steiner, M. (1996). ‘‘Uncertainty of estimates of monthly areal rainfall for temporally sparse remote observations.’’ Water Resour. Res., 32(2), 373–388. Young, C. B., Bradley, A. A., Krajewski, W. F., Kruger, A., and Morrissey, M. (1999). ‘‘Evaluating NEXRAD multisensor precipitation estimates for operational hydrologic forecasting.’’ J. Hydrometeorology, 1(3), 241–254. Yu, B., Ciesiolka, C. A. A., Rose, C. W., and Coughlan, K. J. (1997). ‘‘A note on sampling errors in the rainfall and runoff data collected using tipping bucket technology.’’ Trans. ASAE, 40(5), 1305–1309. Zhu, H.-J., and Schilling, W. (1996). ‘‘Simulation errors due to insufficient temporal rainfall resolution—annual combined sewer overflow.’’ Atmospheric Res., 42, 19–32.
APPENDIX II.
NOTATION
The following symbols are used in this paper: ETB = tipping-bucket error of RTB estimate at applied time scale; N = number of tips; n = sample size of each tipping-bucket rate bin; R = rain rate; RORG = optical-rain-gauge-measured rain rate averaged over certain time scale; RTB = tipping-bucket rain rate estimated for certain time scale; RETB = TB relative error of RTB estimate at applied time scale; RETB 兩 TB = conditional mean of tipping-bucket relative error, RETB; T = time of occurrence of tipping-bucket tip; ␣, , and ␥ = best-fit coefficients of tipping-bucket error approximate formulas; ⌬T = sampling resolution of simulated tipping-bucket gauge; ⌬t = sampling resolution of optical rain gauge; ⌬V = bucket volume; ⌬ = time scale of tipping-bucket rain rate estimates; and RETB 兩 TB = conditional standard deviation of tipping-bucket relative error, RETB.
Subscripts i m ORG s TB
= = = = =
positive integer index; mean; optical rain gauge; standard deviation; and tipping-bucket rain gauge.