SAMPLING SAPROXYLIC BEETLES WITH WINDOW FLIGHT TRAPS: METHODOLOGICAL INSIGHTS C. BOUGET1, H. BRUSTEL2, A. BRIN2 & T. NOBLECOURT3 RÉSUMÉ. — Regards méthodologiques sur l’échantillonnage des coléoptères saproxyliques au moyen des pièges-vitres. — Les coléoptères saproxyliques constituent un groupe riche en espèces, souvent petites et cryptiques, et difficiles à échantillonner. Différentes méthodes sont traditionnellement utilisées pour les collecter: les techniques (i) de collecte active, (ii) d’élevage et (iii) de piégeage. Le piège-vitre est actuellement la méthode la plus fréquemment utilisée pour la capture des coléoptères saproxyliques aériens mobiles. Grâce à la combinaison de différents principes, les pièges-vitres comportent de multiples modèles. Cette étude concerne l’influence de 3 facteurs sur les captures de coléoptères saproxyliques, en comparant (i) des pièges plans bidirectionnels ou multidirectionnels en croix (effet de forme), (ii) des pièges transparents ou noirs (effet silhouette), (iii) des pièges suspendus à faible hauteur ou dans la canopée. Six jeux de données écologiques de plaine ou d’altitude, de forêts françaises feuillues ou résineuses, et comportant deux pièges différents appariés par placette, ont été compilés et analysés pour comparer l’efficacité respective des méthodes. La forme du piège a un fort effet significatif sur l’abondance et la richesse spécifique, à l’avantage des pièges plans. Néanmoins, en raison de contraintes pratiques ou financières, les pièges-croix sont recommandés. Les pièges noirs ou transparents fournissent des échantillons comparables en termes d’abondance, de richesse et de composition. Nos résultats confirment la différenciation verticale des assemblages de coléoptères saproxyliques, les pièges bas capturant davantage d’individus et d’espèces que les pièges de la canopée. A l’exception des Melyridae, aucune espèce n’est associée aux strates hautes. Des analyses complémentaires fondées sur de plus amples jeux de données sont requises pour optimiser les méthodes d’échantillonnage. Mots-clés: Optimisation, méthodes d’échantillonnage, efficacité, gestion. SUMMARY. — Saproxylic beetles are species-rich, mostly small and cryptic, and difficult to sample. Different methods are traditionally used to collect saproxylic beetles. These are (i) direct active collection techniques, (ii) rearing techniques and (iii) mass trapping methods. Window-flight trapping is currently the most frequently used technique for catching flying active saproxylic beetles. Thanks to the combination of different trap principles, window-flight trap devices may differ by a large number of intrinsic parameters. This paper offers further insight into the influence of 3 trap factors on the catches of dead wood associated beetles, by comparing (i) cross-vanes or single-plane WFT (shape effect), (ii) black or transparent CWFT (silhouette effect), (iii) low or high CWFT (height effect). Six ecological data sets from French upland or lowland, deciduous or coniferous forests, with paired freely hanging window traps on each plot, were compiled in this study and analysed with a methodological point of view to compare the efficiency of sampling methods. Trap shape had a significant and strong effect on the abundance and species richness of saproxylic beetles. The single-plane traps caught a higher number of individuals and species. Nevertheless, given time/cost constraints, cross-vanes traps are recommended. Our study shows that black and transparent cross-vanes traps yielded similar saproxylic samples in terms of abundance, richness and overall composition. Our results confirm the vertical differentiation of saproxylic beetle assemblage. They suggest that low cross-vanes window traps yield more species-rich and individual-rich samples than canopy traps. Except Melyrids, no abundant species showed a strong association with top traps. Further optimisation analyses based on larger datasets are required to make sampling methods more reliable. Abbreviations: Cross-vanes Window Flight Trap (CWFT); Single-Plane Window Flight Trap (PWFT) Keywords: Optimization, sampling methods, efficiency, monitoring.
1 Institute for engineering in agriculture and environment (Cemagref), Research Unit «Forest ecosystems», Domaine des Barres. F-45290 Nogent-sur-Vernisson. E-mail:
[email protected] 2 Université de Toulouse, École d’Ingénieurs de Purpan, 75 Voie du TOEC. F-31076 Toulouse cedex 3. E-mail:
[email protected] &
[email protected] 3 ONF, Cellule d’Études Entomologiques, 2 rue Charles Péguy. F-11500 Quillan. E-mail:
[email protected]
Rev. Écol. (Terre Vie), suppt. 10, 2008.
– 21 –
Most saproxylic beetles are small, cryptic, and difficult to sample. This together with their high species richness makes their study challenging. They have increasingly been studied over the past 20 years, especially in northern and central Europe, mainly because they make up one of the largest groups of red-listed species in many countries and have been particularly affected by forest management. We still have insufficient knowledge of the efficiency and selective properties of the single methods used for sampling saproxylic beetles. Yet knowledge of performance is fundamental for the choice of standardized sampling methods and interpretation of results. Biodiversity monitoring schemes and comparisons between different kinds of forest plots require standardized and optimized field methods. Several different methods are generally used to collect saproxylic beetles. These are (i) direct active collection techniques, (ii) rearing techniques and (iii) mass trapping methods (Leather, 2005). Active collection techniques, including peeling and sifting the bark of dead trees, and beating dead wood, can yield large numbers of poorly mobile species. Rearing (log emergence traps, Owen traps, extraction cylinders) and hand-collecting beetles have the advantage of sampling directly from woody substrates; in addition beetle samples may be related to the volume and bark area of dead wood (Siitonen, 1994). However these methods have proved unsatisfactory in many respects. Much habitat is often destroyed. They do not offer reliable means of standardization and even with a large sampling effort most species are too infrequent for statistical comparisons. The main role of specialized collecting in broader biodiversity studies is only to supplement mass sampling with different kinds of traps: (i) attractive traps (coloured, silhouette, chemo-attractive), (ii) interception traps or (iii) attractive interception traps. Window-flight trapping (WFT, also called Flight-Intercept Trapping (FIT), window/ barrier trapping or collision trapping), developed by Chapman & Kinghorn (1955) then Peck & Davies (1980), is currently the most frequently used technique for catching flying active saproxylic beetles (Barbalat, 1995; Okland, 1996; Martikainen et al., 1999; Grove, 2000). Window flight traps consist of a vertical barrier to insect flight that is considered invisible to the insect. On hitting the barrier, most beetles drop down and fall into a collection container with liquid preservatives. Although interception traps do not give accurate information about the micro-habitat, they are many times more efficient compared to extraction methods. From Similä (2002) about 60% of the flying beetle fauna can be caught in window traps, thus giving a representative picture of saproxylic beetle fauna (Siitonen, 1994). The window trap is a readily available and highly effective trap with many advantages: it is easily standardized and replicable, simple to construct, not labour intensive, and large numbers of small cryptic flying taxa can be caught. This method does have some shortcomings: high cost per unit, difficulty of installation and sample retrieval, susceptibility to high winds, tourist insects possible and a less substrate-specific set of sampled species, only flying-active species, risk of flooding (dealt with through the use of roofs, drainage holes or frequent servicing), visibility by passers-by, subject to vandalism. Window-flight traps are much more selective than other traps (Canaday, 1987). From several comparative studies carried out in south-western France and the Pyrenees, the proportion of beetles among arthropods is much higher in window traps than in beer-baited bottle or coloured traps (Tab. I). In boreal spruce forests, 42% (Martikainen et al., 2000) to 67% (Stokland, 1994) of beetle species and 39% (Sippola et al., 2002) to 47% (Martikainen et al., 2000) of beetle individuals caught in WFT are saproxylic. Thanks to the combination of different trap principles, window-flight trap devices may differ by the following parameters: (i) dimensions and panel area, (ii) panel shape (singleplane [Bouget, 2005] or multidirectional “cross-vanes” traps with interlocking panels [Hines & Heikkenen, 1977]), (iii) fluid preservative, (iv) panel colour (transparent or black), (v) silhouette type (multiple-funnel, pipe, etc.), (vi) sticky or not sticky panel, (vii) colour of funnel or collecting container (dark, yellow, white, etc.), (viii) bait (alcohol, terpenes, etc. directly released from the trap fluid or from a dispenser), (ix) height and position (freely suspended, ground-based or attached to a trunk [trunk window trap]). Some commercial traps have been developed to monitor or to limit bark beetle and other wood-boring insect populations (e.g. Morewood et al., 2002). – 22 –
TABLE I Selectivity (% beetles / total arthropod individuals) of window flight traps compared with other trapping techniques in different forest types in south-western France (from Valladares, 2000; Brustel, 2001; Noblecourt, 2001 in Brustel, 2004) Beetle proportion (%) Beer-baited bottle trap Beer-baited canopy bottle trap Coloured trap Window-flight trap Attractive WFT (+ pinene)
Douglas firSpruce 1,6 4,1 25,0 41,8 49,4
Beech-Fir
Pine
Fir-hardwood
Oak
3,9 4,2 37,5 57,1 19,5
7,6 6,1 32,4 40,6 68,4
11,9 6,1 44,8 75,7 84,1
3,9 4,3 30,7 40,8 /
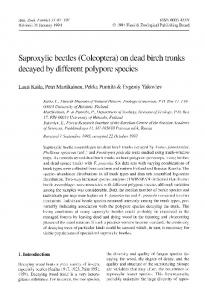
In this paper, we would like to appraise whether the catches of dead wood associated beetles are influenced by 3 trap factors by comparing (i) cross-vanes or single-plane WFT (shape effect), (ii) black or transparent CWFT (silhouette effect), (iii) low or high CWFT (height effect). We asked the following questions: (i) under field conditions, did both methods in each paired comparison sample an equal number of individuals and species and similar assemblages? (ii) Do some sampling methods perform better than others when evaluating the cumulative species richness, the species abundance or the assemblage composition? MATERIAL AND METHODS STUDY AREAS AND SAMPLING DESIGNS Six ecological data sets from French upland or lowland, deciduous or coniferous forests were compiled in this study and analysed from a methodological point of view to compare sampling methods. The available datasets mainly concerned issues at the plot scale and came from forest balanced sampling designs with paired traps on each plot. To assess the effect of the general shape of the WFT, two systems were compared: (i) a multidirectional PolytrapTM, manufactured by EIP (Toulouse, France) and made up of two transparent perpendicular panels mounted above a wide plastic funnel, (ii) a single flat plate mounted above a container. Both traps had a cumulative panel area of 1 m2 (Fig. 1). To investigate this question, a small dataset is available, which corresponds to 2 plots in cork oakwoods in south-western France, with 2 paired traps in each plot and 8 monthly samplings (Tab. II). Traps were half-filled with a baiting and preservative alcoholic mixture.
Figure 1. — Design of two window-traps offering an interception area of 1 m2: a cross-vanes window flight trap (CWFT) and a single-plane window flight trap (PWFT)
– 23 –
TABLE II Sampling designs of the studies used for methodological analysis: structure and key figures Dataset
Trap shape
Trap colour
Trap height
Site
Plot type
Sample size
Spatial design
Year
Seasonal design (n sampling periods)
South-western France (Gers) 150m
cork oakwood
2 plots 4 traps
2 paired traps per plot
2002
May-August (8)
4 forests in Paris region 150m
Lowland oak forest
5 plots 16 traps
2 or 4 paired-traps per plot
2002 2003
April-Aug. 2002 (10) April-Aug. 2003 (13)
Jujols forest (Eastern Pyrenees) 1700m
Upland pine forest
1 plot 2 traps
2001 2002
March-Sept. 2001 (8) April-Aug. 2002 (15)
Py forest (Eastern Pyrenees) 1700m
Upland beech/fir forest
2 plots 4 traps
2004 2005
June-Sept. 2004 (5) June-Sept. 2005 (6)
Tronçais forest (Allier, central France) 300m
Lowland oak forest
3 plots 6 traps
2005
May-Aug. 2005 (7)
Central Pyrenees (Ariège and Haute-Garonne) 1000-1400m
Upland beech/fir forest
5 plots 60 traps
2004
May-Aug. (6)
2 paired traps per plot
6 pairs of traps per plot
Trap type 2
1m alcohol-baited cross-vanes or single-plane WFT
1m2 black or transparent CWFT
1m2 low or high CWFT
The second trap parameter we examined was the colour of the panels. For half of the CWFT, the central part of the two plexiglass panes was coloured in black, to combine two trapping principles: silhouette attraction and interception. Four compiled datasets from entomological inventories conducted by the National Forest Service in central France, the Pyrenees and the Paris region were used to study the differences in catches between black and transparent traps. In each study plot, 2 paired CWFT (black and transparent) were operated and servicing was at weekly intervals. Overall, 25 pairs of traps were distributed in 11 plots (Tab. II). Thirdly, a robust dataset enables us to address the question of trap height. It is commonly admitted that forest ecosystems are vertically stratified. Beetle species are known to fly and disperse at different heights, or ‘altitudes’in forest ecosystems. Obviously, traps operated at lower strata and others at tree canopy level should catch dissimilar assemblages. However, fewer studies have rigorously quantified the effect of trap height on saproxylic beetle catches. Our dataset is composed of 30 pairs of traps, 1 low (2m) and 1 high (15 meters), operated in 5 plots in upland beech-fir forests in the French Pyrenees (Tab. II).
DATA PROCESSING Linear mixed-model ANOVA tests were carried out to check for differences in total saproxylic beetle abundance, cumulative species number, family and species abundance per trap (cumulated over the trapping periods) between the two trap types in each paired comparison. Nested spatial variables (region, forest, plot) were classified as random effects to take the geographic pattern of the sampling design into account. Species and families represented by fewer than 30 individuals were not tested. Non-Metric Multidimensional Scaling (NMDS) based on the Bray-Curtis dissimilarity was used for pattern recognition in species composition and the ANOSIM procedure was used for testing for differences in assemblage composition between trap types. ANOVA, NMDS and ANOSIM were performed using S.Plus 6.2. The exhaustiveness of black and transparent traps was calculated with the ComDyn software (Hines et al., 1999) and estimated as a proportion, i.e. the number of observed species in a trap type divided by the estimated number of species present at the site (jacknife method). The exhaustiveness is therefore related to species detection probability.
RESULTS DIFFERENCES IN SAPROXYLIC BEETLE ASSEMBLAGE CAUGHT BY SINGLE-PLANE OR CROSSVANES WFT Despite the small size of the sampling design, the entomological dataset was quite rich (5600 saproxylic beetles and 239 species). First, the trap shape seemed to have a significant and strong effect on the abundance of saproxylic beetles per trap (ANOVA F(1.22) = 19.6, p = – 24 –
60
60
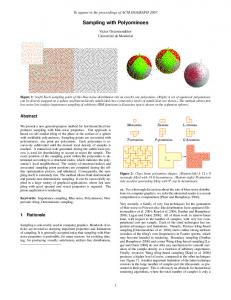
0.0002). More individuals were caught in single-plane traps (250.3 +/- 196.9SD) than in crossvanes traps (100.0 +/- 89.3SD). A mixed-model ANOVA test was also carried out to look for differences in species richness between cross-vanes and single-plane traps. As for abundance, the richness was higher in single-plane traps (F = 67.8, p < 0.0001) (Fig. 2).
**
5
30
30
10
40
40
50
15
50
ns
(a)
cross
plane
10
0
10
20
20
species richness
**
(b)
black transp
(c)
low
high
Figure 2. — Comparison of cumulative richness per trap between trap types. Differences between cross-vanes and single-plane traps (a), between black and transparent traps (b), and between low and high traps (c). ** p < 0.001; ns p > 0.01. Boxplots show the location and spread of data; the line inside the box represents the median.
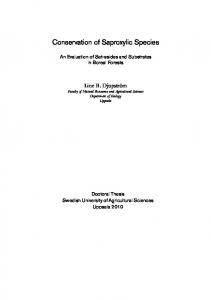
The Venn diagram shows that 88% of the local species were caught by plane traps, whereas cross-vanes traps caught only 46% of the local species. On average, 54% of the local species were found only in plane traps at each site (Fig. 5). The ANOSIM test showed that plane traps also consistently differ from cross-vanes traps for saproxylic assemblages (Bray-Curtis dissimilarity index, R = 0.38, p < 0.001). For several families (Latridiidae, Elateridae, Nitidulidae, Platypodinae, Scraptiidae, etc.) and species (Platypus cylindrus, Anaspis pulicaria, Cryptarcha strigata, etc.), significantly more individuals were caught in single-plane WFTs than in cross-vanes WFTs (Tab. III). No species or family was more abundant in cross-vanes traps. DIFFERENCES IN SAPROXYLIC BEETLE ASSEMBLAGES USING BLACK OR TRANSPARENT WFTS A rich dataset was compiled by aggregating the results of four studies: the Paris dataset (3800 individuals and 245 species), the Jujols dataset (2100 individuals and 150 species), the Py dataset (1800 individuals and 115 species), the Tronçais dataset (1800 individuals and 120 species). A mixed model ANOVA showed no significant differences in total abundance per trap between black (808.2 +/- 1106.0SD) and transparent traps (1024.8 +/- 1308.0SD) (ANOVA F(1.34) = 0.1, p = 0.76). The ordination biplot (Fig. 3) did not identify patterns in species composition, which was confirmed by the ANOSIM test (R = 0.024, p = 0.586). The mean Bray-Curtis dissimilarity between black and transparent CWFTs was only about 30%. – 25 –
TABLE III Difference in abundance of species and families between cross-vanes and single-plane window traps. Mixed-model ANOVA of abundance per trap (+/- SD). 18 species and 20 families caught with more than 30 individuals were tested, and only taxa with a p(test) < 0.1 are indicated in the table. ** P < 0.01; * 0.01 < P < 0.05; ns 0.05 < P < 0.1 Abundance in cross- Abundance in singlevanes window traps plane window traps (CWFT) (PWFT)
Taxa
ANOVA F(1.22)
0.4 +/- 0.7 0.2 +/- 0.5 0.5 +/- 0.8 0.3 +/- 0.6 0.6 +/- 1.5 1.7 +/- 2.2 1.3 +/- 1.7 4.4 +/- 13.9 0.4 +/- 0.7 2.5 +/- 5.2 2.9 +/- 4.6 1.1 +/- 1.4 0.7 +/- 1.0 0.1 +/- 0.3
2.6 +/- 4.7 2.1 +/- 4.9 1.6 +/- 2.3 1.6 +/- 2.7 1.6 +/- 1.9 8.9 +/- 7.1 5.8 +/- 6.4 9.8 +/- 21.0 5.1 +/- 6.8 5.8 +/- 8.3 6.4 +/- 5.2 9.4 +/- 9.1 3.9 +/- 3.9 3.3 +/- 4.5
+ 499% + 997% + 213% + 419% + 160% + 426% + 360% + 120% + 1267% + 133% + 119% + 739% + 463% + 5159%
8.5 ** 4.1 ns 4.1 ns 4.5 * 3.1 ns 35.2 ** 22.1 ** 10.4 ** 18.4 ** 8.1 * 10.2 ** 27.1 ** 22.4 ** 18.4 **
0.1 +/- 0.3 0.7 +/- 1.1 0.4 +/- 0.8 10.3 +/- 7.7 6.6 +/- 6.2 1.9 +/- 1.9
7.3 +/- 9.4 17.4 +/- 24.4 14.4 +/- 23.8 44.6 +/- 37.2 28.6 +/- 32.8 6.6 +/- 7.7
+ 11500% + 2435% + 3750% + 333% + 332% + 242%
33.8 ** 36.1 ** 26.0 ** 39.5 ** 11.9 ** 7.9 *
0.2
0.2
0.4
TENEBR. ALLECULINAE Mycetochara linearis ANOBIIDAE CIIDAE COLYDIIDAE CURCULIONIDAE ELATERIDAE LAEMOPHLOEIDAE LATRIDIIDAE MELYRIDAE MYCETOPHAGIDAE NITIDULIDAE Epurea sp. Cryptarcha strigata CURCUL. PLATYPODINAE Platypus cylindrus SCRAPTIIDAE Anaspis pulicaria STAPHYLINIDAE Paraphloeostiba gayndahensis TENEBRIONIDAE
Difference between CWFT and PWFT
T 0.0
0.0
L Comp.2
-0.2
H
-0.4
-0.6
-0.4
-0.2
Comp.4
B
-0.6
-0.4
-0.8
(a) -0.2
0.0
0.2
0.4
0.6
Comp.3
(b) -0.6
-0.4
-0.2
0.0
0.2
0.4
0.6
Comp.1
Figure 3. — NMDS ordination biplot of the Bray-Curtis dissimilarity matrix. The two axes with the highest correlation to trap colour (a) and height (b) are represented. The 4 dimension-stress equalled 0.067 (a) and 0.137 (b). Pairwise ANOSIM tests do not show any significant difference in species composition between black and transparent traps (R = 0.024, p = 0.586), but a distinction between low and high traps does exist (R = 0.358, p < 0.0001). B = Black, T = Transparent, L = Low, H = High.
– 26 –
Even though the assemblages caught in black or transparent traps were not significantly distinct, significant differences in abundance were noticed at family and species levels (40 species and 30 families caught in more than 30 individuals were analysed). For instance, the catches of Ciidae, Mycetophagidae and Laemophlœidae increased in black traps, whereas Lymexylonidae, Nitidulidae and Buprestidae were more abundant in transparent traps (Tab. IV). The number of scolytids was variously affected by trap colour. Xyleborus monographus was significantly more frequent in black traps. Conversely, X. germanus was more abundant in transparent traps. TABLE IV Difference in abundance of species and families between black and transparent traps. Mixedmodel ANOVA of abundance per trap (+/- SD). 40 species and 30 families caught with more than 30 individuals were tested, and only taxa with a p(test) < 0.1 are indicated in the table. ** P < 0.01; * 0.01 < P < 0.05; ns 0.05 < P 0.01. (Boxplots show the location and spread of data; the line inside the box represents the median).
DIFFERENCES IN SAPROXYLIC BEETLE ASSEMBLAGE CAUGHT BY LOW OR HIGH WFT From the dataset composed of 1200 individuals and 115 species, catches of saproxylic beetles were significantly affected by vertical trap position (ANOVA F(1.29) = 32.3, p < 0.0001). Overall, more than twice as many saproxylic beetle individuals were captured in traps placed at 2 m (27.9 +/- 26.4SD) as in traps hung at higher positions (11.7 +/-9.1SD). Similarly, significantly more saproxylic species were caught in traps hung at 2 m than in traps placed at 15m (ANOVA F(1.29) = 37.4, p < 0.0001; Fig. 2). From the Venn diagram (Fig. 5), low traps caught 79% of the observed species, whereas higher traps sampled only 59% of the observed species. About 38% of observed species were caught in both traps. Furthermore, from the ordination plot (Fig. 3), the species composition of saproxylic beetle assemblages caught at the lower or higher position clearly differed. This distinction was confirmed by the ANOSIM test (R = 0.36, p < 0.0001). The average Bray-Curtis dissimilarity between low and high traps reached a value of 58%. Significantly more individuals in several families such as the Anobiidae, Ciidae, Eucnemidae, Scolytidae, Leiodidae were caught in lower traps. Only Melyrids were almost twice as numerous in higher traps (Tab. V). Among species mainly caught in canopy traps (Dissoleucas niveirostris [100% of 18 individuals], Xestobium plumbeum [80% of 24 individuals], Anaspis maculata [80% of 18 individuals]), none was abundant enough to be tested. Anyway, these species are not canopy-specific, since they were also found in the lower strata of open forest stands during other studies.
– 28 –
(a)
(b)
(c)
Figure 5. — Venn diagrams showing the proportion of species caught by each trap type, according to trap shape (a), trap colour (b) and trap height (c).
TABLE V Difference in abundance of species and families between low and high traps. Mixed-model ANOVA of abundance per trap (+/- SD). 6 species and 14 families caught with more than 30 individuals were tested, and only taxa with a p(test) < 0.1 are indicated in the table. ** P < 0.01; * 0.01 < P < 0.05; ns 0.05 < P < 0.1 Taxa ANOBIIDAE Hemicoelus costatus Ptilinus pectinicornis CERAMBYCIDAE CIIDAE CRYPTOPHAGIDAE ELATERIDAE LATRIDIIDAE LEIODIDAE MELYRIDAE PTINIDAE SALPINGIDAE Rhinosimus ruficollis CURCUL. SCOLYTINAE STAPHYLINIDAE
Abundance in low traps
Abundance in high traps
Difference between L and H
F(1.29)
14.0 +/- 25.5 5.4 +/- 7.1 7.7 +/- 23.4 1.0 +/- 1.2 1.8 +/- 1.6 2.1 +/- 2.6 5.3 +/- 5.0 4.0 +/- 3.0 2.1 +/- 2.9 2.1 +/- 2.2 1.4 +/- 3.5 2.4 +/- 2.3 1.0 +/- 1.2 15.4 +/- 16.2 20.2 +/- 28.7
2.4 +/- 3.5 1.4 +/- 2.7 0.0 +/- 0.2 0.4 +/- 0.6 0.2 +/- 0.4 3.2 +/- 3.2 0.7 +/- 1.2 2.5 +/- 3.3 0.1 +/- 0.3 3.8 +/- 2.6 0.2 +/- 0.7 1.5 +/- 1.8 0.1 +/- 0.3 7.6 +/- 7.5 3.5 +/- 3.6
- 83% - 74% - 100% - 55% - 91% +52% - 87% - 37% - 94% +82% - 83% - 37% - 86% - 51% - 83%
29.7 ** 25.6 ** 50.0 ** 3.8 ns 50.7 ** 3.7 ns 70.6 ** 16.6 ** 35.0 ** 12.5 ** 3.6 ns 5.5 * 20.3 ** 19.9 ** 40.1 **
– 29 –
DISCUSSION In the search for standardized trap sets, what are the implications of our study on window flight trap performance for beetle inventories? SHAPE EFFECT First, the results concerning trap shape tend to give an advantage to plane traps, which caught a higher number of saproxylic beetle individuals and species even though the interception surface area of cross-vanes and plane traps was standardized. Conversely De Groot & Nott (2001) observed that trap catches with a single vane (clear or black) or cross-vanes (clear or black) were not significantly different for pine buprestids. We must remember that our relatively small dataset cannot give robust results, merely trends. Moreover some confounding factors may have lead to a spurious relationship. The difference between the two traps may indeed result from the difference in the volume of attractive preservative fluid in the container. Because there was ten times as much fluid in single-plane window traps as in cross-vanes window traps and because the surface area of the collection container was larger, the baiting effect may have been stronger in single-plane traps. This phenomenon may be involved for Nitidulidae (Epuraea sp., Cryptarcha strigata), Elateridae, Latridiidae which are known to be attracted to ethanol (Chenier & Philogene, 1989). What is more, 1m2 single-plane traps have important drawbacks: the difficulty of installation and sample retrieval, susceptibility to wind, a larger volume of fluid necessary, longer sorting time of samples (because of the higher number of other Invertebrates, twigs and leaves in the larger pan container of plane window traps). These practical constraints may therefore dictate the selection of the method. Cross-vanes WFTs are lighter, compact to store and transport, relatively unaffected by strong winds, and present a strong visual target. Given time/cost constraints, cross-vanes WFTs are recommended. SILHOUETTE EFFECT It is commonly admitted that wood-boring beetles are attracted to potential hosts by both volatiles and visual cues. Many traps have been designed to exploit the host-selection response to a silhouette - in other words, a dark, vertical shape (multi-funnel traps, pipe traps; Lindgren, 1983). Silhouette traps are used extensively to trap ambrosia and bark beetles and (with lesser efficiency) large wood-boring beetles (McIntosh et al., 2001). Our study shows that black and transparent cross-vanes traps yielded similar saproxylic samples in terms of abundance, richness and overall composition. Only some subcorticolous predators (Laemophlœidae) or xylomycetophagous families (Mycetophagidae, Ciidae) and one scolytid species (X. monographus) were more abundant in black traps. The catches of Buprestids, Cerambycids and Scolytids as a whole were not significantly affected by trap colour. On the contrary, de Groot & Nott (2001) found that traps with a black silhouette were significantly more effective in capturing pine longhorn beetles (but not pine buprestids) than traps with clear vanes. Generally speaking, it seems that cross-vanes traps have a more prominent silhouette than pipe or multiple-funnel trap. First, Morewood et al. (2002) showed that cross-vanes traps captured significantly greater numbers of most Cerambycidae and Siricidae, and similar numbers of most Buprestidae, compared with the two other traps. Secondly, Czokajlo et al. (2001) and Czokajlo et al. (2003) concluded that black cross-vanes traps performed equally well or better than the multi-funnel trap for Cerambycids and Scolytids, whereas captures of Buprestids and associated predators were lower in window traps than in the Funnel trap. We need a balanced comparison between clear or black cross-vanes traps in conifer or deciduous stands. HEIGHT EFFECT Our results confirm the vertical differentiation of saproxylic beetle assemblage. They suggest that low CWFTs yield more species-rich and individual-rich samples than canopy traps: – 30 –
these results are close to what Vance et al. (2003) found in Canadian maple forests. Understorey traps accumulated significantly higher abundances than canopy traps, and, except for Melyrids, no species showed a strong association with top traps. From studies carried out using flight intercept traps in tropical rainforests, the numbers of beetle individuals and species in ground stratum were equal to (Stork & Grimbacher, 2006) or higher (Hill & Cermak, 1997) than numbers in the canopy stratum. The strong differentiation of assemblage composition emphasizes the need to include canopy fauna in diversity studies, even in temperate forests. CONCLUSION Our results are valid only for freely hanging window traps. It is not known whether trunk window traps, for instance, would give similar data. Suspended window flight traps are useful for between-site comparisons as they have lower between-trap variability than trunk window traps which are clearly dependent on the baiting effect of neighbouring substrates (Grove, 2000). The efficiency and selectivity of CWFT to catch the swarming individuals entering or leaving dead trees make them suitable for comparative studies. From our data, the best trap to be standardized should be a low (2m high) transparent cross-vanes window-flight trap. The PolytrapTM device, manufactured by the EIP (Toulouse), is a readily available standard product that corresponds to these needs and may be used in largescale comparative studies. For fauna inventories, and due to the (sometimes slight) dissimilarity induced by variations in trap devices, it may be informative to combine several trapping principles in each trap station made up of more than two traps, as it has already been suggested by Hyvärinen et al. (2006) for instance. Some trap parameters are still under study. Since little is known about the effect of trap spacing, trap number per site, year-to-year variation (Martikainen & Kouki, 2003), within-year variation (seasonal effects), we recommend that comparisons should be made cautiously to explore these parameters. Moreover, the influence on stand openness on alcohol lure attractiveness and on low-stratum trap efficiency (Brin & Brustel, 2006) should be investigated. Further optimization analyses based on larger datasets are required to make sampling methods more reliable. ACKNOWLEDGEMENTS We would like to thank the French National Forest Service (ONF) for funding a part of the analytical work. F. Archaux gave valuable comments on the ComDyn software. We are also grateful to several amateur entomologists who helped with beetle identification.
REFERENCES BARBALAT, S. (1995). — Efficacité comparée de quelques méthodes de piégeage sur certains coléoptères et influence de l’anthophilie sur le résultat des captures. Bull. Soc. Neuchât. Sci. Nat.,, 118: 39-52. BOUGET, C. (2005). — Short-term effect of windstorm disturbance on saproxylic beetles in broadleaved temperate forests. Part I: do windthrow changes induce a gap effect? For. Ecol. Manag., 216: 1-14. BRIN, A. & BRUSTEL, H. (2006). — Réponse des Coléoptères saproxyliques à l’hétérogénéité des subéraies des Maures (France, Var). Rev. Ecol. (Terre Vie), 61: 327-342. BRUSTEL, H. (2004). — “Polytrap™” a window flight trap for saproxylic beetles. 3rd Symposium and Workshop on the Conservation of Saproxylic Beetles. Riga / Latvia, 7th-11th July, 2004. Poster. CANADAY, C.L. (1987). — Comparison of insect fauna captured in 6 different trap types in a douglas-fir forest. Can. Entomol., 119: 1101-1108. CHAPMAN, J.A. & KINGHORN, J.M. (1955). — Window flight traps for insects. Can. Entomol., 87: 46-47. CHÉNIER, J.V.R. & PHILOGÈNE, B.J.R. (1989). — Evaluation of three trap designs for the capture of conifer-feeding beetles and other forest Coleoptera. Can. Entomol., 121: 159-167. CZOKAJLO, D., MCLAUGHLIN, J., DE GROOT, P., WARREN, J.C., TEALE, S.A. & KIRSCH, P. (2001). — InterceptTM panel trap modified for monitoring forest Cerambycidae. J. For. Sci., 47: 36.
– 31 –
CZOKAJLO, D., MCMAUGHLIN, J., ABU AYYASH, L., TEAL, S., WICKHAM, J., WARREN, J., HOFFMAN, R., AUKEMA, B., RAFFA, K. & KIRSCH, P. (2003). — Intercept Panel Trap (INT PT) effective in management of forest Coleoptera. Pp 125-126 in: M.L. McManus, & A.M. Liebhold (eds). Proceedings of the symposium Ecology, Survey and Management of Forest Insects, Kraków, Poland, 2002 September 1-5. U.S.D.A. Forest Service, Northeastern Research Station, DE GROOT, P. & NOTT, R. (2001). — Evaluation of six different designs to capture pine sawyer beetles (Coleoptera, Cerambycidae). Agric. For. Entomol., 3: 107-111. GROVE, S.J. (2000). — Trunk window trapping: an effective technique for sampling tropical saproxylic beetles. Mem. Queensland Mus., 46: 149-160. HILL, C.J. & CERMAK, M. (1997). — A new design and some preliminary results for a flight intercept trap to sample forest canopy arthropods. Austral. J. Entomol., 36: 51-55. HINES, J.E., BOULINIER, T., NICHOLS, J., SAUER, J. & POLLOCK, K.H. (1999). — COMDYN: software to study the dynamics of animal communities using a capture-recapture approach. Bird Study, 46 (suppl.): 209-217. HINES, J.W. & HEIKKENEN, H.J. (1977). — Beetles attracted to severed Virginia pine (Pinus virginiana Mill.). Envir. Entomol., 6: 123-127. HYVARINEN, E., KOUKI, J. & MARTIKAINEN, P. (2006). — A comparison of three trapping methods used to survey forestdwelling Coleoptera. Eur. J. Entomol., 103: 397-407. LEATHER, S. (2005). — Insect sampling in forest ecosystems. Blackwell Science, Oxford. LINDGREN, B.S. (1983). — A multiple funnel trap for scolytid beetles (Coleoptera). Can. Entomol., 115: 299-302. MARTIKAINEN, P. & KOUKI, J. (2003). — Sampling the rarest: threatened beetles in boreal forest biodiversity inventories. Biodiv. Cons., 12: 1815-1831. MARTIKAINEN, P., SIITONEN, J., KAILA, L., PUNTTILA, P. & RAUH, J. (1999). — Bark beetles (Coleoptera, Scolytidae) and associated beetle species in mature managed and old-growth boreal forests in southern Finland. For. Ecol. Manage., 116: 233-245. MARTIKAINEN, P., SIITONEN, J., PUNTTILA, P., KAILA, L. & RAUH, J. (2000). — Species richness of Coleoptera in mature managed and old-growth boreal forests in southern Finland. Biol. Cons., 94: 199-209. MCINTOSH, R.L., KATINIC, P.J., ALLISON, J.D., BORDEN, J.H. & DOWNEY, D.L. (2001). — Comparative efficacy of five types of trap for woodborers in the Cerambycidae, Buprestidae and Siricidae. Agric. For. Entomol., 3: 113-120. MOREWOOD, W.D., HEIN, K.E., KATINIC, P.J. & BORDEN, J.H. (2002). — An improved trap for large wood-boring inects, with special reference to Monochamus scutellatus (Coleoptera, Cerambycidae). Can. J. For. Res., 32: 519-525. OKLAND, B. (1996). — A comparison of three methods of trapping saproxylic beetles. Eur. J. Entomol., 93: 195-209. PECK, S.B. & DAVIES, A.E. (1980). — Collecting small beetles with large area window traps. Coleopter. Bull., 34: 237-239. SIITONEN, J. (1994). — Decaying wood and saproxylic Coleoptera in two old spruce forests: a comparison based on two sampling methods. Ann. Zool. Fenn., 31: 89-95. SIMILÄ, M. (2002). — Patterns of beetle species diversity in Fennoscandian boreal forests: effects of forest age, naturalness and fertility and covariation with other forest-dwelling taxa. PhD thesis, University of Joensuu, Finland. STORK, N. & GRIMBACHER, P. (2006). — Beetle assemblages from an Australian tropical rainforest show that the canopy and the ground strata contribute equally to biodiversity. Proc. R. Soc. B- Biol. Sci., 273: 1969-1975. VANCE, C., KIRBY, K., MALCOLM, J. & SMITH, S. (2003). — Community composition of longhorned beetles (Coleoptera: Cerambycidae) in the canopy and understorey of sugar maple and white pine stands in south-central Ontario. Envir. Entomol., 32: 1066-1074.
– 32 –