we observe that the VSIDS branching heuristic and hence the CDCL search procedure is highly .... placement algorithms â which is the most time-consuming component. The re- sulting graphs .... real-world solver as the evolution engine. DPVis uses a .... Graphviz - graph visualization software. http://www.graphviz.org/.
SATGraf: Visualizing the Evolution of SAT Formula Structure in Solvers Zack Newsham, William Lindsay, Vijay Ganesh, Jia Hui Liang, Sebastian Fischmeister, and Krzysztof Czarnecki University of Waterloo, Canada Abstract. In this paper, we present SATGraf, a tool for visualizing the evolution of the structure of a Boolean SAT formula in real time as it is being processed by a conflict-driven clause-learning (CDCL) solver. The tool is parametric, allowing the user to define the structure to be visualized. In particular, the tool can visualize the community structure of real-world Boolean satisfiability (SAT) instances and their evolution during solving. Such visualizations have been the inspiration for several hypotheses about the connection between community structure and the running time of CDCL SAT solvers, some which we have already empirically verified. SATGraf has enabled us in making the following empirical observations regarding CDCL solvers: First, we observe that the Variable State Independent Decaying Sum (VSIDS) branching heuristic consistently chooses variables with a high number of inter-community edges, i.e., high-centrality bridge variables. Second, we observe that the VSIDS branching heuristic and hence the CDCL search procedure is highly focused, i.e., VSIDS disproportionately picks variables from a few communities in the community-structure of input SAT formulas.
1
Introduction
Conflict-driven clause-learning (CDCL) SAT solvers have witnessed dramatic improvements in their efficiency over the last 20 years, and consequently have become drivers of progress in many areas of computer science such as formal verification [1, 2]. There is general agreement that these solvers somehow exploit structure inherent in industrial instances. In order to understand what this structure is and the mechanism by which CDCL solvers exploit it, we need visualization/evolution tools that can help us formalize and visually check our hypotheses that can subsequently be verified using the scientific method. In order to enable researchers to improve their intuitions of how CDCL solvers work, better understand the structure of industrial instances, and visualize in realtime how CDCL solvers exploit said structure, we built the SATGraf visualization/evolution tool. SATGraf takes as input a Boolean formula, and outputs a rendering of its variable-incidence graph (VIG) as well as showing how the structure evolves in real-time while being solved by a SAT solver. SATGraf is parametric, i.e., it can be configured to display any structure discoverable in a SAT formula. SATGraf enables researchers to formalize and visually check their hypotheses about the behavior of SAT solvers. SATGraf has been invaluable to us in formulating and visually checking many hypotheses about CDCL SAT solvers that we proposed, which we were able to subsequently verify empirically. For example, in our paper on community structure and their impact on SAT solver performance [3] we provide empirical evidence that community structure correlates more strongly with the running time of CDCL
solvers than traditional hypotheses such number of clauses, variables and their ratio. We used SATGraf to visually check that many classes of easy-to-solve industrial instances have “good” community structure. Another hypothesis that SATGraf helped us verify is that the VSIDS branching heuristic disproportionately favors high-centrality bridge variables, i.e., those that belong to clauses that lie between communities in the community structure of SAT instances. Background: While SATGraf is able to display any user-defined structure, we focus here on community structure. The idea of decomposing graphs into natural communities arose in the study of complex networks. Modularity is a measure of the quality of the community structure of a graph and ranges from 0 to 1, where 0 is a poor community structure and 1 a strong community structure. Informally, we say a graph has poor community structure (modularity close to 0) if there are more inter-community edges than intra-community edges. Conversely, if the graph has more intra-community edges than inter-community edges, this correlates with good community structure (modularity close to 1). Modularity is often used in optimization methods for detecting community structure in networks. The precise definition and its calculation can be found in [4]. Many algorithms [5, 6] have been proposed to solve the problem of finding an optimal community structure of a graph, the most well-known among them being the one from Girvan and Newman [5]. We refer the reader to these papers [5–7] for complete descriptions of community detection algorithms. Contributions: We make the following contributions in this paper.1 The SATGraf Tool: We present SATGraf, a tool that enables researchers to visualize the community structure of a SAT instance and see its evolution while solving by a real world CDCL solver. VSIDS & High-centrality Bridge Variables: Using SATGraf we observed that the VSIDS branching heuristic disproportionately picks high-centrality bridge variables in the community structure of input instances during the entire run of the solver. Focused Search by CDCL Solvers: Using SATGraf we observed that the VSIDS branching heuristic disproportionately picks variables from a few communities in the community structure of SAT instances during the entire run of the solver. Unnecessary Backtracking Steps: Using SATGraf we observed that backtracking resets decisions and propagations unrelated to the current conflict.
2
How SATGraf Works
SATGraf is implemented in phases as described below: Phase 1: First, SATGraf converts an input Boolean formula (in DIMACS format) into its corresponding graph. Currently the only format we consider for this is the variable-incidence graph, however other implementations such as the clauseincidence graph are possible. Phase 2: Second, SATGraf computes structure metrics as defined by the user. Currently the user may choose from either the Clauset-Newman-Moore (CNM) algorithm [5] or the online (OL) community algorithm [6], however it is possible for the user to specify their own additional algorithms. 1
All code and data can be obtained from the SATGraf formula visualization/evolution tool website: http://satbench.uwaterloo.ca/satgraf/index
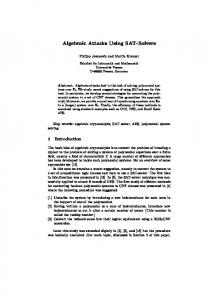
(a) Industrial aes 16 10 keyfind 3
instance: (b) Random instance: unif-k3-r4.267v421-c1796-S4839562527790587617
Fig. 1: Community structure of instances from the SAT 2013 Competition
Phase 3: Third, SATGraf uses a user-specified layout algorithm to render the graph while maintaining the structure detected in phase 2. Currently the user may choose from either a modified version of layout algorithm by Kamada and Kawai (KK) [8] or the Fruch-Reingold (FR) algorithm [9]. Other “fast” layout options include a grid or circle solution, where communities are treated as separate graphs and use either the KK or FR layout algorithms, these communities are then placed on a grid or circle pattern. While these options do not display the structure as clearly, they scale better. Phase 4: Finally, users of SATGraf can replay different stages of the evolution. While doing this they may also hide communities, edges or variables, that are not of interest to obtain a clearer view of those that are. To this end the user may also zoom in on specific communities within the graphical representation, and choose whether to hide, or colour variables that have been assigned values at any point during the evolution. The user may also choose to export the entire graphical evolution as a GIF file for later analysis, though this does create large files. The modular design of SATGraf allows for easy integration of any other structure metric or layout algorithm for either of these categories. Figure 1 shows the graph generated by SATGraf for two instances from the SAT 2013 competition [10]. Figure 1a is an industrial instance, and Figure 1b shows a randomly-generated instance. Edges between variables within the same community are assigned a distinct colour, one per community. White edges represent inter-community edges, and red edges resulting from conflict clauses. As is evident, the industrial instance has lot more distinct communities that can be neatly partitioned, while the randomly generated instances typically have lots inter-community edges. SATGraf can present the evolution of a formula by interacting with modified versions of SAT solvers. Currently only MiniSAT is supported, however C source code is included in the project to ease integration with other solvers. MiniSAT interacts with SATGraf’s evolution mechanism by notifying it when a variable changes value – either by decision or propagation — and when new conflict clauses are added.
SATGraf then updates the graph by either hiding, showing or colouring edges and nodes, or by redrawing the graph (if the user requests it). This allows users to observe the overall evolution of the structure of the formula, but also to see how each community is affected during solution. SATGraf is open source and available at [11, 12] with an easy install version available at [13]. The project was developed in Java and has a modified version of MiniSAT included.
3
Results
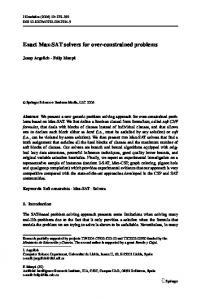
SATGraf has been tested on several industrial, hard combinatorial, and randomlygenerated formulas from the 2013 SAT competition [10]. The time taken to display the community structure of a single instance grows with the size of the input formula. This is to be expected due to the nature of the community detection and placement algorithms — which is the most time-consuming component. The resulting graphs, using the OL community detection and FR layout algorithms, can be seen in Figure 1. The community structure of the industrial instance has much better modularity than the one for the randomly-generated instance. This can be verified both visually and through the modularity measure: the industrial instance has a modularity of 0.77, while the randomly-generated one has a modularity of 0.16. Their solve times using MiniSAT are also different; The industrial instance takes 0.076 and the randomly-generated instance times out after 5000 seconds. SATGraf has been found to be efficient when viewing a number of different SAT instances, the largest observed containing approximately 450,000 variables and 1.4 million clauses. However, this utilised the “grid” layout algorithm. Unfortunately neither the number of variables, nor the number of clauses provide an accurate representation of the running time of SATGraf, as it is the number of edges that drives most of the workload. As such, a single clause containing 500 variables, will be more intensive than a 40,000 3-CNF formula. SATGraf’s evolution feature is partly shown in two pictures in Figure 2. The SAT instance here is obtained from a feature model [14] called Fiasco that can be downloaded from the SATGraf website [15]. A GIF of the entire evolution of Fiasco can also be found here. We chose this SAT formula since it is a good representation of an industrial application of SAT solvers. Furthermore, this instance is small enough so that we can actually show, in a timely manner, how the SAT solver dynamically morphs its graph (the instance and the generated learnt clauses). Finally, the solvers [16, 17] solved this formula without generating too many conflicts, and thus it was easier to make sense of the evolution of the graph of this instance. Observing the evolution showed an interesting trend. Namely, the removal of entire communities during the solving process. This evolution can be seen when going from the graph of the original SAT formula in Figure 2a, to the graph after the solver generates the first conflict shown in Figure 2b. It is easy to see that some of the communities have completely disappeared by the absence of their associated colour, i.e., the corresponding clauses have been satisfied. 3.1
Observation #1: VSIDS chooses High-centrality Bridge Variables
Whilst visualising industrial instances using SATGraf, we found that VSIDS was consistently choosing decision variables that have a high number of inter-community edges, which we call high-centrality bridge variables. For example in the SAT competition formula aes 16 10 keyfind 3 98% of the first 5000 decision variables had
(a) Initial state
(b) After 550 decisions
Fig. 2: Partial evolution of the fiasco formula
inter-community edges. This leads us to suspect that VSIDS is discovering the community structure implicitly whilst solving. We have found similar results for other industrial and hard combinatorial instances from the SAT competition. It is possible that the decision variables consistently being inter-community variables is either a random artefact of the VSIDS heuristic, or simply that a large number of the variables in the formula had inter-community edges. However, we do not believe this to be the case. In fact after 5000 decisions, 66% of the decision variables had more inter-community edges than intra-community edges. This observation presents a conjecture that can be validated independently through modifications to the VSIDS algorithm and empirical measurements, which is the subject of current research in our group. 3.2
Observation #2: VSIDS Moves Infrequently Between Communities
In addition to our previous observations, we observed that a high percentage of decision variables occurred within the same communities. When considering the aes 16 10 keyfind 3 SAT formula, 80% of the decision variables were chosen from the same community as the previous decision variable. This would support the hypothesis that formulas which have a good community structure are sometimes solved one community at a time. 3.3
Observation #3: Backtracking May Incur Unnecessary Overhead
Whilst visualising the SAT formula toybox on SATGraf, we found that despite the high level of separability of the formula (mostly distinct, unconnected communities), backtracking caused variables that were unconnected to the conflict variables (either directly or transitively) to be reset. In most SAT formulas of interest, the communities will not be as clearly separated as in the toybox example. However, we present the conjecture that in some situations the backtracking of CDCL solvers results in more work being done than is necessary. We suggest that a potential solution to this would be a selective backtracking algorithm, that determines which variables are affected by a backtrack. While this would require additional time during solution to determine affected variables, in instances with higher solve times, it could prove effective.
Tool Interactive Evolution Community 3D Implication DPVis[18] 3 3 7 7 3 GraphInsight[19] 3 7 7 3 7 iSat[20] 7 3 7 7 7 GraphViz[21] 7 7 7 7 7 SATGraf 3 3 3 7 3
Table 1: Comparison of SAT Visualization tools
4
Related Work
SATGraf is the only tool that we know of that has both visualization capabilities to view the “user-defined structure” of SAT instances and evolution feature that shows how this structure is morphed during solution. While other tools [18, 20, 19, 21] have visualization or evolution capabilities, they do not allow for user defined structure, nor do they show how the solver morphs this structure. Instead, the choice of graph structure of SAT instances is hard-coded in these tools. Additionally, we support community structure, while the tools we compare against do not. Table 1 highlights the differences between visualization tools that we found. Those differences range across a handful of categories such as interactive (ability to hide/show nodes, edges or other structural information); evolution (ability to see the evolution of the SAT formula); structure (ability to display the community (or any other) structure); 3D (three dimensional capability) and implication (can generate the implication graph). DPVis [18], is the closest to SATGraf in terms of features. It is a graphing tool designed to expose how a CDCL solver morphs a SAT instance as it is being solved. It offers a number of features such as multiple layout algorithms, the ability to set specific values on literals displayed in the graph, and performing unit propagation. However, unlike SATGraf it does not allow the user to specify the formula structure (e.g., community structure), nor does it allow the user to specify a non-included real-world solver as the evolution engine. DPVis uses a built-in implementation of the DPLL algorithm, along with a hard coded interface to MiniSAT to display the evolution, whereas SATGraf uses a user provided real world solver. While currently only two solvers support this technique (MiniPure and MiniSAT), it is possible for the user to implement this on any solver, using the provided API. Each tool presented in Table 1 has different strengths and weaknesses. However, the only tool that can accomplish visualizing additional structure of a SAT formula, both in its original state and while being solved by a SAT solver, is SATGraf.
5
Conclusion
SATGraf presents a way to visualise a SAT instance’s community structure. Furthermore, SATGraf has the ability to dynamically graph the community structure of a CDCL SAT solver’s progress while solving a SAT formula. These features were shown to be unique to SATGraf when compared to various similar tools. These new capabilities yielded hypotheses regarding the correlation between the community structure of input instances and performance of CDCL SAT solvers. We found that the better the modularity is, the less time the SAT solver needs, and the CDCL SAT solver often seems to solve SAT formulas one community at a time.
References 1. Edmund Clarke, Muralidhar Talupur, Helmut Veith, and Dong Wang. Sat based predicate abstraction for hardware verification. In Theory and Applications of Satisfiability Testing, pages 78–92. Springer, 2004. 2. Armin Biere, Alessandro Cimatti, Edmund M Clarke, Masahiro Fujita, and Yunshan Zhu. Symbolic model checking using sat procedures instead of bdds. In Proceedings of the 36th annual ACM/IEEE Design Automation Conference, pages 317–320. ACM, 1999. 3. Zack Newsham, Vijay Ganesh, Sebastian Fischmeister, Gilles Audemard, and Laurent Simon. Impact of community structure on SAT solver performance. In 17th International Conference on Theory and Applications of Satisfiability Testing (SAT), Vienna, Austria, 2014. 4. C. Ansotegui, J. Giraldez-Cru, and J. Levy. The community structure of SAT formulas. In Theory and Application of Satisfiability Testing - SAT 2012, pages 410–423. Springer, 2012. 5. Aaron Clauset, Mark EJ Newman, and Cristopher Moore. Finding community structure in very large networks. Physical review E, 70(6):066111, 2004. 6. Wangsheng Zhang, Gang Pan, Zhaohui Wu, and Shijian Li. Online community detection for large complex networks. In Proceedings of the Twenty-Third international joint conference on Artificial Intelligence, pages 1903–1909. AAAI Press, 2013. 7. M. E. J. Newman and M. Girvan. Finding and evaluating community structure in networks, 2003. http://arxiv.org/pdf/cond-mat/0308217.pdf, last viewed December 2013. 8. Tomihisa Kamada and Satoru Kawai. A general framework for visualizing abstract objects and relations. ACM Trans. Graph., 10(1):1–39, January 1991. 9. Thomas MJ Fruchterman and Edward M Reingold. Graph drawing by force-directed placement. Software: Practice and experience, 21(11):1129–1164, 1991. 10. SAT competition 2013, 2013. http://satcompetition.org/2013/, last viewed January 2014. 11. Z. Newsham, W. Lindsay, J. Liang, V. Ganesh, and K. Fischmeister, S.and Czarnecki. Satgraf sat formula visualization tool. http://bitbucket.org/znewsham/satgraf. 12. Z. Newsham, W. Lindsay, J. Liang, V. Ganesh, and K. Fischmeister, S.and Czarnecki. Satgraf structure source. http://bitbucket.org/znewsham/satlib. 13. Z. Newsham, W. Lindsay, J. Liang, V. Ganesh, and K. Fischmeister, S.and Czarnecki. Satgraf visualisation executable. https://bitbucket.org/znewsham/satgraf/downloads/satgraf.zip. 14. Kyo C Kang, Sholom G Cohen, James A Hess, William E Novak, and A Spencer Peterson. Feature-oriented domain analysis (FODA) feasibility study. Technical report, DTIC Document, 1990. 15. Z. Newsham, W. Lindsay, J. Liang, V. Ganesh, and K. Fischmeister, S.and Czarnecki. Satgraf: Results, 2014. http://satbench.uwaterloo.ca/satgraf/index, last viewed January 2015. 16. T. Taiwan and H. Wang. Minipure, 2013. http://edacc4.informatik.uniulm.de/SC13/solver-description-download/134, last viewed January 2014. 17. Niklas Een and Niklas S¨ orensson. Minisat: A SAT solver with conflict-clause minimization. SAT, 5, 2005. 18. Carsten Sinz and Edda-Maria Dieringer. DPvis–a tool to visualize the structure of SAT instances. In Theory and Applications of Satisfiability Testing, pages 257–268. Springer, 2005. 19. Carlo Nicolini and Michele Dallachiesa. Graphinsight: An interactive visualization system for graph data exploration. http://www.graphinsight.com. 20. Ezequiel Orbe, Carlos Areces, and Gabriel Infante-L´ opez. isat: structure visualization for SAT problems. In Logic for Programming, Artificial Intelligence, and Reasoning, pages 335–342. Springer, 2012.
21. A. Bilgin, J. Ellson, E. Gansner, O. Smyrna, Y. Hu, and S. North. Graphviz - graph visualization software. http://www.graphviz.org/.