Research Article,
ISSN 2304-2613 (Print); ISSN 2305-8730 (Online)
Satisfaction and Service Quality of Using High-Speed 4G Wireless Broadband in University Campus Norzaidi Mohd Daud1, Mohd Adi Mohd Kamal2, Mohd Zuhair Zaharudin3, Yang Haniza Jumhar4, Intan Salwani Mohamed5* 1Faculty
of Business Management, Universiti Teknologi MARA, 40450 Shah Alam, Selangor, MALAYSIA Ayub Graduate Business School, Universiti Teknologi MARA, 40450 Shah Alam, Selangor, MALAYSIA 5Accounting Research Institute & Faculty of Accountancy, Universiti Teknologi MARA, 40450 Shah Alam, Selangor, MALAYSIA 2,3,4Arshad
*
E-mail for correspondence:
[email protected]
https://doi.org/10.18034/abr.v8i2.156
ABSTRACT This paper aims to examine customers’ satisfaction with the product service quality rendered by highspeed 4G wireless broadband (YES!) and YES! Campus Store. 161 of 300 students were engaged from numerous faculties at Universiti Teknologi MARA, Shah Alam, Selangor, Malaysia. Based on a survey, this study suggested that tangibility, reliability, responsiveness, assurance, and empathy produce negative results. It shows that the service rendered by YES! does not meet the expectation of customers’ satisfaction. This paper draws attention to the importance of having high-speed 4G wireless broadband in the campus as its impact on customers’ satisfaction as well as service quality at YES! campus store. Key words: Customers’ satisfaction, service quality, high speed internet, 4G wireless broadband, UiTM campus
INTRODUCTION The use of the internet, especially wireless broadband, has become interestingly vital in higher education. In a pursuit to this advancement, YTL Communication (an arm of YTL Corporation) launched its Education Partner Programme (EPP), which is a strategic initiative and cooperation between YTL Corporation and selected public and private universities in Malaysia (YTL Power International, 2011). According to the report, this strategic alliances are designed to cater each student a high-speed 4G wireless broadband connection with the provision of specific data and voice service for three years, free of charge. However, the current crop of varsity students (mostly from Generation Y trait) is different than what the previous generation has seen. Not only do they are more technologyattached and technologically-reliant for information (Pricewaterhoouse Cooper, 2010), they are also picky when it comes to those two. It is worth noting that as the internet is in the verge of advancement, Generation Y or also known as the Millenials, were born and brought up alongside it thus molding their mindset and perspective in life differently than their forefathers (Muhammad Nizam and Mohd Rozaini, 2010). This particular cohort is individualistic; they would buy and hang on only to Copyright © CC-BY-NC 2014, Asian Business Consortium | ABR
products or brands that could integrate well in their lifestyle and of proven quality (KPMG International, 2010.), i.e., Napster, iTunes, iPads, and Facebook. Statistics show that 21 percent of Gen Y owns a hand-held computer (e.g., iPhone or BlackBerry), 100 percent has a mobile phone, and 96 percent has a social network profile (Pricewaterhouse Cooper, 2010). Kueh & Boo (2007), in a related matter, has discovered that this segment is low in power distance and therefore likely to have high service expectations, especially with numerous options available in the market. Thus it is imperative for the broadband service provider to understand and constantly gauge this particular market segment’s expectation and satisfaction in order to remain competitive in this market segment. Moreover, a majority of previous studies concerning service quality gaps in broadband service provider are scarce (Siew et al., 2011). This scarcity is especially true in the Malaysian context, where the marketing aspect of the broadband service provider only focuses on the promotion aspect and its service technicality (Siew et al., 2011). In addition to that, there is yet a study conducted in the area of service quality of YES broadband service in the industry or education institution (Mohd Mansur, 2012). Bilateral relationship between YES Communications and selected higher
Page 75
Daud et al.: Satisfaction and Service Quality of Using High-Speed 4G Wireless Broadband in University Campus
(75-82)
education institutions is hoped to capture more market share especially the youngsters (Mohd Mansur, 2012). However, through EPP-UiTM initiative, it was reported that only 3,000 users out of the 45,000 allocated users in UiTM are active users, which the management suggests either they are not interested of using YES wireless broadband service, which they could activate for free, dissatisfied or influenced by negative remarks with regards to the service quality provided under the EPP-UiTM initiative (Mohd Mansur, 2012). In addition to that, UiTM Campus Store which was set up to cater these UiTM student-users has also seen a drastic reduction in traffic and return buyers which according to the management team, is a worrying sign (Mohd Mansur, 2012). During their first quarter of the establishment of the Campus Store, dozens of students stopped by for various purchasing reasons daily, but now only less than half dozen visitors came to the store per day.
Service quality
Based on these grounds, the objective of this research is to examine customers’ satisfaction on the product service quality rendered by YES! and its Campus Store; as well as to analyze the extent to which the tangibility, reliability, adaptability, responsiveness and empathy elements of the service contribute to customer satisfaction.
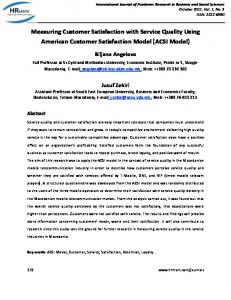
There are seven gaps in the service quality model. The model derives from an extension of Parasuraman et al. (1998). This model gauges the gaps between the Perception and Expectation of services received. These gaps, according to Parasuraman et al. (1998), can help managers and organizations to analyze where to target and prioritize improvement efforts for the best results. The gaps, according to Parasuraman et al. (1998) and the possible reasons for the gaps are as such;
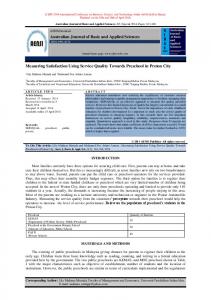
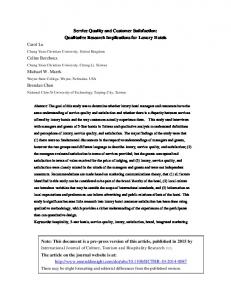
REVIEW OF LITERATURE Customer Satisfaction Many researchers have looked into the importance of customer satisfaction. Kotler (2000) defined satisfaction as “a person’s feelings of pleasure or disappointment resulting from comparing a product are perceived performance (or outcome) in relation to his or her expectations.” Hoyer and MacInnis (2001) said that satisfaction is associated with feelings of acceptance, happiness, relief, excitement, and delight. There are many factors that affect customer satisfaction. According to Hokanson (1995), they include friendly employees, the accuracy of billing, timeliness, competitive pricing, service quality, good value, billing clarity and quick service. On the other hand, Parasuraman et al. (1998), states that to measure customer satisfaction through service quality, dimensions could include tangible, responsiveness, assurance, reliability and empathy. No matter how the dimensions are put forth to gauge customer satisfaction, it still plays a large role in determining the impact and profit to the company.
Figure 1: Factors that affect customer satisfaction (Hokanson, 1995)
Page 76
Service quality is a concept that has aroused considerable interest and debate in the research literature because of the difficulties in both defining it and measuring it with no overall consensus emerging on either (Wisniewski, 2001). One that is commonly used defines service quality as the extent to which a service meets customer needs or expectations (Lewis & Mitchell, 1990; Dotchin & Oakland, 1994; Asubonteng et al., 1996; Wisniewski & Donelly, 1996). Service quality can be thus defined as the difference between customers’ satisfaction of service and perceived service. If expectations are greater than performance, then perceived quality is less than satisfactory and hence customer dissatisfaction occurs (Parasuraman et al., 1998; Lewis & Mitchell, 1990). The Service Quality Gap Model
Gap 1: Customers’ expectations versus management perception: as a result of a marketing research orientation, inadequate upward communication and too many layers of management.
Gap 2: Management perceptions versus service specifications: as a result of the inadequate commitment to service quality, perception of unfeasibility, inadequate task standardization and an absence of goal setting.
Gap 3: Service specifications versus service delivery: as a result of ambiguity and conflict, poor employee-job fit and poor technology –job fit, inappropriate supervisory control systems, lack of perceived control and lack of teamwork.
Gap 4: Service delivery versus external communication: as a result of inadequate horizontal communications and propensity to overpromise.
Gap 5: The discrepancy between customer expectations and their perceptions of the service delivered: as a result of the influence exerted from the customer side and the shortfalls (gaps) on the part of the service provider. In this case, customer expectations get influenced by the extent of personal needs, word of mouth recommendation and past service experiences.
Gap 6: The discrepancy between customer expectations and employees’ perceptions: as a result of the differences in the understanding of customer expectations by frontline service providers.
Gap 7: The discrepancy between employees’ perceptions and management perceptions: as a result of the differences in the understanding of customer expectations between managers and service providers.
Asian Business Review ● Volume 8 ●Number 2/2018
Research Article,
ISSN 2304-2613 (Print); ISSN 2305-8730 (Online)
Three important gaps, which are more associated with the external customers are Gap 1, Gap 5, and Gap 6, seeing that these gaps have a direct relationship with customers. There were three different studies conducted by Shahin
(2008), Siew et al. (2011) and Wolfe (2011) that only examines Gap 5, which is to see the expectation and perception side of customers on the service provided by broadband users, hence it is adapted in this research.
Figure 2: The service quality gap model (Parasuraman et al., 1985)
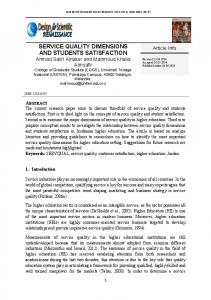
RESEARCH METHODOLOGY Research framework A framework was adapted from the literature review, which utilizes the SERVQUAL model as follows:
The research framework used was adapted from several sources namely, Parasuraman et al. (1958), Siew et al. (2011) and Wolfe (2011). The framework utilizes the SERVQUAL model, which has been modified in its dimension measurements to suit the research. The independent variables are the service quality itself with dimensions to measure the service quality; tangibility, reliability, responsiveness, assurance and empathy. The dependent variable is the customer satisfaction which is closely affected by service quality. Tangibility
Figure 3: Research Framework Copyright © CC-BY-NC 2014, Asian Business Consortium | ABR
Tangibility in this research deals with the physical aspects of YES! wireless service provider in UiTM namely, the facility, personnel and communication materials. This dimension views how the physical aspects of the company influence the customer satisfaction. For example, the materials used to convey information such as leaflets, the visual aspect of the physical store in UiTM, and the appearance of the staff.
Page 77
Daud et al.: Satisfaction and Service Quality of Using High-Speed 4G Wireless Broadband in University Campus
Reliability Reliability in this research is the ability of the YES! staff to perform the promised services rendered to the customers dependently and accurately. It measures timeliness, information conveyance, skills and knowledge to deliver service to its best standard. Responsiveness Responsiveness in this research deals with the willingness of the YES! staff to assist the customers in delivering prompts services. Assurance Assurance in this research reflects the courtesy of the YES! staff the ability to inspire, trust and confidence. It measures the ability of the staff to convey the feeling of security and trust when dealing with customers. Empathy Empathy in this research reflects the individualized attention and care of the staff for its customers. It reflects the ability of staff to deliver a personal touch with the customers when a deal, transaction, or service when rendered. Survey instrument The survey instruments used in this research is a questionnaire. Questionnaire design is an important stage in formulating a research design. A questionnaire that is called a schedule, interview form or measuring instrument is a formalized set of questions for obtaining information from respondents. A set of questions that were designed to generate the data is necessary to ensure in accomplishing the objectives of the research paper. Interval scales were used to measure the respondents’ perception, expectation, and satisfaction based on 5 point scales, which are: 1- Totally disagree; 2- Disagree; 3- Neither agree nor disagree; 4- Agree; and 5- Totally Disagree (Wisniewski (2001), Siew et al (2011), and Wolfe (2011) The questionnaire on the other hand, has four sections which are designed to gauge and collect related data from the respondents. It is separated into four sections as follows: Section A: Demography This section consists of 3 questions whereby respondents are asked about their general information such as gender, age and field of study. Section B: Service Quality Expectation Based on the Interval Scale of “totally disagree” to “totally agree”, section B lists out 22 questions distributed between five SERVQUAL elements and the respondents were given an option to answer based on their expectation
Page 78
(75-82)
on the subject matter; adapted from Siew et al. (2011) and Wolfe (2011). Section C: Service Quality Perception This section is very much similar to Section B with some improvements to gauge the respondents’ perception. The difference is the questions were constructed to obtain the respondents’ opinion on the service quality provided by YES from their experience; adapted from Wisniewski (2001) and Parasuraman et al. (1998). Section D: Customer Satisfaction There are six questions posed in this section to gain an understanding of the respondents’ satisfaction on the overall service quality rendered by YES; adapted from Siew et al. (2011) and Hokanson (1995). Interval scale was used entirely in the questionnaire which involves sections that need respondents’ expectation, perception, and satisfaction on the subject matter for this research. The interval scale has five response categories ranging from “totally disagree” to “totally agree”. Only one section uses a Dichotomous scale which was to gauge the respondents’ demography information. Sampling techniques Sampling techniques may be classified as either nonprobability or probability. This research has used a nonprobability sampling technique which is selected by chance – the most used and suitable technique for SERVQUAL studies on telecommunication industry (Siew et al., 2011; Wolfe, 2011). Usage of this type of sampling is due to the nature of research itself that is less concerned with the generalization of population. In this study, the sampling consists of 300 students that were also users of the YES wireless broadband (also known as YES UiTM student-users) that patronize the YES Universiti Teknologi MARA (UiTM) Campus Store. Student intercept method is used during data collection, whereby respondents were approached and intercepted in and around the vicinity of the UiTM, Shah Alam, Selangor, Malaysia. Procedure and data analysis All the data from the questionnaires were keyed-in and analyzed through computer software called Statistical Package of Social Science (SPSS). The process of data analysis commences once all the data were successfully collected. The process started with data coding and data entry based on the questionnaires. Raw data were analyzed using Cronbach’s Alpha to ensure the significance of items in each variable is positively correlated. Frequency analysis was used to analyze the demographic profile, and descriptive analysis was used to analyze the main feature of the sample measures which is the expectation, perception, and satisfaction.
Asian Business Review ● Volume 8 ●Number 2/2018
Research Article,
ISSN 2304-2613 (Print); ISSN 2305-8730 (Online)
DATA ANALYSIS Demographic Profile From the total amount of 300 respondents, only 161 respondents completed the questionnaire. In short, 42 (26.1%) of the respondents are male, and 119 (73.9%) are female. From that amount of respondents, 16.8 percent are below 21 years old, 21 to 25 represent about 53.4 percent, 26.7 percent are within the age of 26 to 30 years old, and the rest 3.1 percent represent 30 years old and above. As for the field of study, majority of the respondents are Business and Administration students who represent 34.8 percent (56 respondents), 12.4 percent are Engineering students, 9.9 percent are Law students, followed by 8.7 percent are Medical students, Architecture, Surveying and Planning, together with Communication and Media Studies at 8.1 percent, students of Other fields 6.8 percent, and the smallest portions are Arts and Design students, 5.0 percent. Reliability test Reliability can be expressed in terms of stability, equivalence, and consistency. Consistency check, which is commonly expressed in the form of Cronbach’s Coefficient Alpha is a popular method. A coefficient alpha or better known as Cronbach’s Alpha is often used to measure reliability. A value of 0.700 or more generally suggests an acceptable level of reliability of the instrument used (Nunnaly, 1978). The purpose of the test is to indicate the degree of reliability towards certain major variables used in this study, namely Tangibility/Physical aspect, Reliability, Responsiveness, Assurance, and Empathy by referring to the Cronbach’s Alpha values obtained from this test. All the variables consisting of Tangibility, Reliability, Responsiveness, Assurance and Empathy having Alpha values more than 0.7 suggests acceptable level of reliability. Gap analysis
Reliability The staff promises to do something and deliver at 4.24 the promised time. The staff is to perform the service right the first 4.18 time. The staff is equipped with necessary skills to 4.40 deliver service. The staffs are knowledgeable in 4.35 services provided. The staffs are dependable in handling customers’ 4.36 service problems. Responsiveness The staff informs the customer exactly when 4.40 services will be delivered. The customer is given prompt service from 4.14 staff. The staffs are never too busy to respond to the 4.17 customers’ request. The staffs are always 4.39 willing to help. Assurance The staff inspires confidence in the 4.30 customers. The customer feels secure 4.17
3.80
-0.44
3.84
-0.34
3.87
-0.53
3.94
-0.41
3.94
-0.42
3.66
-0.74
3.61
-0.53
3.72
0.45
3.80
-0.59
3.67
-0.63
3.54
-0.63
4.42
3.84
-0.58
4.38
3.78
-0.60
4.29
3.83
-0.46
4.37
3.80
-0.57
4.25
3.72
-0.53
4.32
3.71
-0.61
4.34
3.75
-0.59
when dealing with the staff.
The staffs are consistently polite in dealing with the customers. The staffs have adequate knowledge to address customers’ problems.
Empathy
Gap analysis is used to determine the perceived importance and satisfaction on each dimension of service quality. Table 1: SERVQUAL Score Breakdown Mean SERVQUAL Service Quality Score ExpectationPerception Dimensions (P-E) (E) (P) Tangibility/Physical aspect The YES! campus store is 4.02 3.64 -0.38 visually attractive The YES! campus store staff is of neat 4.06 3.62 -0.44 appearance. The materials associated with the service have 4.15 3.65 -0.5 good visual appearance. Materials associated with the service are 4.32 3.67 -0.65 informative.
Copyright © CC-BY-NC 2014, Asian Business Consortium | ABR
The staffs always give the customers’ individual attention. The staffs display personal warmth in their behavior. The staffs always have the customers’ best interest at heart The staffs always understand the specific needs of the customers. The YES! Campus Store operates according to the business hours that are convenient to the customers.
The gaps presented in Table 1 are calculated according to the SERVQUAL score calculation from Parasuraman et al. (1998).
Page 79
Daud et al.: Satisfaction and Service Quality of Using High-Speed 4G Wireless Broadband in University Campus
SERVQUAL score is measured through the difference between the customer Perception and Expectation (SERVQUAL score=Perception – Expectation). The higher the positive score obtained, the better will be the Service Quality. From Table 1, all of the items are of negative value, which states that none of the items reaches the customers’ expectation level. From the findings of the analysis, it is found that the three elements that scored the lowest are under Responsiveness (“The staff informs the customer exactly when services will be delivered.”) at -0.74, followed by “Materials associated with the service are informative”, under Tangibility/Physical Aspects (-0.65), and two elements in the Assurance section, (“The staff inspires confidence in the customers”; “The customer feels secure when dealing with the staff “) which scores a sum of -0.63 respectively. The three highest scores in the gap analysis are under the Reliability section (“The staff is to perform the service right the first time. “) at -0.34, followed by Tangibility/Physical Aspects (“The YES! campus store is visually attractive”) at 0.38, and the last highest score for the gap analysis is “The staffs are knowledgeable in services provided.” , (-0.41), which falls under Reliability. Table 2: SERVQUAL Score Overall Service Quality Dimensions Tangibility/ Physical aspect Reliability Responsiveness Assurance Empathy
Mean SERVQUAL Score Expectation Perception (P-E) (E) (P) 4.14
3.64
-0.50
4.30 4.27 4.32 4.31
3.88 3.70 3.71 3.76
-0.42 -0.57 -0.61 -0.55
The above table 2 shows the overall sum of the SERVQUAL score, pinpointing the expected and perceive gap scores of the customer satisfaction. The lowest score attributed to the Assurance dimension (-0.61), followed by Responsiveness (0.57) and Empathy (-0.55). The two lowest of the scores are from the Tangibility/Physical aspect (-0.50) and lastly at 0.42, Reliability. This result shows that the reliability aspect of YES! wireless internet service provider does not run far from the expectation and perception of the customer, whereas the Assurance aspect is far from the expected and perception of the customers.
FINDINGS OF THE STUDY This study has empirically validated the adapted framework. All of the variables as suggested by the SERVQUAL model has been proven to have significant relationship and justified the purpose of this research. Several analyses have been done to understand customer satisfaction of UiTM students toward YES! wireless broadband internet provider, such as frequency analysis, reliability test, and gap analysis. The findings derived from the analysis of this research has pointed out that, on hindsight, the customers are not satisfied with the services provided by YES! broadband internet provider based on five elements, tangibility, reliability, responsiveness, assurance and empathy.
Page 80
(75-82)
Tangibility Results from the questionnaire point out that the materials associated with the service are not informative to have the highest gap score amongst all the other questions. Materials in this equation have been found to be of a wrong target audience as it is not directed for the target customers, who are students of UiTM. The materials may be targeted to a larger, more general target audience, thus distorting the understanding by students. As such, this research would recommend that YES! materials, especially pamphlets, should be tailored to suit the understanding of the students. For example, the pamphlets should address the benefits or packages that are being offered exclusively for students, i.e., the free student account, free RM 9 credits monthly, and no commitment period. This design could prove to be more informative to the students, and close the gap between their expectation and perception of the service. The second problem that should be addressed is on the location of the physical store. The location of the store is currently in Dataran Cendekia, UiTM Shah Alam. The store itself of not at a good location as it is, in terms of traffic, overshadowed by Bank Islam ATM, seeing that the store shares a building with the ATM. This disadvantage hinders the ability of the customers to identify where the store is located, and inconvenience for patrons as they have to walk through the ATM, which is usually full of people. This research recommends YES! to have their own, standalone store in Dataran Cendekia, that has easy access and would be visible to students. A new store location would provide the store with three advantages; 1) easier and fast to locate by the customers, 2) easy access to customers and 3) able to serve a large number of customers at any one time. Research undertaken by Suradi et al. (2008), points out to the almost same situation as the relocation of the YES! campus store. According to his research, moving a store or a business that is visible, and provides ease of access is of paramount importance to the business for it to function. Apart from having attractive banners or signage, having a store that is visible, physically, could help a business to flourish. Reliability Reliability deals with the ability of the staff to perform a promised task dependably and accurately. Findings show that the expectation of customers towards staffs, especially the staffs skills and delivery service, is not at par with what the customer received. Further investigation reveals that the customers are not happy when inquiries that they ask the staffs were not responded with appropriate service as they would have expected. This situation creates dissatisfaction among customers. This research would recommend more comprehensive training to help staff understand the customers, how to deliver the service in a manner of professionalism, and efficiency in delivering services. There is already a training program for recruits on products and services, which extends to billing, product activation and top up services, but those trainings are only limited to understanding their product and services, not on the customer (soft skills). Benefits of employee training have already been widely recorded in the literature. Lai (2010) stated that the main aim of
Asian Business Review ● Volume 8 ●Number 2/2018
Research Article,
ISSN 2304-2613 (Print); ISSN 2305-8730 (Online)
T&D is to help employees become better at their tasks, their knowledge, their experiences, and their lives to satisfy the current and future manpower needs of the organization. Lai (2010) listed few other definitions in his study, including “activities or deliverables designed to enable end users to learn and use new processes, procedures, systems and other tools efficiently and effectively in the performance of their work; includes training, documentation and communications” and “the planned and organized activity of a consultant to impart skills, techniques and methodologies to employers and their employees to assist them in establishing and maintaining employment and a place of employment which is safe and healthful”. Development refers to the growth of realization of a person’s ability, through conscious or unconscious learning (Lai, 2010). Lai (2010) argued that the most appropriate model of T&D would depend on contextual characteristics and contingencies of particular organizations. The maturity and existing organizational culture will most likely affect T&D strategy. Responsiveness Responsiveness, the willingness of the staffs to help customers and provide prompt service sees a negative value for each of its elements, derived from the questionnaire. It was found that the staff did not inform customers on the time basis or allotted time for service to be rendered. Looking from the staff point of view, the lead time of service rendered depends on their support staff in the headquarters, which varies depending on the task. As such, no lead time or “promised” is given to the customers. This research recommends that tasks that require contacting support staff in headquarters to be moved to onlocation, or the store itself. Example of the service that could be moved to the stores is billing payment, troubleshooting, and product activation. This shift could minimize the lead time, and enable the staff to provide on-the-spot advice to its customers. It would then lead to a better perception of the customers being served. The next issue in responsiveness is the willingness of the staff to help the customers. From observation, it was found that the store has limited number of staffs, and when there are a number of customers to be entertained, the staffs are not able to offer help all of the customers. YES! should revise on the number of staffs needed at the store, or revised their operational system, for example, by having a queue-numbering system, which could enable the staff to entertain all of their customers and lower customer dissatisfaction or frustration. Assurance Assurance deals with the ability of the staff to inspire trust and confidence apart from their knowledge and courtesy. Through previous studies (Ahuja et al., 2011, Randheer et al., 2011), it was found that assurance has the biggest difference between expectation and perception, which has again be proven in the findings of this research. Findings suggest that the ability of the staff to inspire trust and confidence is lacking. To close the gap between expectation and perception of assurance, it is imperative that YES! conduct a training on customer relationship management. To inspire trust and confidence is a very subjective matter; hence it is hard to put a specific recommendation on it, as implied by studies by Parasuraman et al. (1998), Wolfe (2011), and Rowley (1997). Copyright © CC-BY-NC 2014, Asian Business Consortium | ABR
Empathy Empathy deals with individualized attention and care given to the customers. It was found that staff does not understand the specific needs of the customers, resulting in poor customer satisfaction from customers. To overcome these problems, YES! needs to emphasize on their customer relationship management strategy, where they should focus on improving in-depth understanding of consumer motivation and lifestyle factors. It was also found that the operating hour of the store does not suit the needs or inconvenient for customers to be one of the highest negative scores in the empathy category. The store is open from 10 am – 5 pm, on weekdays, and closes on the weekend. This operation hour does not suit well to customers who are students, where weekends are the only day of the week that they do not have classes, and where the student attends to their personal errands. YES! should keep their store open from 10 am until 10 pm, emulating current practices of other YES! stores which operate at shopping malls.
CONCLUSION This research has been conducted to understand customers’ satisfaction towards YES! wireless broadband internet service. This research has adapted the SERVQUAL and gaps analysis, pioneered by Parasuraman et al. (1998), which is to measure customers’ satisfaction regarding their expectation and perception, which corresponds to the gap 5 of the gaps analysis (Wolfe, 2011; Gumesson, 1994). The dimensions that were used to gauge customers’ expectation and perception are through tangibility, reliability, responsiveness, assurance, and empathy (Parasuraman et al., 1998). Several tools have been used to retrieve the findings derived from the framework and questionnaire, such as descriptive, frequency, reliability test and SERVQUAL score. Results from the findings show that the customers’ satisfaction towards the service provided by YES! is low, marked by the negative scores throughout the SERVQUAL scores. Recommendations have been given to close the gaps and increase customer satisfaction, such as having a new store, knowledgeable staffs, and training of staffs to cater to the customers’ needs. The findings have also been justified by a representative of the company, which supports the recommendation given. Looking at the outcomes, it is important to the industry players and most of all, to YES! to rectify the shortfalls and strategize to improve on their service. The result of this study will have important implications and is believed to be very useful for the broadband internet service provider in Malaysia, to better understand and formulate strategies to tackle customers’ satisfaction. In an academic point of view, this research has managed to point out the significant factors that contribute to the customers’ satisfaction towards YES! broadband internet service. Also, this research provides comparison to other research on customer satisfaction in broadband internet service. The result of this research would benefit YES! in understanding customers’ satisfaction towards the service that they provide. The market that YES! is venturing into are of the Gen Y. This Gen Y has different approaches to fulfill their satisfaction, thus understanding their needs through the dimensions of service quality as highlighted by Parasuraman et al. (1998). YES! could come out with different strategies to target this market, such as
Page 81
Daud et al.: Satisfaction and Service Quality of Using High-Speed 4G Wireless Broadband in University Campus
(75-82)
highly appealing stores, highly knowledgeable and approachable staff, could appeal to this generation, thus capturing a stronger foothold for their products and services.
Lewis, R. C., & Booms, B. H. (1983). The marketing aspects of service quality. Chicago, Illinois: American Marketing Association.
Findings of this study are especially important to policy implications on service quality, as wireless service has a special niche target, which is the Millenials. They are a unique breed that could not be bothered with restrictions that the society might have in the past. Hence this research had mainly focus to university students, which makes up a large portion of Millenials to capture appropriate responses that would reflect the whole generation being studied. This research has been majorly conducted on the environment of YES! campus store in Shah Alam, Malaysia. Most Asian countries are still developing countries, similar to Malaysia, hence this study can be generalised to the wireless environment of other countries in Malaysia.
Mohd Mansur, B. (2012). YES Wireless Internet Service and its Campus Store. (M. K. Mohd Adi M. K., Mohd Zuhair Z., & Yang Haniza J., Interviewers)
REFERENCES Ahuja, T., Rabis, H. A., & Koleri, S. (2011). The relationships of customer satisfaction, customer loyalty and profitability: an empirical study. International Journal of Service Industry Management , 7 (4), 27-42. Asubonteng, P., McCleary, K. J., & Swan, J. E. (1996). SERVQUAL revisited: a critical review of service quality. Journal of Services Marketing , 10 (6), 62-81. Dotchin, J. A., & Oakland, J. S. (1994). Total quality management in services: Part 2 Service quality. International Journal of Quality & Reliability Management , 11 (3), 27-42. Gabbie, O., & O'Neil, M. A. (1996). SERVQUAL and the northern Ireland hotel sector. A comparative analysis- Part 1. Managing Service Quality , 6 (6), 25-32.
Muhammad Nizam Z. and Mohd Rozaini M.R. (2010). Assessing "ME Generation's" entrepreneurship deree programmes in Malaysia. Education + Training, Vol.52, 508-527. Nunnaly, J. C. (1978). Psychometric Theory. New York: McGraw-Hill. Parasuraman, A., Zeithaml, V. A., & Berry, L. L. (1998). A conceptual model of service quality and its implications revisited. Journal of Marketing , 60 (3), 41-50. Pricewaterhouse Coopers (2010). Malaysia's Gen Y unplugged. Malaysia: PricewaterhouseCoopers Advisory Services Sdn Bhd. Randheer, J., Kumaran, V. S., & Ratmana, J. (2011). Measurement of service quality in Internet banking: the development of an instrument. Journal of Marketing and Management , 20, 185-207. Rowley, C. (1997). SERVQUAL" review, critique, research agenda. European Journal of Marketing , 30 (1), 8-32. Shahin, A. (2008). SERVQUAL and Model of Service Quality Gaps: A framework for Determining and Prioritizing Critical Factors in Delivering Quality Services. Journal of International Marketing , 6 (4), 23-79. Siew, P. L., Taiwo, A. A., Hanisah, M. S., & Downe, A. G. (2011). Service Quality and Customer Satisfaction in a Telecommunication Service Provider. International Conference on Financial Management and Economics. 11, pp. 2429. Singapore: IACSIT Press.
Gronroos, C. (1982). Strategic Management and Marketing in the Service Sector. Swedish School of Economics and Business Administration , pp. 45-50.
Suradi, N. R., Mustafa, Z., Ismail, W., Shahabuddin, F., Ali, Z., & Norkisme, Z. A. (2008). Usage pattern of broadband services among engineering students in higher institution. Seminar Pendidikan Kejuruteraan dan Alam Bina (pp. pp. 1-8). Bangi: Universiti Kebangsaan Malaysia.
Gumesson, I. (1994). Internal customer management and service gaps within the UK manufacturing sector. International Journal of Operations and Production , 14 (9), 45-56.
Van Iwardeen, J., Van der Wiele, T., Ball, L., & Millen, R. (2003). Applying SERVQUAL to websites: An explanatory study. International Journal of Quality & Reliability Management , 20 (8), 919-935.
Hokanson, S. (1995, January 2). The Deeper You Analyse, The More You Satisfy Customers. Marketing News , p. 16.
Venetis, C. (1997). Developing a multidimensional and hierarchical service quality for the travel agency industry. Tourism Management , 29, 706-720.
Hoyer, W. D., & McInnis, D. J. (2001). Consumer Behaviour (2nd Edition ed.). Boston: Houghton Mifflin Company. Kotler, P. (2000). Marketing Management (10th Edition ed.). New Jersey: Prentice-Hall. KPMG International. (2010). Broadband wireless access in Asia Pacific: From opportunity to profitability. KMPG International. Kueh, K., & Boo, H. V. (2007). Culture and service quality expectations: Evidence from Generation Y consumers in Malaysia. Managing Service Quality, Vol. 17, No. 6. Lai, M. (2010, March).
[email protected] and its NA for wireless broadband. My Convergence, pp. 49-51. Lewis, B. R., & Mitchell, V. W. (1990). Defining and measuring the quality of customer service. Marketing Intelligence & Planning , 8 (6), 11-17.
Page 82
Wisniewski, M. (2001). Using SERVQUAL to access the customer satisfaction with public sector services. Managing Service Quality , 11 (6), 380-388. Wisniewski, M., & Donnelly, M. (1996). Measuring servie quality in the public sector: the potential for SERVQUAL. Total Quality Management , 7 (4), 357-365. Wolfe, J. D. (2011). Analyzing the quality performance gap of the Telesur broadband services. Journal of Management and Finance , 4 (3), 26-37. Yaacob, D. M. (2008). SPSS for Business and Social Science Students. Kota Bharu, Kelantan: Pustaka Aman Press Sdn. Bhd. . YTL Power International. (2011). YTL Power International Annual Report 2011. Kuala Lumpur: YTL Power International.
--0--
Asian Business Review ● Volume 8 ●Number 2/2018