Application-level monitoring, e.g., provided by Kieker, can help with the ... In long running software systems, knowledge of the internal structure and behavior of.
Scalable and Live Trace Processing with Kieker Utilizing Cloud Computing Florian Fittkau, Jan Waller, Peer Brauer, and Wilhelm Hasselbring Department of Computer Science, Kiel University, Kiel, Germany {ffi,jwa,pcb,wha}@informatik.uni-kiel.de Abstract: Knowledge of the internal behavior of applications often gets lost over the years. This circumstance can arise, for example, from missing documentation. Application-level monitoring, e.g., provided by Kieker, can help with the comprehension of such internal behavior. However, it can have large impact on the performance of the monitored system. High-throughput processing of traces is required by projects where millions of events per second must be processed live. In the cloud, such processing requires scaling by the number of instances. In this paper, we present our performance tunings conducted on the basis of the Kieker monitoring framework to support high-throughput and live analysis of application-level traces. Furthermore, we illustrate how our tuned version of Kieker can be used to provide scalable trace processing in the cloud.
1
Introduction
In long running software systems, knowledge of the internal structure and behavior of developed applications often gets lost. Missing documentation is a typical cause of this problem [Moo03]. Application-level monitoring frameworks, such as Kieker [vHRH+ 09, vHWH12], can provide insights into the communication and behavior of those applications by collecting traces. However, it can cause a large impact on the performance of the system. Therefore high-throughput trace processing, reducing the overhead, is required when millions of events per second must be processed. In this paper, we present our performance tunings conducted on the basis of the Kieker monitoring framework to support high-throughput and live analysis of application-level traces. Furthermore, we present a scalable trace processing architecture for cloud environments and provide a preliminary evaluation, demonstrating the live analysis capabilities of our high-throughput tuned version. In summary, our main contributions are (i) a high-throughput tuning of Kieker, enabling live trace analysis and (ii) a scalable trace processing architecture for cloud environments. The rest of the paper is organized as follows. Our trace processing architecture for enabling a scalable processing of traces in the cloud is presented. Afterwards, in Section 3 our highthroughput tuned Kieker version is described. In Section 4, we illustrate our preliminary performance evaluation. Then, related work is sketched. Finally, the conclusions are drawn and future work is described.
Cloud
ClientWorkstation ExplorViz
ApplicationNodes Applications SLAsticNode Kieker.Monitoring
SLAstic AnalysisWorkerLoadBalancer
ExplorVizServer
AnalysisWorkerNodes
AnalysisWorker
MQProvider
ExplorVizServerNode
LandscapeModelRepository
AnalysisMaster
Kieker.Monitoring ModelDatabase
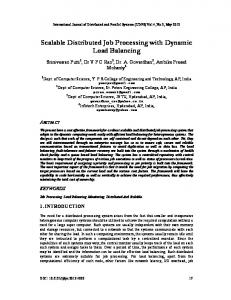
Figure 1: Overview on our general trace processing architecture
2
Scalable Trace Processing Architecture
In this section, we present our trace processing architecture to enable scalable and live trace processing. The basic deployment architecture of our scalable trace processing is described in Section 2.1. In Section 2.2, the concept behind our approach of providing scalability by utilizing analysis worker chaining is illustrated.
2.1
Basic Approach
Figure 1 depicts our trace processing architecture. The processing starts at the monitored Applications on the ApplicationNodes. Kieker monitors the method and remote procedure calls of the applications and sends the collected monitoring data directly to the AnalysisWorker via a TCP connection. The AnalysisWorker processes the data and sends the reduced traces to the AnalysisMaster on the ExplorVizServerNode. After receiving the data, it updates a model representation of the software landscape and sends the data to a ExplorViz visualization instance running on the client workstation. In addition, the ExplorVizServer saves the processed traces in a ModelDatabase. To create a scalable and elastic monitoring architecture, we utilize the cloud for trace processing. The destination, where Kieker sends the monitoring data to, is fetched from the AnalysisWorkerLoadBalancer servlet running on the SLAsticNode. SLAstic [vMvHH11] updates the AnalysisWorkerLoadBalancer servlet when a new analysis worker node is started or terminated due to the over- or underutilization of the analysis worker nodes. For monitoring this utilization, Kieker measures the CPU utilization on each analysis worker node and sends it to the MQProvider on the SLAsticNode. Then, SLAstic fetches the CPU utilization data from this message queue provider.
Visual Paradigm for UML Standard Edition(University of Kiel)
Monitored Application1
AnalysisWorker1
Monitored Application2
AnalysisWorker2
AnalysisWorker5
AnalysisMaster Monitored Application3
AnalysisWorker3 AnalysisWorker6
Monitored Application4
AnalysisWorker4
Figure 2: Example for chaining of analysis workers
2.2
Chaining of Analysis Workers
In our basic approach, all analysis workers write to one analysis master. This can lead to an overutilization of this master and it might become a bottleneck. Therefore, we provide a concept for chaining of analysis workers, such that the analysis master gets unburdened. Instead of writing the data directly to the analysis master, we employ an additional level of analysis workers. Figure 2 illustrates an example for this approach. As described in the last subsection, the Kieker components in the monitored applications write their monitoring data directly to the analysis workers. For simplicity, we call these workers: analysis workers on level one. These, in turn, send their reduced traces and possible parts of traces to the analysis workers on level two. Then, the analysis workers on level two finally send their results to the analysis master. Notably, the levels of chaining are not restricted to one or two. To provide additional scalability, the number of levels is adjustable. Also note, that the number of monitored applications in relation to the number of analysis workers can be an 𝑛 to 𝑚 relationship where 𝑚 is lesser or equal to 𝑛. On each level, the number of analysis workers should be lower than on the level before, such that a reasonable chaining architecture can be constructed. For each level of analysis worker, an own scaling group should be provided, i.e., an own load balancer. Following this approach, SLAstic can be used to scale each group of analysis workers when they get over- or underutilized. Furthermore, SLAstic can be extended to decide whether a new analysis worker level should be opened based on the utilization of the analysis master. In our described chaining architecture, only one analysis master is provided. Extensions with multiple running analysis masters are thinkable but describe another usage scenario and thus are outside of the scope of this paper.
Figure 3: Our high-throughput tuned version of the Kieker.Monitoring component
3
High-Throughput Tunings for Kieker
In this section, we describe our tunings conducted on the basis of Kieker 1.8 to achieve high-throughput monitoring for live monitoring data analysis. First, we present our enhancements to the Kieker.Monitoring component. Afterwards, we describe our tunings of the Kieker.Analysis component.
3.1
Kieker.Monitoring Tunings
In Figure 3, our high-throughput tuned version of the Monitoring component is presented. As in the original Kieker.Monitoring component, the Monitoring Probes are integrated into the monitored code by aspect weaving and collect the method’s information. In our tuned version, we write the information sequentially into an array of bytes realized by the Java native input/output class ByteBuffer. The first byte represents an identifier for the class that is later constructed with these information and the following bytes contain information like, for instance, the logging timestamp. The ByteBuffers are sent to the Monitoring Controller which in turn puts the ByteBuffers into a Ring Buffer. For realizing the Ring Buffer, we utilize the disruptor framework.1 The Monitoring Writer, running in a separate thread, receives the ByteBuffers and writes them to the analysis component utilizing the Java class java.nio.channels.SocketChannel and the transfer protocol TCP. Contrary to the original Kieker.Monitoring component, we do not create MonitoringRecord objects in the probes, but write the data directly into a ByteBuffer. This normally results in less garbage collection and the time for the object creation process is saved. In addition, Kieker 1.8 uses an ArrayBlockingQueue to pass messages from its Monitoring Controller to the Monitoring Writer which causes, according to our tests, more overhead than the Ring Buffer. 1 http://lmax-exchange.github.io/disruptor/
Figure 4: Our high-throughput tuned version of the Kieker.Analysis component
3.2
Kieker.Analysis Tunings
In Figure 4, our high-throughput tuned version of the Analysis component is presented. Similar to the original Kieker.Analysis component, we follow the pipes and filters pattern. The sent bytes are received from the monitoring component via TCP. From these bytes, Monitoring Records are constructed, batched, and passed into the first Ring Buffer. By batching the Monitoring Records before putting them in the Ring Buffer, we achieve a higher throughput since less communication overhead is produced. This overhead is caused by, for instance, synchronization. The Trace Reconstruction filter receives the batches of Monitoring Records and reconstructs the traces contained within. These traces are batched again and are then forwarded into the second Ring Buffer. The Trace Reduction filter receives these traces and reduces their amount by utilizing the technique of equivalence class generation. It is configured to output a trace each second. Each trace is enriched with runtime statistics, e.g., the count of summarized traces or the minimum and maximum execution times. The resulting reduced traces are put into third Ring Buffer. In contrast to the former ones, those traces are not batched before putting into the Ring Buffer, since the amount of reduced traces is typically much smaller and thus the batching overhead would be larger than the communication overhead. If the worker is configured to be an analysis worker, the reduced traces are sent to the Connector This connector then writes them to another chained analysis component, either further workers on the master. If the worker is configured to be an analysis master, the reduced traces are sent to the Repository. Unlike the original Kieker.Analysis component, each filter runs in a separate thread and is therefore connect by Ring Buffers. This design decision is made because every filter has enough work to conduct when millions of records per second must be processed. Furthermore, in our high-throughput tuned version the sequence and kind of filters is limited to the shown architecture configuration instead of being freely configurable as in Kieker. In addition, the connection of additional analysis workers is currently cumbersome in Kieker. Contrary, our high-throughput tuned version enables this behavior out-of-the-box and therefore provides scalability of the trace processing.
Table 1: Throughput for Kieker 1.8 (traces per second)
No instr.
Deactiv.
Collecting
Writing
Reconst.
Reduction
Mean 95% CI
2 500.0k ± 371.4k
1 176.5k ± 34.3k
141.8k ± 2.0k
39.6k ± 0.4k
0.5k ± 0.001k
0.5k ± 0.001k
Q1 Median Q3
2 655.4k 2 682.5k 2 700.4k
1 178.0k 1 190.2k 1 208.0k
140.3k 143.9k 145.8k
36.7k 39.6k 42.1k
0.4k 0.5k 0.5k
0.4k 0.5k 0.5k
4
Preliminary Performance Evaluation
In this section, we present a preliminary performance evaluation of our high-throughput tuned version of Kieker in combination with our trace processing architecture. We perform this evaluation by measuring the amount of traces one analysis worker can process online. Evaluating the scalability and performance of the chained trace processing architecture remains as future work. For replicability and verifiability of our results, the gathered data are available online.2 The source code of our tunings and of our trace processing architecture is available upon request.
4.1
Experimental Setup
For our performance evaluation, we employ an extended version of the monitoring overhead benchmark MooBench [WH12, WH13]. It is capable of quantifying three different portions of monitoring overhead: (i) instrumenting the system, (ii) collecting data within the system, and (iii) writing the data. In the case of live analysis, we can extend the benchmark’s measurement approach for the additional performance overhead of the analysis of each set monitoring data. Specifically, we can quantify the additional overhead of (iv) trace reconstruction and (v) trace reduction within our trace processing architecture. We use two virtual machines (VMs) in our OpenStack private cloud for our experiments. Each physical machine in our private cloud contains two 8-core Intel Xeon E5-2650 (2 GHz) processors, 128 GiB RAM, and a 500 Mbit network connection. When performing our experiments, we reserve the whole cloud and prevent further access in order to reduce perturbation. The two used VMs are each assigned 32 virtual CPU cores and 120 GiB RAM. Thus, both VMs are each fully utilizing a single physical machine. For our software stack, we employ Ubuntu 13.04 as the VMs’ operating system and an Oracle Java 64-bit Server VM in version 1.7.0_45 with up to 12 GiB of assigned RAM. The benchmark is configured as single-threaded with a methodtime of 0 µs, and 4 000 000 measured executions with Kieker 1.8. For our high-throughput tuned version, we increased the number of measured executions to 100 000 000. In each case, we discard the first half of the executions as a warm-up period. 2 http://kieker-monitoring.net/overhead-evaluation
Table 2: Throughput for our high-throughput tuned Kieker version (traces per second)
No instr.
Deactiv.
Collecting
Writing
Reconst.
Reduction
Mean 95% CI
2 688.2k ± 14.5k
770.4k ± 8.4k
136.5k ± 0.9k
115.8k ± 0.7k
116.9k ± 0.7k
112.6k ± 0.8k
Q1 Median Q3
2 713.6k 2 720.8k 2 726.8k
682.8k 718.1k 841.0k
118.5k 125.0k 137.4k
102.5k 116.4k 131.9k
103.3k 116.6k 131.3k
98.4k 114.4k 132.4k
4.2
Results and Discussion
In this section, we describe and discuss our results. First, the throughput is discussed and afterwards, the response times are discussed. Throughput The throughput for each phase is visualized in Table 1 for Kieker 1.8 and in Table 2 for our high-throughput tuned version. In both versions, the no instrumentation phase is roughly equal which is expected since no monitoring is conducted. Our high-throughput tuned version manages to do 770 k traces per second with deactivated monitoring, i. e., the monitoring probe is entered but left immediately. Kieker 1.8 performs significantly better with 1 176 k traces per second. Both versions run the same code for the deactivated phase. We attribute this difference to the change in the number of measured executions with each version. Our tuned version runs 20 times longer than Kieker 1.8 which might have resulted in different memory utilization. As future work, this circumstance should be researched by running 100 million method calls with Kieker 1.8. In the collecting phase, Kieker 1.8 performs 141.8 k traces per second whereby our highthroughput tuned version achieves 136.5 k traces per second which is roughly the same with regards to the different number of measured executions of both experiments. Our high-throughput tuned version reaches 115.8 k traces per second while Kieker 1.8 achieves 39.6 k traces per second in the writing phase. In this phase, our high-throughput tunings take effect. We attribute this improvement of roughly 3 times to the utilization of the disruptor framework and only creating ByteBuffers such that the Monitoring Writing does not need to serialize the Monitoring Records. Notably, the trace amount is limited by the network bandwidth in the case of our high-throughput tuned version. In the trace reconstruction phase, Kieker 1.8 performs 466 traces per second and our tuned version reaches 116.9 k traces per second. We attribute the increase of 1.1 k traces per second in our tuned version to measuring inaccuracy which is confirmed by the overlapping confidence intervals. Our high-throughput tuned version performs about 250 times faster than Kieker 1.8. This has historical reasons since performing live trace processing is a rather new requirement. Furthermore, the results suggest that the pipes and filters architecture of Kieker 1.8 has a bottleneck in handling the pipes resulting in poor throughput. Kieker 1.8 reaches 461 traces per second and our tuned version reaches 112.6 k traces per second in the reduction phase. Compared to the previous phase, the throughput slightly decreased for both versions which is reasonable considering the additional work.
Figure 5: Comparison of the resulting response times
Response Times In Figure 5, the resulting response times are displayed for Kieker 1.8 and our high-throughput tuned version in each phase. The response times for the instrumentation is again slightly higher for our tuned version. In the collecting phase, the response times of both versions are equal (6 µs). Kieker 1.8 has 18.2 µs and our tuned version achieves 1.2 µs in the writing phase. The comparatively high response times in Kieker 1.8 suggests that the Monitoring Writer fails to keep up with the generation of Monitoring Records and therefore the buffer to the writer fills up resulting in higher response times. In contrast, in our high-throughput tuned version, the writer only needs to send out the ByteBuffers, instead of object serialization. In the reconstruction and reduction phases, Kieker 1.8 has over 1 000 µs (in total: 1 714 µs and 1 509 µs), and our high-throughput tuned version achieves 0.0 µs and 0.3 µs. The response times of our tuned version suggest that the filter are efficiently implemented such that the buffers are not filling up. This circumstance is made possible due the utilization of threads for each filter. We attribute the high response times of Kieker 1.8 to garbage collections and the aforementioned bottlenecks in the pipes and filters architecture.
4.3
Threats to Validity
We conducted the evaluation only on one type of virtual machine and also only on one specific hardware configuration. To provide more external validity, other virtual machine types and other hardware configuration should be benchmarked which is future work. Furthermore, we ran our benchmark on a virtualized cloud environment which might resulted in unfortunate scheduling effects of the virtual machines. We tried to minimize this threat by prohibiting over-provisioning in our OpenStack configuration and assigned 32 virtual CPUs to the instances such that the OpenStack scheduler has to run the virtual machines exclusively on one physical machine.
5
Related Work
Dapper [SBB+ 10] is used for Google’s production distributed systems tracing infrastructure and provides scalability and application-level tracing in addition to remote procedure call tracing. Instead of using sampling techniques, Kieker and thus our high-throughput tuned version, uses entire invocation monitoring. Furthermore, we provide a detailed description of our scalable trace processing architecture. A further distributed tracing tool is Magpie [BIMN03]. It collects traces from multiple distributed machines and extracts user specific traces. Then, a probabilistic model of the behavior of the user is constructed. Again, we did not find a detailed description of their architecture how they process their traces. X-Trace [FPK+ 07] provides capabilities to monitor different networks, including, for instance, VPNs, tunnels, or NATs. It can correlate the information gathered from one layer to the other layer. In contrast to network monitoring, Kieker currently focuses on detailed application-level monitoring.
6
Conclusions and Outlook
Application-level monitoring can provide insights into the internal behavior and structure of a software system. However, it can have a large impact on the performance of the monitored system. In this paper, we present our high-throughput tunings on the basis of Kieker in version 1.8. Furthermore, we illustrate our trace processing approach. It enables scalable and live trace processing in cloud environments. This trace processing architecture will be used in our projects ExplorViz3 [FWWH13] and PubFlow [BH12] to process the huge amounts of monitoring records. ExplorViz will provide an interactive visualization of the resulting traces and is aimed at large software landscapes. PubFlow provides a pilot application to work with scientific data in scientific workflows to increase the productivity in scientific work. Our preliminary performance evaluation demonstrates that our high-throughput tunings are reasonable compared to the results of Kieker 1.8 and provide a good basis for live trace processing. In particular, we are able to improve upon the analysis performance of Kieker by a factor of 250. The performance of our high-throughput tuned version is limited by the network bandwidth. Local tests reveal a trace processing throughput of about 750 k traces per second which corresponds to an improvement factor of 1500 with respect to Kieker 1.8. As future work, we will evaluate the scalability and performance of our trace processing architecture in our private cloud environment. We will search for guidelines which number of levels of analysis workers is suitable in which situation. In addition, we will evaluate whether further trace reduction techniques [CMZ08] can enhance the throughput of our live trace processing. Furthermore, we intend to feedback our high-throughput tunings, concerning the monitoring and analysis component, into the Kieker framework. Further future works, lies in performance testing and implementation of tracing methods for remote procedure calls of components. 3 http://www.explorviz.net
References [BH12]
Peer C. Brauer and Wilhelm Hasselbring. Capturing Provenance Information with a Workflow Monitoring Extension for the Kieker Framework. In Proc. of the 3rd Int. Workshop on Semantic Web in Provenance Mgnt. (SWPM 2012), volume 856, 2012.
[BIMN03]
Paul Barham, Rebecca Isaacs, Richard Mortier, and Dushyanth Narayanan. Magpie: Online Modelling and Performance-Aware Systems. In Proc. of the 9th Conf. on Hot Topics in Operating Systems (HOTOS 2003), page 15. USENIX Association, 2003.
[CMZ08]
Bas Cornelissen, Leon Moonen, and Andy Zaidman. An Assessment Methodology for Trace Reduction Techniques. In Proc. of the 24th Int. Conf. on Software Maintenance (ICSM 2008), pages 107–116. IEEE Computer Society, 2008.
[FPK+ 07]
Rodrigo Fonseca, George Porter, Randy H Katz, Scott Shenker, and Ion Stoica. XTrace: A Pervasive Network Tracing Framework. In Proc. of the 4th USENIX Conf. on Networked Systems Design & Implementation (NSDI 2007), pages 271–284. USENIX Association, 2007.
[FWWH13] Florian Fittkau, Jan Waller, Christian Wulf, and Wilhelm Hasselbring. Live Trace Visualization for Comprehending Large Software Landscapes: The ExplorViz Approach. In Proc. of the 1st IEEE Int. Working Conf. on Software Visualization (VISSOFT 2013). IEEE Computer Society, 2013. [Moo03]
Leon Moonen. Exploring Software Systems. In Proc. of the 19th IEEE Int. Conf. on Software Maintenance (ICSM 2003), pages 276–280. IEEE Computer Society, 2003.
[SBB+ 10]
Benjamin H. Sigelman, Luiz André Barroso, Mike Burrows, Pat Stephenson, Manoj Plakal, Donald Beaver, Saul Jaspan, and Chandan Shanbhag. Dapper, a Large-Scale Distributed Systems Tracing Infrastructure. Technical Report dapper-2010-1, Google, Inc., 2010.
[vHRH+ 09] André van Hoorn, Matthias Rohr, Wilhelm Hasselbring, Jan Waller, Jens Ehlers, Sören Frey, and Dennis Kieselhorst. Continuous Monitoring of Software Services: Design and Application of the Kieker Framework. Technical Report 0921, Department of Computer Science, Kiel University, Germany, 2009. [vHWH12] André van Hoorn, Jan Waller, and Wilhelm Hasselbring. Kieker: A Framework for Application Performance Monitoring and Dynamic Software Analysis. In Proc. of the 3rd ACM/SPEC Int. Conf. on Performance Engineering (ICPE 2012), pages 247–248. ACM, 2012. [vMvHH11] Robert von Massow, André van Hoorn, and Wilhelm Hasselbring. Performance Simulation of Runtime Reconfigurable Component-Based Software Architectures. In Proc. of the 5th European Conf. on Software Architecture (ECSA 2011), volume 6903 of Lecture Notes in Computer Science, pages 43–58. Springer, 2011. [WH12]
Jan Waller and Wilhelm Hasselbring. A Comparison of the Influence of Different Multi-Core Processors on the Runtime Overhead for Application-Level Monitoring. In Multicore Software Engineering, Performance, and Tools (MSEPT 2012), pages 42–53. Springer, 2012.
[WH13]
Jan Waller and Wilhelm Hasselbring. A Benchmark Engineering Methodology to Measure the Overhead of Application-Level Monitoring. In Proc. of the Symp. on Software Performance — Joint Kieker/Palladio Days (KPDAYS 2013), pages 57–66. CEUR Workshop Proceedings, 2013.