THE JOURNAL OF CHEMICAL PHYSICS 137, 034102 (2012)
Scalable properties of metal clusters: A comparative study of modern exchange-correlation functionals Ralph Koitz,1 Thomas M. Soini,1 Alexander Genest,1 S. B. Trickey,2 and Notker Rösch1,3,a) 1 Department Chemie and Catalysis Research Center, Technische Universität München, 85748 Garching, Germany 2 Quantum Theory Project, Dept. of Physics and Dept. of Chemistry, University of Florida, Gainesville, Florida 32611, USA 3 Institute of High Performance Computing, 1 Fusionopolis Way, #16-16 Connexis, Singapore 138632, Singapore
(Received 24 April 2012; accepted 21 June 2012; published online 16 July 2012) The performance of eight generalized gradient approximation exchange-correlation (xc) functionals is assessed by a series of scalar relativistic all-electron calculations on octahedral palladium model clusters Pdn with n = 13, 19, 38, 55, 79, 147 and the analogous clusters Aun (for n up through 79). For these model systems, we determined the cohesive energies and average bond lengths of the optimized octahedral structures. We extrapolate these values to the bulk limits and compare with the corresponding experimental values. While the well-established functionals BP, PBE, and PW91 are the most accurate at predicting energies, the more recent forms PBEsol, VMTsol, and VT{84}sol significantly improve the accuracy of geometries. The observed trends are largely similar for both Pd and Au. In the same spirit, we also studied the scalability of the ionization potentials and electron affinities of the Pd clusters, and extrapolated those quantities to estimates of the work function. Overall, the xc functionals can be classified into four distinct groups according to the accuracy of the computed parameters. These results allow a judicious selection of xc approximations for treating transition metal clusters. © 2012 American Institute of Physics. [http://dx.doi.org/10.1063/1.4733670] I. INTRODUCTION
Transition metal clusters are agglomerations of atoms ranging in size from only a few to several thousands of atoms. Like all types of nanoparticles, they represent the transition from molecular entities to bulk materials.1 Physical and chemical properties of smaller systems often show no clear trends with cluster size, the non-scalable regime, while properties of larger systems vary systematically with cluster size in the scalable regime.2, 3 Scalability allows tuning of properties and makes larger clusters especially interesting for applications in nanoscience, photonics and catalysis.1 Experimental data often do not suffice to rationalize the observed behavior of nanoparticles, so that their study by theoretical means has gained significant importance.2, 3 Systems studied range from clusters supported on oxides to bare nanoparticles of considerable sizes.4–6 Transition metal clusters also are used as models of metal surfaces since extrapolating their properties to the bulk limit often allows predictions about such surfaces.5, 7 The scaling behavior of larger clusters, especially with respect to structural and energetic aspects,4–13 has seen intensive computational examination. Density Functional Theory (DFT) is the most popular approach for accurate theoretical studies of such systems, in particular larger ones.14 Generalized gradient approximation (GGA) exchangecorrelation (xc) functionals in combination with density fitting schemes15 offer an attractive trade-off between coma) Electronic mail:
[email protected].
0021-9606/2012/137(3)/034102/9/$30.00
putational requirements and accuracy, with notable success in reproducing experimental results.5, 7 For main-group compounds, large sets of reference data16 exist, a fact which fostered development of successful hybrid density functionals.17, 18 For transition metal clusters such data sets and corresponding or comparative studies are rare. Many functionals have yet to be evaluated for such systems. Thus, no xc approximation has emerged that can be considered as the method of choice for transition metal clusters.13, 19–22 Some hybrid functionals have been shown to be wanting in accuracy for compounds with metal-metal bonds.23, 24 In contrast, modern GGA functionals provide better accuracy despite their relatively simple dependency upon only the electron density and its gradient.13, 23–25 The accuracy of popular GGA functionals often is assumed to be at the limit for this relatively simple level of approximation.26–28 Yet, the recently published VMT and VT{84} families of functionals may hold some innovation since they treat some electronic situations more rigorously.29, 30 First tests on small data sets suggested good applicability and increased accuracy for molecular bond energetics.29 More extensive studies largely confirm that trend, though with some subtleties.30 To assess the performance of those new functionals on transition metal clusters, the present all-electron DFT study compares them with five more established GGA functionals, focusing on the effect of the xc approximation on the scalability of key properties of clusters, namely average bond lengths, cohesive energies, ionization potentials and electron affinities. We chose palladium and gold, two elements important for applications in catalysis. All model systems studied
137, 034102-1
© 2012 American Institute of Physics
Downloaded 02 Aug 2012 to 128.227.41.198. Redistribution subject to AIP license or copyright; see http://jcp.aip.org/about/rights_and_permissions
034102-2
Koitz et al.
were chosen as clusters of octahedral symmetry, Pdn with nuclearities n = 13, 19, 38, 55, 79, and 147, Aun up through n = 79. These structures resemble symmetry-preserving extracts of the fcc lattice, assumed by both metals. These structures are preferable over the global minimum structures (see, e.g., Refs. 11 and 31) if the focus is on models with a common structural motif and the scaling of size-dependent properties. By extrapolating the results for the selected models to the bulk limit, one is able to compare to experimental data, thus assessing the accuracy of the employed functionals. II. COMPUTATIONAL DETAILS
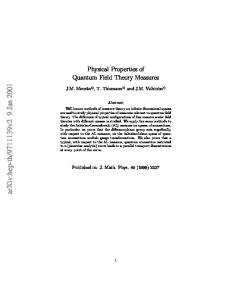
The set of six clusters of (truncated) octahedral and cuboctahedral structures with 13 to 147 atoms is depicted in Fig. 1. The clusters were constructed with initially uniform interatomic distances at the bulk experimental values, 275 pm for Pd32 and 288 pm for Au,33 then relaxed in all degrees of freedom under the constraint of octahedral symmetry. For the geometry optimizations, we employed the local density approximation (LDA) as parameterized by Vosko, Wilk, and Nusair (VWN) (Ref. 34) as well as the following eight GGA functionals: BP,35, 36 PW91,37 PBE,38 PBEsol,39 VMT,29 VMTsol,29 VT{84},30 and VT{84}sol.30 The first four functionals in this list are well-established and used frequently in DFT studies. The GGA functionals chosen include the recent re-parameterization PBEsol39 of the PBE functional (to a different constraint) aimed at optimal performance
J. Chem. Phys. 137, 034102 (2012)
for extended solids. The latter four functionals are recent additions to the set of GGAs which were summarized above. For the VMT exchange functional as well as its “sol” version, we followed the published form.29 Specifically, both VMT and VMTsol originally were combined with the PBE correlation functional.38 In that spirit, the VT{84} and VT{84}sol exchange functionals were also combined with the PBE correlation functional in the present study. Later on, these latter functionals were adjusted to use the correlation part of the PBEsol functional.30 All calculations were carried out with the linear combination of Gaussian-type orbitals fitting-functions density functional approach (LCGTO-FF-DF) to the Kohn-Sham problem15 as implemented in the code PARAGAUSS (version 3.1.6).40, 41 Further computational details are provided as supplementary material.42 Scalar relativistic effects were incorporated via the second-order Douglas-Kroll-Hess scheme.43–46 For the Pd studies, calculations were carried out both with and without scalar relativistic treatment, to quantify the relativistic contribution to the parameters investigated. Only the relativistic treatment was used for Au. Spin-polarized calculations were done for all clusters up to n = 55, whereas the larger clusters were treated in spin-restricted fashion. This approach is justified, as for Pd spin typically is quenched rapidly with increasing cluster size.13 For the largest gold cluster studied, Au79 , the non-spin-polarized treatment results in an artificial closed-shell configuration in which one unpaired electron is split evenly between the spin-up and spin-down orbitals. The errors in geometries and energies introduced by this approximation, however, are very small. To facilitate convergence of the SCF-procedure, a fractional occupation number technique was employed.15 This allows non-integer occupation of orbitals, using a Fermi-type broadening function with an energy range of 0.25 eV.
III. RESULTS AND DISCUSSION A. Average bond lengths
We studied the average bond length, dav , in the cluster as a function of cluster size, using this quantity as a model for the scalability of structural features of the cluster. The average bond length is defined as the arithmetic mean of all nearestneighbor M-M distances in a Mn cluster (M = Pd, Au), with n the number of metal atoms. Because all the clusters are globular and of the same symmetry, the quantity n−1/3 is approximately proportional to the inverse (effective) radius of the cluster and hence to its surface-to-volume ratio.9, 42 In the linear scaling regime, dav then can be chosen as dav = kav · n−1/3 + dbulk .
FIG. 1. Sketches of octahedral clusters of nuclearities 13, 19, 38, 55, 79, and 147.
(1)
The intercept, dbulk , of the linear function is an estimate of the bulk interatomic distance. To assess the quality of the results, the value of dbulk can be compared to the experimental bulk values: dexp (Pd) = 275 pm,32 dexp (Au) = 288 pm.33 Recall that linear relations may also be formulated in terms of the average coordination number of the atoms in a particle.
Downloaded 02 Aug 2012 to 128.227.41.198. Redistribution subject to AIP license or copyright; see http://jcp.aip.org/about/rights_and_permissions
Koitz et al.
034102-3
J. Chem. Phys. 137, 034102 (2012)
TABLE I. Parameters of linear fit of average bond lengths dav in Mn clusters (M = Pd, Au) as a function of n−1/3 , optimized with 9 xc functionals at the scalar relativistic level, Eq. (1).
Pd
r2a kav b dbulk c,d
Au
r2a kav b dbulk c,d
VWN
BP
PW91
PBE
PBEsol
VMT
VMTsol
VT{84}
VT{84}sol
0.982 −22.77 272.5
0.990 −22.45 279.9
0.989 −22.26 279.7
0.990 −21.81 279.7
0.987 −21.87 275.1
0.990 −21.37 280.6
0.988 −20.97 274.4
0.990 −21.33 280.7
0.984 −18.87 273.9
0.997 −29.56 286.2
0.996 −29.55 294.7
0.996 −28.03 293.9
0.996 −28.05 293.8
0.996 −28.18 288.6
0.995 −27.51 294.7
0.993 −26.91 287.5
0.995 −27.46 294.8
0.993 −26.89 287.5
a
Squared correlation coefficient of linear fit. Slope in pm. Axis intercept in pm. d Extrapolated bulk M-M distance in pm; dbulk (exp.) = 275 pm for Pd (Ref. 32) and dbulk (exp.) = 288 pm for Au (Ref. 33). b c
The average coordination number is linear in the surface-tovolume ratio, but we prefer the quantity n−1/3 for its direct connection to the cluster nuclearity. Table I lists the parameters of the linear fit, Eq. (1), for all functionals studied, using the scalar relativistic treatment. Individual values of dav , for both scalar relativistic and nonrelativistic calculations are given in Tables S1 and S2 of the supplementary material.42 For the older functionals, these results agree with those of previous studies. Using the BP functional, Ahlrichs et al.11 determined an extrapolated dbulk of 280.9 pm for a series of fcc Pd clusters. That value agrees somewhat better with the experiment than one from a previous study4 which found dbulk of 290.5 pm with BP and 281.2 pm with VWN, but did not consider relativistic effects and only optimized the breathing mode of the clusters. While the results cannot be compared precisely due to the different numerical approximations in different implementations and/or different clusters that were used, we find good agreement with a difference of 0.8 pm in the most favorable case. For Pdn , the values of dbulk segregate in four groups reflecting the similar behavior of classes of xc functionals. Accordingly, we discern the following groups of functionals: 1. VWN gives the shortest value dbulk = 272.5 pm of the functionals studied, deviating by 2.5 pm from the reference. 2. Three functionals, PBEsol, VMTsol and VT{84}sol constitute the group of second-shortest bond lengths; they agree best with the experimental value. The group spans the range of 273.9 pm to 275.1 pm, bracketing dexp . 3. Three earlier GGA functionals BP, PBE and PW91 show a spread of only 0.2 pm for dbulk , from 279.7 pm to 279.9 pm. They overestimate the reference value by almost 5 pm. 4. VMT and VT{84} extrapolate to the largest estimates of dbulk , around 280.7 pm, 5.7 pm above the reference, about 1 pm longer than the next-lower group. The tendency of LDA functionals to underestimate bond lengths, as observed here, is a commonplace, as are the typically long bond lengths of the BP-type GGAs (Group 3, above). The presumably best cluster geometries are ob-
tained with those functionals explicitly parameterized to constraints appropriate for extended solids (sol-type functionals, Group 2). Thus it seems that, with respect to geometries, the larger clusters studied here indeed resemble solids. Four very recent functionals (VMT, VMTsol, VT{84}, VT{84}sol) are included in the present study. They fall into two distinct categories of predicted dbulk . The sol variants of the functionals retain the gradient coefficient, µ, of the PBEsol exchange approximation which may rationalize the similarity of their results. On the other hand, the functionals VMT and VT{84} keep the µ value of the PBE exchange functional, producing similarly expanded bond lengths, compared to experiment. The VMTsol and VT{84}sol functionals reproduce dexp with an accuracy comparable to that of PBEsol for the systems studied. The functionals VMT and VT{84} show no improvement in comparison with the GGA functionals of Group 3 (see above). In fact, the predicted dbulk is slightly worsened, by ∼1 pm. This observation is to some extent in line with previously published results for small molecules,29 where the mean absolute error of bond lengths of the VMT results was worse than that of the PBE results, similar for VMTsol relative to PBEsol.29 More recent comparisons on a much larger set of geometry data on small molecules show the mean absolute error of bond lengths to be about a 0.3 pm larger for VMT and VT{84} than for PBE, but only about 0.1 pm larger for VMTsol and VT{84}sol relative to PBEsol.30 While the differences among VMTsol, VT{84}sol, and PBEsol results are small, the comparison of these functionals still allows some insight into the effect of the xc approximation on the structure. Differences in the structure results induced by the exchange part of VMT or VT{84} are reflected in the differences between their results and those from PBE, about 1 pm in magnitude. On the other hand, the difference between PBE and VMTsol (VT{84}sol}) amounts to 5.3 pm (5.8 pm); these shifts reflect the effects of the so-called reduced gradient contribution in the “sol” parameterization, in combination with the effects of the different exchange approximations. In particular, the reduced gradient parameterization is known to have a substantial beneficial effect on calculated bulk lattice parameters which is corroborated by the present results on average bond distances and their extrapolation to the bulk limit.39
Downloaded 02 Aug 2012 to 128.227.41.198. Redistribution subject to AIP license or copyright; see http://jcp.aip.org/about/rights_and_permissions
034102-4
Koitz et al.
J. Chem. Phys. 137, 034102 (2012)
In the same manner as for palladium, we studied the scaling of average bond lengths in gold clusters Aun , n = 13–79 (Table I). Results for individual clusters are presented in Table S3 of the supplementary material.42 The trends observed for the palladium clusters are broadly reproduced for gold and the established grouping of functionals is mostly valid also for Au. The VWN functional stands alone, while the sol-functionals together group around the experimental value. The somewhat distinct Groups 3 and 4 that were observed for Pd merge for Au and contain the remaining GGA functionals. Pd does not have a high atomic number, Z = 46, yet relativistic effects are already rather noticeable in the Pdn clusters.46 To assess these effects we carried out additional calculations at the nonrelativistic level.45 Comparing to the nonrelativistic results, we note a contraction of dav by ∼ 5 pm at the scalar relativistic level.9, 42 When relativistic effects are not accounted for, even the shortest value of dbulk , as computed with the VWN functional, is 1.4 pm greater than the experimental value, while all GGA functionals overestimate dbulk by 4–10 pm. Relativistic effects contribute up to 1.8% to the average bond length and reduce the error in dbulk by about 50%. Thus, only a relativistic treatment yields good agreement with experiment.
B. Cohesive energies
The cohesive energy Ecoh of a cluster Mn is defined as the atomization energy per atom. Accordingly, the cohesive energies were determined for the model set of clusters Pdn (n = 13–147) and Aun (n = 13–79) for all nine functionals examined. For Ecoh of large clusters, one can suggest a linear scaling relation in n−1/3 by considering bulk and surface contributions:8, 9 Ecoh = kcoh · n−1/3 + Ebulk .
(2)
The upper half of Table II provides the fit parameters for palladium clusters as obtained from results of scalar relativistic calculations with all functionals examined in the recent work; results for individual clusters are listed in Table S4 of the supplementary material.42
As in Sec. III A for the average bond lengths, we can partition the results for Ebulk in four distinct groups: 1. VWN yields the highest Ebulk of the functionals studied, with a difference of 143.5 kJ · mol−1 to the reference. 2. PBEsol, VMTsol and VT{84}sol values range from 443.2 kJ · mol−1 to 447.6 kJ · mol−1 with errors of ∼70 kJ · mol−1 . 3. The GGA functionals BP, PBE and PW91 give the best agreement with the reference value, agreeing to within 10 kJ · mol−1 . The PBE functional reproduces the experimental value almost exactly. 4. VMT and VT{84} are the only functionals that underestimate Ebulk . The errors are roughly twice as large as for the previous group, but of opposite sign. The relativistic contribution to Ebulk causes an increase by 90–100 kJ · mol−1 , typically more than 33%. (For non-relativistic values, see Table S5 of the supplementary material.42 ) The magnitude of the relativistic contribution is very similar for all the functionals, irrespective of the absolute value of the cohesive energy. Upon inclusion of scalar relativistic effects, all curves thus are shifted rather uniformly. For Group 3, the relative errors are reduced by one order of magnitude in the best case, making this group the one with the best agreement with the experiment. Owing to the shorter relativistic bond lengths, the binding in the clusters is also strengthened by relativistic effects, thus increasing the cohesive energy. For a similar cluster set, previous studies have found values of 336 kJ · mol−1 4 and 346 kJ · mol−1 11 for Ecoh using GGA functionals, underestimating the bulk cohesive energy. Our results show significantly smaller errors for the best functionals. We attribute this difference partially to the greater accuracy of all-electron calculations compared to pseudopotential methods, as well as to the full optimization of the clusters in all degrees of freedom consistent with octahedral symmetry. Furthermore, our inclusion of the Pd19 cluster, with its untypically high cohesive energy, may be a corrective influence on the extrapolated values, as it somewhat pushes the fitted line towards higher cohesive energies. In the same way, we determined the scalar relativistic cohesive energy also for the set of clusters Au13 to Au79 . With fits to a linear function in n−1/3 (Table II; results for individual
TABLE II. Parameters of linear fit of cohesive energies Ecoh per atom (kJ · mol−1 ) of Mn clusters (M = Pd, Au) as a function of n−1/3 , optimized with 9 xc functionals at the scalar relativistic level, Eq. (2).
Pd
Au
r2a kcoh b Ebulk c,d r2a kcoh b Ebulk b,d
VWN
BP
PW91
PBE
PBEsol
VMT
VMTsol
VT{84}
VT{84}sol
0.989 −493.8 509.5 0.992 −440.4 461.2
0.983 −351.7 366.1 0.991 −301.1 315.6
0.985 −364.4 379.7 0.992 −318.5 333.6
0.986 −363.5 375.6 0.992 −317.0 330.1
0.989 −440.1 447.6 0.993 −391.0 400.2
0.986 −344.8 353.9 0.992 −295.5 307.5
0.989 −444.9 444.0 0.993 −397.2 397.8
0.985 −343.2 352.1 0.992 −293.7 305.6
0.99 −444.1 443.2 0.993 −396.4 397.0
a
Squared correlation coefficient of linear fit. Slope in kJ · mol−1 . c Axis intercept in kJ · mol−1 . d Extrapolated bulk cohesive energy; Ebulk (exp.) = 376 kJ · mol−1 for Pd (Ref. 53) and Ebulk (exp.) = 366 kJ · mol−1 for Au (Ref. 47).
b
Downloaded 02 Aug 2012 to 128.227.41.198. Redistribution subject to AIP license or copyright; see http://jcp.aip.org/about/rights_and_permissions
034102-5
Koitz et al.
J. Chem. Phys. 137, 034102 (2012)
clusters in Table S4 of the supplementary material42 ), we find good agreement also for these systems. The best agreement with the experimental value,47 366 kJ · mol−1 , is given by VMTsol and VT{84}sol, followed very closely by PW91. The first two functionals predict Ebulk up to 32 kJ · mol−1 too high, whereas the latter gives an extrapolated cohesive energy 32 kJ · mol−1 too low. Compared to palladium, for gold the agreement with experiment is substantially worse. The most accurate functional deviates by 8%, i.e., an order of magnitude worse than the best relative deviation for Pd. The energies are generally smaller by absolute value than observed for Pd, i.e., the curves are shifted upward relative to the bulk value. Moreover, the functionals giving the most accurate results are different from those for Pd. The grouping of functionals with respect to Ebulk found for palladium remains largely the same for gold, noting once again that groups III and IV merge. For gold, however, none of the groups contains the experimental value. Rather, Groups 2 and 3 lie slightly more than 30 kJ · mol−1 too low and too high, respectively. As found for Pd, the new functionals of the VMT and VT{84} families do not predict significantly better cohesive energies, and perform either very similar to other functionals within their group or slightly worse. This grouping of the extrapolated cohesive energies also illuminates a somewhat subtle distinction among the enhancement factors in the functionals. Observe, from Table II, that PBEsol, VMTsol, and VT{84}sol results are quite similar (≤ 4 kJ · mol−1 range for both Pd and Au), while PBE differs notably from both VMT, and VT{84} (≤22–25 kJ · mol−1 difference for both elements). The “sol” family, PBEsol, VMTsol, andVT{84}sol have extremely similar exchange enhancement factors in the region 0 ≤ s ≤ 3, which often has been argued to be dominant in molecules.48, 49 In contrast, the family of “original” functionals PBE, VMT, and VT{84} has enhancement factors which differ by 3–4% over the region 1 ≤ s ≤ 2. Furthermore, the exponents which govern the larges decay in VMT and VT{84} are much smaller for the corresponding sol variants. Therefore, at large s, VMTsol and VT{84}sol differ less from PBEsol than the original functionals VMT and VT{84} differ from PBE.
C. Ionization potential and electron affinity
In this section, we discuss ionization potentials and electron affinities on the example of palladium clusters treated at the scalar relativistic level. The vertical ionization potential, IP, of a cluster Pdn was determined using the 1SCF method, I P = E(Pd+ n ) − E(Pdn ).
(3)
E(Pdn ) is the total energy of the optimized Pdn cluster and E(Pdn + ) is the total energy of the corresponding cation at the same, fixed geometry. The electron affinity EA is calculated in an analogous way, EA = E(Pdn ) − E(Pd− n ).
(4)
Also IP and EA values can be represented by linear functions in n−1/3 as follows: 8, 50, 51 I P = kIP · n−1/3 + 8IP ,
(5)
EA = kEA · n−1/3 + 8EA .
(6)
The offsets 8IP and 8EA are estimates of the work function 8 of the bulk metal. Due to the overlapping valence and conduction bands in metallic systems, adding or removing one electron requires the same amount of energy, so that in the ideal case both estimates are equal. Table III shows the IP and EA results for the set of clusters calculated with the nine exchange-correlation functionals. Results for individual clusters are given in Table S7 of the supplementary material.42 The IP exhibits a monotonic decrease with increasing cluster size (smaller n−1/3 ), with the exception of the Pd38 cluster for which some functionals (most notably VWN, to a lesser extent the three sol-functionals) predict an increase in IP. Due to the greater scatter, the linear fit is less accurate; hence, the extrapolated results for VWN, PBEsol, and VMTsol are less reliable. As with Ebulk and dbulk , the extrapolated work functions 8IP form distinct groups, albeit with slight differences compared to the grouping above, as PBE and PBEsol change places. We thus find the following four groups of functionals: 1. VWN is the only functional that significantly overestimates 8IP .
TABLE III. Parameters of linear fit of ionization potentials IP and electron affinities EA (eV) of Pdn clusters as a function of n−1/3 , optimized with 9 xc functionals at the scalar relativistic level, Eqs. (5) and (6).
IP
EA
18
r2a kIP b 8IP c,d r2a kEA b 8EA c,d 8IP – 8EA
VWN
BP
PW91
PBE
PBEsol
VMT
VMTsol
VT{84}
VT{84}sol
0.776 2.87 5.47 0.909 − 4.93 5.17 0.30
0.909 3.04 5.19 0.959 − 5.06 5.04 0.15
0.901 3.06 5.12 0.954 − 5.02 4.96 0.16
0.918 3.06 5.05 0.956 − 5.00 4.89 0.16
0.850 2.88 5.18 0.940 − 5.05 4.95 0.23
0.926 3.14 4.95 0.966 − 4.98 4.83 0.14
0.854 2.87 5.02 0.946 − 5.16 4.82 0.20
0.927 3.15 4.96 0.966 − 4.98 4.82 0.13
0.854 2.88 5.02 0.943 − 5.09 4.79 0.23
a
Squared correlation coefficient of linear fit. Slope in eV. c Axis intercept in eV. d Extrapolated (bulk) work function; 8(exp.) = 5.21 eV (Ref. 47). b
Downloaded 02 Aug 2012 to 128.227.41.198. Redistribution subject to AIP license or copyright; see http://jcp.aip.org/about/rights_and_permissions
034102-6
Koitz et al.
2. BP and PBEsol are the most accurate functionals, with errors around 0.04 eV, 3. PW91 underestimates 8IP by ∼0.10 eV. 4. PBE, VMT, VMTsol, VT{84}, and VT{84}sol underestimate 8exp by 0.17–0.26 eV. Group 2 contains the functionals which yield the most accurate extrapolated work functions, BP and PBEsol. Group 3, PW91 alone, is worse by more than a factor of two. As noted in Sec. III B, the functionals BP and PW91 are also the most accurate in determining the extrapolated bulk cohesive energies. This relationship fits with the common trend of GGA functionals being well-suited for computing energies, which is also substantiated by the other GGA functionals (Group 4), which — while being less accurate than Groups 2 and 3 — still provide reasonable estimates of 8IP . In contrast to Sec. III B, PBEsol performs notably better in this case than PBE. This observation is somewhat at odds both with the less accurate energies of PBEsol found above, and with the behavior of VMTsol and VT{84}sol, which, although closely related to PBEsol, show a much larger error. Note however that 8IP,PBE > 8IP,VT{84} > 8IP,VMT and the same is true for the sol-variants. The four novel functionals of the VMT and VT{84} families all predict 8IP in the range of 4.94–5.03 eV. The sol-variants of the functionals occupy the lower limit of this range, giving virtually identical values of about 5.02 eV, while VMT and VT{84} underestimate experiment more strongly, both yielding about 4.95 eV. As seen previously, the difference between the corresponding variants of the two families is minor, which is not unexpected in the light of the very similar analytical forms of the exchange functional. After all, the exchange enhancement factors FX ,VMT and FX,VT{84} differ primarily in the large dimensionless-gradient limit; therefore, only a small difference is likely to be observed in the rather homogenous densities in transition metal clusters. However, at variance with the observations for Ecoh , the sol variants yield more accurate work functions (25% smaller error), which are almost as good as those from the PBE GGA. This difference possibly arises because of the differing inhomogeneity in the two states used in the 1SCF calculation and the way that inhomogeneity difference registers in the various enhancement factors. Broadly speaking, the VMT and VT{84} functionals do not show improved performance for the computation of IP and 8IP , and give a somewhat larger error than other GGA functionals. They are, however, equally accurate as the other functionals in reproducing the linear scaling and qualitatively predict the observed trends. Compared to the ionization potential, the electron affinities exhibit an inverse trend as they grow with increasing cluster size (Table III; results for individual clusters in Table S7 of the supplementary material42 ). The cluster Pd38 again lies somewhat outside of that trend. All functionals other than VWN predict a slightly higher EA value for Pd38 than Pd55 , violating the otherwise monotonic increase. The extrapolated values of the work function 8EA determined with all nine functionals are lower than the experimental value 5.21 eV,47 ranging from 4.79 eV to 5.17 eV. The spread of the estimates 8EA is much smaller among the
J. Chem. Phys. 137, 034102 (2012)
functionals than that of 8IP . A consequence of this narrower range of extrapolated values is the partial disappearance of the grouping of functionals. VWN and VT{84}sol provide the upper and lower bounds to 8EA , bracketing the remaining seven functionals in a 0.23 eV range, within which the VMT and VT{84} families cluster at the lower limit, and BP and PW91 at the upper. PBE and PBEsol deliver results intermediate between Groups 2 and 3. The best agreement with the experimental work function is obtained with the VWN functional, followed by BP and PW91, which already deviate by ∼0.17 eV. The similarity of the 8EA values predicted by the VMT and VT{84} functionals is more pronounced than for 8IP noted above. All four functionals predict a value of 4.79– 4.82 eV for 8IP , underestimating the experimental value by ∼0.41 eV. Differences between the two functionals are too small to discern. These functionals do not show an advantage over other GGA functionals for the computation of EA or 8EA , as we already noted for the ionization potential. The typical errors are larger by a factor of two than those obtained with, e.g., BP, while the accuracy of the fit remains the same. The amount of energy required for removing an electron from an extended metal system is equal in magnitude to the energy gained when adding one. Therefore, the difference between IP and EA should converge to zero as the cluster size approaches infinity. The residual difference 18 = 8IP − 8EA quantifies the error made when extrapolating the work functions from IP and EA (Table III). For the GGA functionals 18 is between 0.13 eV and 0.23 eV. Although 18 is small compared to the magnitude of 8 (less than 3%), the errors in IP and EA do not entirely cancel. We observe a systematic overestimation of 18 which mainly seems caused by the underestimation of EA noted above. The positive values of 18 likely in part reflect differences in the (remaining) self-interaction error of the various functionals.52 None of the xc-functionals employed is free of this error, but different functionals have different residual self-interaction errors. It is therefore unsurprising that they yield varying results for 18.
FIG. 2. Functions linear in n−1/3 fitted to average bond distances dav (in pm), Eq. (1), of the Pdn , clusters studied, from scalar relativistic calculations. The resulting straight lines illustrate the various groups of functionals (see text): Group I – VWN; Group II – PBEsol, VMTsol, VT{84}sol; Group III – BP, PBE, PW91; Group IV –VMT, VT{84}. The experimental value dbulk = 275 pm is shown as dashed horizontal line.
Downloaded 02 Aug 2012 to 128.227.41.198. Redistribution subject to AIP license or copyright; see http://jcp.aip.org/about/rights_and_permissions
034102-7
Koitz et al.
J. Chem. Phys. 137, 034102 (2012)
TABLE IV. Four groups of xc functionals according to the combined results for scalable properties of metal clusters Group I Group II Group III Group IV
VWN PBEsol, VMTsol, VT{84}sol BP, PBE, PW91 VMT, VT{84}
D. Grouping of xc functionals
Summarizing the results found for each of the scalable properties, the xc functionals may be classified into four broad groups of different functional behavior. This classification is easily discernible, for instance in Figures 2 and 3, where the linear fits for dav and Ebulk are depicted for the example of the palladium clusters. For the gold clusters, the values are less well separated in some cases. Nevertheless, from an overall point of view this classification still seems justified. Table IV lists characteristics of the various groups. From both the computed results and the different nature of the functional, the only LDA functional in the study, VWN, is in a group of its own. We find the typical tendencies of LDA functionals for all of the parameters, i.e., shortened bond lengths and strongly overestimated binding energies. The corresponding residual difference 18 = 8IP − 8EA is rather large, hence the extrapolated values of IP and EA do not estimate the bulk work function reliably. Although popular for describing some extended solids, the VWN functional may therefore not be the first choice for transition metal clusters, except perhaps for the calculation of geometries and the relative energetics of near-equilibrium geometries. Functionals in Group II (the sol variants, PBEsol, VMTsol, VT{84}sol) provide metal-metal bond lengths of very high accuracy and dramatically improve upon VWN energies. For estimating the cohesive energy Ebulk these functionals fall far short of the accuracy of other functionals. This behavior is expected as the sol functionals are parametrized to electron gas data with the goal of improving lattice constants at
Shortest dav , energy parameters Ecoh , IP, and EA overestimated Accurate dav , Ecoh overestimated, accurate IP but EA somewhat underestimated Overestimated dav , but best energy parameters values of Ecoh , IP and EA Similar to Group III, but less accurate energies, and longer dav
the expense of worsened atomic energies39 and thus less accurate Ebulk . PBEsol was designed mainly to improve structural results. Therefore its accurate results for IP values are somewhat surprising. Further assessment of this performance may be necessary to exclude fortuitous error cancellation in the present cases. The other two functionals in Group II do not improve substantively upon the bond lengths and cohesive energies found with PBEsol, while giving somewhat less accurate IP and EA values. All of these functionals estimate the work function with errors 18 ≈ 0.2 eV. The three GGA functionals of Group III give the most accurate values for Ebulk as well as for IP and EA. The PBE functional is an improvement on PW91 which itself is based on BP. This trend is reflected in the increasing accuracy of the cohesive energy determined with these functionals although differences within this group are generally small. Because of the high accuracy of these functionals for cluster energies, they seem to be the methods of choice for all energetic aspects of the metal clusters studied. However, the error of 5 pm in the optimized bond distances is rather high so that the Group III functionals are not universally optimal, either. The final group of functionals is composed of the two remaining GGA functionals in this study, VMT and VT{84}. These two functionals are rather similar and also show a behavior similar to the Group III GGA methods. VMT and VT{84} give slightly longer dbulk than the other GGA functional, but somewhat less accurate values for Ecoh , IP, and EA. However they are the most consistent estimators of 8, with residual 18 ≈ 0.12 eV. The energetic behavior was unexpected as earlier validation studies29, 30 showed both VMT and VT{84} to be clearly superior to PBE for atomization energies. While the results for Au indicate less pronounced differences between the functionals in Groups III and IV, we still find it appropriate to retain the grouping, based not only on the differences in results but also on the different spread of the results within each group.
IV. CONCLUSIONS
FIG. 3. Functions linear in n−1/3 fitted to cohesive energy Ecoh (in kJ · mol−1 ), Eq. (2), of the Pdn , clusters studied, from scalar relativistic calculations. The resulting straight lines illustrate the various groups of functionals (see text): Group I – VWN; Group II – PBEsol, VMTsol, VT{84}sol; Group III – BP, PBE, PW91; Group IV – VMT, VT{84}. The experimental value Ecoh = 376 kJ · mol−1 is shown as dashed horizontal line.
In general, all quantities studied exhibit good scalability with cluster size. Some outliers are found for the calculated values of IP and EA. Nevertheless, all properties can be extrapolated to bulk values with fairly high reliability. Particularly, average bond lengths and cohesive energies of the clusters are almost perfect linear functions of n−1/3 , with n the cluster nuclearity. The decrease of dav with decreasing cluster size can be rationalized readily5 in terms of the comparatively higher fraction of surface atoms for the smaller systems. Such surface atoms are subject to a greater “buckling” and contraction of the structure than interior ones. With increasing
Downloaded 02 Aug 2012 to 128.227.41.198. Redistribution subject to AIP license or copyright; see http://jcp.aip.org/about/rights_and_permissions
034102-8
Koitz et al.
cluster size, the average coordination number also approaches its bulk limit, 12 for Pd and Au, approximately linearly with the surface-to-volume ratio, i.e., with n−1/3 . The same holds for the cohesive energy.9 For bond length results, we note very similar trends for palladium and gold clusters. The most accurate functionals are the same in both cases (PBEsol, VMTsol, VT{84}sol); they predict the bulk bond length with similarly small errors. The novel GGA functionals evaluated in this study perform as well for geometries as the established GGA functionals BP, PW91, and PBE. In addition, we found very similar results within the pairs [VMT, VT{84}] and [VMTsol, VT{84}sol] which we rationalize on the basis of the rather similar exchange enhancement factors. The VT{84} functionals differ from those of the VMT family only by a small additional term in the expression for the exchange energy which in turn appears to make only a small contribution to the geometry results. The accuracy at which the experimental value of the cohesive energy is reproduced varies considerably between palladium and gold clusters. While in the case of the PBE functional the experimental result for palladium is essentially reproduced (up to 0.4 kJ · mol−1 ), the best extrapolations from gold cohesive energies are obtained with the VMTsol and VT{84}sol functional, but even those lie ∼32 kJ · mol−1 too high. Note that the results obtained with GGA results are not biased in any direction. While the sol functionals tend to overestimate the cohesive energy, the other GGA functionals yield mostly too low results. The values of IP and EA of the clusters both approximate the bulk work function 8 with increasing cluster size, but approach their individual limits from opposite directions. In this context, recall the model of a conducting sphere for rationalizing the trends of IP and EA values of metal clusters.8, 50, 51 Note also the different susceptibility of these quantities to the remaining self-interaction error of the various approximate functionals. The quality of the linear fits is lower than for bond lengths or cohesive energies. Nevertheless, the values of both IP and EA scale almost linearly with the surface-to-volume ratio n−1/3 . In summary, our study did not identify a single “optimal” functional that is able to predict all the quantities studied with best accuracy. In particular, the lack of metal cluster data in standard validation sets (e.g., the G3 set16 ) implies that functionals validated for inorganic and organic chemistry may be not as effective for treating metal clusters. The present study corroborates that for GGA functionals one seems to be faced with a trade-off between the quality of cluster geometries and the corresponding energetics. As shown by the present results also for larger transition metal clusters, the sol-type functionals PBEsol, VMTsol and VT{84}sol yield the best structure results, while energies are best determined with the well-established GGA functionals BP, PW91, and PBE. Furthermore, the choice of functional is crucial – as results may differ by well over 100 kJ · mol−1 or 10 pm – and can be a major source of error. The data reported here may thus raise the awareness regarding strengths and weaknesses of each functional and serve as a guideline for choosing the functional depending on the application.
J. Chem. Phys. 137, 034102 (2012)
ACKNOWLEDGMENTS
We thank Dr. Alexei V. Matveev for his contribution to implementing the xc functionals and for helpful discussions. T.S is grateful for financial support by the International Graduate School of Science and Engineering (IGSSE) of TU München. The work of N.R was supported in part by the Fonds der Chemischen Industrie (Germany). S.B.T was supported in part by U.S. Dept. of Energy Grant DE-SC0002139. We gratefully acknowledge generous computing resources at Leibniz Rechenzentrum München.
1 Metal
Clusters in Chemistry, edited by P. Braunstein, L. A. Oro, and P. R. Raithby (Wiley, Weinheim, 1999). 2 Nanocatalysis, edited by U. Heiz and U. Landman (Springer, Berlin, Heidelberg, 2007). 3 I. V. Yudanov, A. Genest, S. Schauermann, H.-J. Freund, and N. Rösch, Nano Lett. 12, 2134–2139 (2012). 4 S. Krüger, S. Vent, F. Nörtemann, M. Staufer, and N. Rösch, J. Chem. Phys. 115, 2082–2087 (2001). 5 I. V. Yudanov, M. Metzner, A. Genest, and N. Rösch, J. Phys. Chem. C 112, 20269–20275 (2008). 6 J. Kleis, J. P. Greeley, N. A. Romero, V. A. Morozov, H. Falsig, A. H. Larsen, J. Lu, J. J. Mortensen, M. Dulak, K. S. Thygesen, J. K. Norskov, and K. W. Jacobsen, Catal. Lett. 141, 1067–1071 (2011). 7 I. V. Yudanov, A. V. Matveev, K. M. Neyman, and N. Rösch, J. Am. Chem. Soc. 130, 9342–9352 (2008). 8 O. D. Häberlen, S. C. Chung, M. Stener, and N. Rösch, J. Chem. Phys. 106, 5189–5201 (1997). 9 S. Krüger, S. Vent, and N. Rösch, Ber. Bunsenges. Phys. Chem. 101, 1640– 1643 (1997). 10 I. V. Yudanov, R. Sahnoun, K. M. Neyman, and N. Rösch, J. Chem. Phys. 117, 9887–9896 (2002). 11 P. Nava, M. Sierka, and R. Ahlrichs, Phys. Chem. Chem. Phys. 5, 3372–3381 (2003). 12 I. V. Yudanov, A. Genest, and N. Rösch, J. Clust. Sci. 22, 433–448 (2011). 13 R. Koitz, T. M. Soini, A. Genest, S. B. Trickey, and N. Rösch, Int. J. Quantum Chem. 112, 113–120 (2012). 14 F. Weigend and R. Ahlrichs, Phil. Trans. R. Soc. A 368, 1245–1263 (2010). 15 B. I. Dunlap and N. Rösch, Adv. Quantum Chem. 21, 317–339 (1990). 16 L. A. Curtiss, K. Raghavachari, P. C. Redfern, and J. A. Pople, J. Chem. Phys. 112, 7374–7383 (2000). 17 Y. Zhao and D. G. Truhlar, Acc. Chem. Res. 41, 157–167 (2008). 18 C. J. Cramer and D. G. Truhlar, Phys. Chem. Chem. Phys. 11, 10757– 10816 (2009). 19 L.-L. Wang and D. D. Johnson, Phys. Chem. Lett. B 109, 23113–23117 (2005). 20 M. M. Quintal, A. Karton, M. A. Iron, A. D. Boese, and J. M. L. Martin, J. Phys. Chem. A 110, 709–716 (2006). 21 G. I. Csonka, J. P. Perdew, A. Ruzsinszky, P. H. T. Philipsen, S. Lebegue, J. Paier, O. A. Vydrov, and J. G. Angyan, Phys. Rev. B 79, 155107 (2009). 22 M. Korth and S. Grimme, J. Chem. Theory Comput. 5, 993–1003 (2009). 23 F. Furche and J. P. Perdew, J. Chem. Phys. 124, 044103 (2006). 24 J. Paier, M. Marsman, and G. Kresse, J. Chem. Phys. 127, 024103 (2007). 25 A. J. Cohen, P. Mori-Sanchez, and W. Yang, Science 321, 792–794 (2008). 26 Y. Zhao and D. G. Truhlar, Theor. Chim. Acta 120, 215–241 (2008). 27 J. Tao, J. P. Perdew, V. N. Staroverov, and G. E. Scuseria, Phys. Rev. Lett. 91, 146401 (2003). 28 P. P. Rushton, D. J. Tozer, and S. J. Clark, Phys. Rev. B 65, 193106 (2002). 29 A. Vela, V. Medel, and S. B. Trickey, J. Chem. Phys. 130, 244103 (2009). 30 A. Vela, J. C. Pacheco-Kato, J. L. Gázquez, J. M. del Campo, and S. B. Trickey, J. Chem. Phys. 136, 144115 (2012). 31 J. Wang, G. Wang, and J. Zhao, Phys. Rev. B 66, 035418 (2002). 32 C. N. Rao and K. K. Rao, Can. J. Phys. 42, 1336–1342 (1964). 33 A. Maeland and T. B. Flanagan, Can. J. Phys. 42, 2364–2366 (1964). 34 S. H. Vosko, L. Wilk, and M. Nusair, Can. J. Phys. 58, 1200–1211 (1980). 35 A. D. Becke, Int. J. Quantum Chem. 23, 1915–1922 (1983). 36 J. P. Perdew, Phys. Rev. B 33, 8822–8824 (1986). 37 J. P. Perdew, J. A. Chevary, S. H. Vosko, K. A. Jackson, M. R. Pederson, D. J. Singh, and C. Fiolhais, Phys. Rev. B 46, 6671–6687 (1992).
Downloaded 02 Aug 2012 to 128.227.41.198. Redistribution subject to AIP license or copyright; see http://jcp.aip.org/about/rights_and_permissions
034102-9 38 J.
Koitz et al.
P. Perdew, K. Burke, and M. Ernzerhof, Phys. Rev. Lett. 77, 3865–3868 (1996). 39 J. P. Perdew, A. Ruzsinszky, G. I. Csonka, O. A. Vydrov, G. E. Scuseria, L. A. Constantin, X. Zhou, and K. Burke, Phys. Rev. Lett. 100, 136406 (2008). 40 T. Belling, T. Grauschopf, S. Krüger, M. Mayer, F. Nörtemann, M. Staufer, C. Zenger, and N. Rösch, in Lecture Notes in Computational Science and Engineering, edited by H. J. Bungartz, F. Durst and C. Zanger (Springer, Heidelberg, 1999), Vol. 8, pp. 441–455. 41 T. Belling, T. Grauschopf, S. Krüger, F. Nörtemann, M. Staufer, M. Mayer, V. A. Nasluzov, U. Birkenheuer, A. Hu, A. V. Matveev, A. V. Shor, M. S. K. Fuchs-Rohr, K. M. Neyman, D. I. Ganyushin, T. Kerdcharoen, A. Woiterski, S. Majumder, and N. Rösch, ParaGauss, Version 3.1. (Technische Universität München, 2006). 42 See supplementary material at http://dx.doi.org/10.1063/1.4733670 for more detailed datasets. 43 R. J. Buenker, P. Chandra, and B. A. Hess, Chem. Phys. 84, 1–9 (1984). 44 O. D. Häberlen and N. Rösch, Chem. Phys. Lett. 199, 491–496 (1992).
J. Chem. Phys. 137, 034102 (2012) 45 N. Rösch, A. V. Matveev, V. A. Nasluzov, K. M. Neyman, L. V. Moskaleva,
and S. Krüger, in Relativistic Electronic Structure Theory - Applications, edited by P. Schwerdtfeger (Elsevier, Amsterdam, 2004), pp. 656–722. 46 M. Reiher and A. Wolf, Relativistic Quantum Chemistry - The Fundamental Theory of Molecular Science (Wiley-VCH, Weinheim, 2009). 47 CRC Handbook of Chemistry and Physics 86th edition, edited by D. R. Lide (CRC, Boca Raton, FL, 2005). 48 A. Zupan, K. Burke, M. Ernzerhof, and J. P. Perdew, J. Chem. Phys. 106, 10184 (1997). 49 A. Zupan, J. P. Perdew, K. Burke, and M. Causà, Int. J. Quantum Chem. 61, 835 (1997). 50 G. Pacchioni, S.-C. Chung, S. Krüger, and N. Rösch, Chem. Phys. 184, 125–137 (1994). 51 O. D. Häberlen, S. C. Chung, and N. Rösch, Ber. Bunsenges. Phys. Chem. 98, 882–885 (1994). 52 N. Rösch and S. B. Trickey, J. Chem. Phys. 106, 8940–8941 (1997). 53 D. D. Wagman, W. H. Evans, V. B. Parker, R. H. Schumm, I. Halow, S. M. Bailey, K. L. Churney, and R. L. Nuttall, J. Phys. Chem. Ref. Data 11, 1 (1982).
Downloaded 02 Aug 2012 to 128.227.41.198. Redistribution subject to AIP license or copyright; see http://jcp.aip.org/about/rights_and_permissions