Jun 13, 2013 - function of position r. ...... power estimation playbook of Thomson (1982) by forming the âeigenvalue- ...... An investigation of hidden periodicities with application to a supposed 26-day period of meteorological phenomena,.
Geophys. J. Int. (0000) 000, 000–000
arXiv:1306.3184v1 [physics.data-an] 13 Jun 2013
Scalar and Vector Slepian Functions, Spherical Signal Estimation and Spectral Analysis Frederik J. Simons∗ and Alain Plattner Department of Geosciences, Princeton University, Guyot Hall, Princeton, NJ, USA ∗ Also with the Program in Applied and Computational Mathematics, Princeton University, Princeton, NJ, USA
14 June 2013
S UMM ARY
It is a well-known fact that mathematical functions that are timelimited (or spacelimited) cannot be simultaneously bandlimited (in frequency). Yet the finite precision of measurement and computation unavoidably bandlimits our observation and modeling scientific data, and we often only have access to, or are only interested in, a study area that is temporally or spatially bounded. In the geosciences we may be interested in spectrally modeling a time series defined only on a certain interval, or we may want to characterize a specific geographical area observed using an effectively bandlimited measurement device. It is clear that analyzing and representing scientific data of this kind will be facilitated if a basis of functions can be found that are “spatiospectrally” concentrated, i.e. “localized” in both domains at the same time. Here, we give a theoretical overview of one particular approach to this “concentration” problem, as originally proposed for time series by Slepian and coworkers, in the 1960s. We show how this framework leads to practical algorithms and statistically performant methods for the analysis of signals and their power spectra in one and two dimensions, and, particularly for applications in the geosciences, for scalar and vectorial signals defined on the surface of a unit sphere. Key words: inverse theory, satellite geodesy, sparsity, spectral analysis, spherical harmonics, statistical methods
1
INTRODUCTION
It is well appreciated that functions cannot have finite support in the temporal (or spatial) and spectral domain at the same time (Slepian 1983). Finding and representing signals that are optimally concentrated in both is a fundamental problem in information theory which was solved in the early 1960s by Slepian, Landau and Pollak (Slepian & Pollak 1961; Landau & Pollak 1961, 1962). The extensions and generalizations of this problem (Daubechies 1988; Daubechies & Paul 1988; Cohen 1989; Daubechies 1990) have strong connections with the burgeoning field of wavelet analysis. In this contribution, however, we shall not talk about wavelets, the scaled translates of a “mother” with vanishing moments, the tool for multi-resolution analysis (Daubechies 1992; Flandrin 1998; Mallat 1998). Rather, we devote our attention entirely to what we shall collectively refer to as “Slepian functions”, in multiple Cartesian dimensions and on the sphere. These we understand to be orthogonal families of functions that are all defined on a common, e.g. geographical, domain, where they are either optimally concentrated or within which they are exactly limited, and which at the same time are exactly confined within a certain bandwidth, or maximally concentrated therein. The measure of concentration is invariably a quadratic energy ratio, which, though only one choice out of many (Donoho & Stark 1989; Freeden & Windheuser 1997; Riedel & Sidorenko 1995; Freeden & Schreiner 2010; Michel 2010) is perfectly suited to the nature of the problems we are attempting to address. These are, for example: How do we make estimates of signals that are noisily and incompletely observed? How do we analyze the properties of such signals efficiently, and how can we represent them economically? How do we estimate the power spectrum of noisy and incomplete data? What are the particular constraints imposed by dealing with potential-field signals (gravity, magnetism, etc) and how is the altitude of the observation point, e.g. from a satellite in orbit, taken into account? What are the statistical properties of the resulting signal and power spectral estimates? These and other questions have been studied extensively in one dimension, that is, for time series, but until the twentyfirst century, remarkably little work had been done in the Cartesian plane or on the surface of the sphere. For the geosciences, the latter two domains of application are nevertheless vital for the obvious reasons that they deal with information (measurement and modeling) that is geographically distributed on (a portion of) a planetary surface. In our own recent series of papers (Wieczorek & Simons 2005; Simons et al. 2006; Simons & Dahlen 2006, 2007; Wieczorek & Simons 2007;
2
Simons and Plattner
Dahlen & Simons 2008; Simons et al. 2009; Plattner et al. 2012; Plattner & Simons 2013) we have dealt extensively with Slepian’s problem in spherical geometry; asymptotic reductions to the plane (Simons et al. 2006; Simons & Wang 2011) then generalize Slepian’s early treatment of the multidimensional Cartesian case (Slepian 1964). In this chapter we provide a framework for the analysis and representation of geoscientific data by means of Slepian functions defined for time series, on two-dimensional Cartesian, and spherical domains. We emphasize the common ground underlying the construction of all Slepian functions, discuss practical algorithms, and review the major findings of our own recent work on signal (Wieczorek & Simons 2005; Simons & Dahlen 2006) and power spectral estimation theory on the sphere (Wieczorek & Simons 2007; Dahlen & Simons 2008). Compared to the first edition of this work (Simons 2010) we now also include a section on vector -valued Slepian functions that brings the theory in line with the modern demands of (satellite) gravity, geomagnetic or oceanographic data analysis (Freeden 2010; Olsen et al. 2010; Grafarend et al. 2010; Martinec 2010; Sabaka et al. 2010).
2
THEORY OF SLEPIAN FUNCTIONS
In this section we review the theory of Slepian functions in one dimension, in the Cartesian plane, and on the surface of the unit sphere. The one-dimensional theory is quite well known and perhaps most accessibly presented in the textbook by Percival and Walden (Percival & Walden 1993). It is briefly reformulated here for consistency and to establish some notation. The two-dimensional planar case formed the subject of a lesser-known of Slepian’s papers (Slepian 1964) and is reviewed here also. We are not discussing alternatives by which two-dimensional Slepian functions are constructed by forming the outer product of pairs of one-dimensional functions. While this approach has produced some useful results (Hanssen 1997; Simons et al. 2000), it does not solve the concentration problem sensu stricto. The spherical scalar case was treated in most detail, and for the first time, by ourselves elsewhere (Wieczorek & Simons 2005; Simons et al. 2006; Simons & Dahlen 2006), though two very important early studies by Slepian, Gr¨ unbaum, and others, laid much of the foundation for the analytical treatment of the spherical concentration problem for cases with special symmetries (Gilbert & Slepian 1977; Gr¨ unbaum 1981). The spherical vector case was treated in its most general form by ourselves elsewhere (Plattner et al. 2012; Plattner & Simons 2013), but had also been studied in some, but less general, detail by researchers interested in medical imaging (Maniar & Mitra 2005; Mitra & Maniar 2006) and optics (Jahn & Bokor 2012, 2013a). Finally, we recast the theory in the context of reproducingkernel Hilbert spaces, through which the reader may appreciate some of the connections with radial basis functions, splines, and wavelet analysis, which are commonly formulated in such a framework (Freeden et al. 1998; Michel 2010).
2.1 2.1.1
Spatiospectral Concentration for Time Series General Theory in One Dimension
We use t to denote time or one-dimensional space and ω for angular frequency, and adopt a normalization convention (Mallat 1998) in which a real-valued time-domain signal f (t) and its Fourier transform F (ω) are related by Z ∞ Z ∞ f (t) = (2π)−1 F (ω)eiωt dω, F (ω) = f (t)e−iωt dt. (1) −∞
−∞
The problem of finding the strictly bandlimited signal g(t) = (2π)−1
Z
W
G(ω)eiωt dω,
(2)
−W
that is maximally, though by virtue of the Paley-Wiener theorem (Daubechies 1992; Mallat 1998) never completely, concentrated into a time interval |t| ≤ T was first considered by Slepian, Landau and Pollak (Slepian & Pollak 1961; Landau & Pollak 1961). The optimally concentrated signal is taken to be the one with the least energy outside of the interval: Z T g 2 (t) dt −T λ= Z ∞ = maximum. (3) g 2 (t) dt −∞
Bandlimited functions g(t) satisfying the variational problem (3) have spectra G(ω) that satisfy the frequency-domain convolutional integral eigenvalue equation Z W D(ω, ω ′ ) G(ω ′ ) dω ′ = λG(ω), |ω| ≤ W, (4a) −W
D(ω, ω ′ ) =
sin T (ω − ω ′ ) . π(ω − ω ′ )
(4b)
Scalar and Vector Slepian Functions The corresponding time- or spatial-domain formulation is Z T D(t, t′ ) g(t′ ) dt′ = λg(t), −T
D(t, t′ ) =
t ∈ R,
sin W (t − t′ ) . π(t − t′ )
3
(5a)
(5b)
The “prolate spheroidal eigentapers” g1 (t), g2 (t), . . . that solve eq. (5) form a doubly orthogonal set. When they are chosen to be orthonormal over infinite time |t| ≤ ∞ they are also orthogonal over the finite interval |t| ≤ T : Z ∞ Z T gα gβ dt = δαβ , gα gβ dt = λα δαβ . (6) −∞
−T
A change of variables and a scaling of the eigenfunctions transforms eq. (4) into the dimensionless eigenproblem Z 1 D(x, x′ ) ψ(x′ ) dx′ = λψ(x),
(7a)
−1
D(x, x′ ) =
sin T W (x − x′ ) . π(x − x′ )
(7b)
Eq. (7) shows that the eigenvalues λ1 > λ2 > . . . and suitably scaled eigenfunctions ψ1 (x), ψ2 (x), . . . depend only upon the time-bandwidth product T W . The sum of the concentration eigenvalues λ relates to this product by Z 1 ∞ X 2T W (2T )(2W ) = . (8) λα = N 1D = D(x, x) dx = 2π π −1 α=1
The eigenvalue spectrum of eq. (7) has a characteristic step shape, showing significant (λ ≈ 1) and insignificant (λ ≈ 0) eigenvalues separated by a narrow transition band (Landau 1965; Slepian & Sonnenblick 1965). Thus, this “Shannon number” is a good estimate of the number of significant eigenvalues, or, roughly speaking, N 1D is the number of signals f (t) that can be simultaneously well concentrated into a finite time interval |t| ≤ T and a finite frequency interval |ω| ≤ W . In other words (Landau & Pollak 1962), N 1D is the approximate dimension of the space of signals that is “essentially” timelimited to T and bandlimited to W , and using the orthogonal set g1 , g2 , . . . , gN 1D as its basis is parsimonious. 2.1.2
Sturm-Liouville Character and Tridiagonal Matrix Formulation
The integral operator acting upon ψ in eq. (7) commutes with a differential operator that arises in expressing the threedimensional scalar wave equation in prolate spheroidal coordinates (Slepian & Pollak 1961; Slepian 1983), which makes it possible to find the scaled eigenfunctions ψ by solving the Sturm-Liouville equation � � � � d dψ (N 1D )2 π 2 2 x ψ = 0, (9) (1 − x2 ) + χ− dx dx 4 where χ 6= λ is the associated eigenvalue. The eigenfunctions ψ(x) of eq. (9) can be found at discrete values of x by diagonalization of a simple symmetric tridiagonal matrix (Slepian 1978; Gr¨ unbaum 1981; Percival & Walden 1993) with elements ([N − 1 − 2x]/2)2 cos(2πW )
x(N − x)/2
for for
x = 0, · · · , N − 1,
x = 1, . . . , N − 1.
(10)
The matching eigenvalues λ can then be obtained directly from eq. (7). The discovery of the Sturm-Liouville formulation of the concentration problem posed in eq. (3) proved to be a major impetus for the widespread adoption and practical applications of the “Slepian” basis in signal identification, spectral analysis and numerical analysis. Compared to the sequence of eigenvalues λ, the spectrum of the eigenvalues χ is extremely regular and thus the solution of eq. (9) is without any problem amenable to finite-precision numerical computation (Percival & Walden 1993). 2.2 2.2.1
Spatiospectral Concentration in the Cartesian Plane General Theory in Two Dimensions
A square-integrable function f (x) defined in the plane has the two-dimensional Fourier representation Z ∞ Z ∞ f (x) = (2π)−2 F (k)eik·x dk, F (k) = f (x)e−ik·x dx,
(11)
We use g(x) to denote a function that is bandlimited to K, an arbitrary subregion of spectral space, Z −2 g(x) = (2π) G(k)eik·x dk.
(12)
−∞
−∞
K
4
Simons and Plattner
Following Slepian (1964), we seek to concentrate the power of g(x) into a finite spatial region R ∈ R2 , of area A: Z g 2 (x) dx = maximum. λ= Z R ∞ g 2 (x) dx
(13)
−∞
Bandlimited functions g(x) that maximize the Rayleigh quotient (13) solve the Fredholm integral equation (Tricomi 1970) Z D(k, k′ ) G(k′ ) dk′ = λ G(k), k ∈ K, (14a) K
D(k, k′ ) = (2π)−2
Z
′
ei(k −k)·x dx.
The corresponding problem in the spatial domain is Z D(x, x′ ) g(x′ ) dx′ = λ g(x),
x ∈ R2 ,
R
D(x, x′ ) = (2π)−2
(14b)
R
Z
′
eik·(x−x ) dk.
(15a)
(15b)
K
The bandlimited spatial-domain eigenfunctions g1 (x), g2 (x), . . . and eigenvalues λ1 ≥ λ2 ≥ . . . that solve eq. (15) may be chosen to be orthonormal over the whole plane kxk ≤ ∞ in which case they are also orthogonal over R: Z ∞ Z gα gβ dx = δαβ , gα gβ dx = λα δαβ . (16) −∞
R
Concentration to the disk-shaped spectral band K = {k : kkk ≤ K} allows us to rewrite eq. (15) after a change of variables and a scaling of the eigenfunctions as Z D(ξ, ξ′ ) ψ(ξ′ ) dξ′ = λ ψ(ξ), (17a) R∗
D(ξ, ξ′ ) =
K
p A/4π J1 (K A/4π kξ − ξ′ k) , 2π kξ − ξ ′ k
p
(17b)
where the region R∗ is scaled to area 4π and J1 is the first-order Bessel function of the first kind. Eq. (17) shows that, also in the two-dimensional case, the eigenvalues λ1 , λ2 , . . . and the scaled eigenfunctions ψ1 (ξ), ψ2 (ξ), . . . depend only on the combination of the circular bandwidth K and the spatial concentration area A, where the quantity K 2 A/(4π) now plays the role of the time-bandwidth product T W in the one-dimensional case. The sum of the concentration eigenvalues λ defines the two-dimensional Shannon number N 2D as Z ∞ X (πK 2 )(A) A N 2D = λα = D(ξ, ξ) dξ = = K2 . (18) 2 4π (2π) R ∗ α=1 Just as N 1D in eq. (8), N 2D is the product of the spectral and spatial areas of concentration multiplied by the “Nyquist density” (Daubechies 1988, 1992). And, similarly, it is the effective dimension of the space of “essentially” space- and bandlimited functions in which the set of two-dimensional functions g1 , g2 , . . . , gN 2D may act as a sparse orthogonal basis. After a long hiatus since the work of Slepian (1964), the two-dimensional problem has recently been the focus of renewed attention in the applied mathematics community (de Villiers et al. 2003; Shkolnisky 2007), and applications to the geosciences are following suit (Simons & Wang 2011). Numerous numerical methods exist to use eqs (14)–(15) in solving the concentration problem (13) on two-dimensional Cartesian domains. An example of Slepian functions on a geographical domain in the Cartesian plane can be found in Figure 1.
2.2.2
Sturm-Liouville Character and Tridiagonal Matrix Formulation
If in addition to the circular spectral limitation, space is also circularly limited, in other words, if the spatial region of concentration or limitation R is a circle of radius R, then a polar coordinate, x = (r, θ), representation √ 2 g(r) cos mθ if m < 0, g(r, θ) = (19) g(r) if m = 0, √ 2 g(r) sin mθ if m > 0,
5
Scalar and Vector Slepian Functions
northing (km)
λ1 = 0.971268
λ2 = 0.957996
λ3 = 0.936969
λ = 0.894682 4
400 0 −400 −500
0 500 easting (km)
−500
0 500 easting (km)
−500
−500
0 500 easting (km)
0 500 easting (km)
k /k
Nyq y y
0.1
0
−0.1 −0.1
0
0.1 −0.1
0
k /kNyq x x
0.1 −0.1
k /kNyq x x
0
0.1 −0.1
0
0.1
Nyq k /k x x
k /kNyq x x
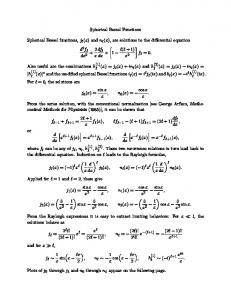
Figure 1. Bandlimited eigenfunctions g1 , g2 , . . . , g4 that are optimally concentrated within the Columbia Plateau, a physiographic region in the United States centered on 116.02◦ W 43.56◦ N (near Boise City, Idaho) of area A ≈ 145 × 103 km2 . The concentration factors λ1 , λ2 , . . . , λ4 are indicated; the Shannon number N 2D = 10. The top row shows a rendition of the eigenfunctions in space on a grid with 5 km resolution in both directions, with the convention that positive values are blue and negative values red, though the sign of the functions is arbitrary. The spatial concentration region is outlined in black. The bottom row shows the squared Fourier coefficients |Gα (k)|2 as calculated from the functions gα (x) shown, on a wavenumber scale that is expressed as a fraction of the Nyquist wavenumber. The spectral limitation region is shown by the black circle at wavenumber K = 0.0295 rad/km. All areas for which the absolute value of the functions plotted is less than one hundredth of the maximum value attained over the domain are left white. The calculations were performed by the Nystr¨ om method using Gauss-Legendre integration of eq. (17) in the two-dimensional spatial domain (Simons & Wang 2011).
may be used to decompose eq. (17) into a series of non-degenerate fixed-order eigenvalue problems, after scaling, Z 1 D(ξ, ξ ′ ) ψ(ξ ′ ) ξ ′ dξ ′ = λ ψ(ξ),
(20a)
0
D(ξ, ξ ′ ) = 4N 2D
Z
1 0
√ √ � � Jm 2 N 2D pξ Jm 2 N 2D pξ ′ p dp.
The solutions to eq. (20) also solve a Sturm-Liouville equation on 0 ≤ ξ ≤ 1. In terms of ϕ(ξ) = � � � � d dϕ 1/4 − m2 2D 2 ϕ = 0, (1 − ξ 2 ) + χ+ − 4N ξ dξ dξ ξ2
(20b) √
ξ ψ(ξ), (21)
for some χ 6= λ. When m = ±1/2 eq. (21) reduces to eq. (9). By extension to ξ > 1 the fixed-order “generalized prolate spheroidal functions” ϕ1 (ξ), ϕ2 (ξ), . . . can be determined from the rapidly converging infinite series ϕ(ξ) =
√
∞ Jm+2l+1 (c ξ) 2X √ (2l + m + 1)1/2 dl , γ l=0 cξ
ξ ∈ R+ ,
(22)
where ϕ(0) = 0 and the fixed-m expansion coefficients dl are determined by recursion (Slepian 1964) or by diagonalization of a symmetric tridiagonal matrix (de Villiers et al. 2003; Shkolnisky 2007) with elements given by �� � � � � 3 c2 m2 1 2l + m + + 1+ , Tll = 2l + m + 2 2 2 (2l + m)(2l + m + 2) Tl+1 l
=
−√
c2 (l + 1)(m + l + 1) √ , 2l + m + 1 (2l + m + 2) 2l + m + 3
(23)
6
Simons and Plattner
where the parameter l ranges from 0 to some large value that ensures convergence. The desired concentration eigenvalues λ can subsequently be obtained by direct integration of eq. (17), or, alternatively, from !−1 ∞ X √ cm+1/2 d0 dl . (24) λ = 2γ 2 N 2D , with γ = m+1 2 (m + 1)! l=0
An example of Slepian functions on a disk-shaped region in the Cartesian plane can be found in Figure 2. The solutions were obtained using the Nystr¨ om method using Gauss-Legendre integration of eq. (17) in the two-dimensional spatial domain. These differ only very slightly from the results of computations carried out using the diagonalization of eqs (23) directly, as shown and discussed by us elsewhere (Simons & Wang 2011). 2.3 2.3.1
Spatiospectral Concentration on the Surface of a Sphere General Theory in “Three” Dimensions
We denote the colatitude of a geographical point ˆ r on the unit sphere surface Ω = {ˆ r : kˆ rk = 1} by 0 ≤ θ ≤ π and the longitude by 0 ≤ φ < 2π. We use R to denote a region of Ω, of area A, within which we seek to concentrate a bandlimited function of position ˆ r. We express a square-integrable function f (ˆ r) on the surface of the unit sphere as f (ˆ r) =
∞ X l X
flm Ylm (ˆ r),
flm =
l=0 m=−l
Z
f (ˆ r)Ylm (ˆ r) dΩ,
(25)
Ω
using orthonormalized real surface spherical harmonics (Edmonds 1996; Dahlen & Tromp 1998) √ 2Xl|m| (θ) cos mφ if −l ≤ m < 0, Ylm (ˆ r) = Ylm (θ, φ) = Xl0 (θ) if m = 0, √ 2X (θ) sin mφ if 0 < m ≤ l,
(26)
lm
Xlm (θ)
=
Plm (µ)
=
�1/2 (l − m)! Plm (cos θ), (−1) (l + m)! � �l+m 1 d (1 − µ2 )m/2 (µ2 − 1)l . 2l l! dµ m
�
2l + 1 4π
�1/2 �
(27) (28)
The quantity 0 ≤ l ≤ ∞ is the angular degree of the spherical harmonic, and −l ≤ m ≤ l is its angular order. The function Plm (µ) defined in (28) is the associated Legendre function of integer degree l and order m. Our choice of the constants in eqs (26)–(27) orthonormalizes the harmonics on the unit sphere: Z (29) Ylm Yl′ m′ dΩ = δll′ δmm′ , Ω
and leads to the addition theorem in terms of the Legendre functions Pl (µ) = Pl0 (µ) as � � l X 2l + 1 Ylm (ˆ r)Ylm (ˆ r′ ) = Pl (ˆ r ·ˆ r′ ). 4π
(30)
m=−l
To maximize the spatial concentration of a bandlimited function g(ˆ r) =
L l X X
glm Ylm (ˆ r)
(31)
= maximum.
(32)
l=0 m=−l
within a region R, we maximize the energy ratio Z
g 2 (ˆ r) dΩ
λ = ZR
g 2 (ˆ r) dΩ
Ω
Maximizing equation (32) leads to the positive-definite spectral-domain eigenvalue equation ′
l L X X
Dlm,l′ m′ gl′ m′ = λglm ,
l′ =0 m′ =−l′
D
lm,l′ m′
=
Z
Ylm Yl′ m′ dΩ, R
0 ≤ l ≤ L,
(33a)
(33b)
Scalar and Vector Slepian Functions λ1 = 1.000000
λ2 = 1.000000
λ3 = 1.000000
λ4 = 0.999998
λ5 = 0.999998
λ = 0.999997
λ = 0.999974
λ = 0.999974
λ = 0.999930
λ
= 0.999930
λ
λ
= 0.999738
λ
= 0.999121
λ
λ
= 0.998757
λ16 = 0.998029
λ17 = 0.998028
λ
= 0.992470
λ19 = 0.992470
λ20 = 0.988706
λ21 = 0.988701
λ22 = 0.986945
λ23 = 0.986930
λ24 = 0.955298
λ25 = 0.955287
λ26 = 0.951126
λ27 = 0.951109
λ28 = 0.915710
λ29 = 0.915709
λ30 = 0.898353
6
11
= 0.999738
7
12
8
13
18
9
14
= 0.999121
10
15
7
Figure 2. Bandlimited eigenfunctions gα (r, θ) that are optimally concentrated within a Cartesian disk of radius R = 1. The dashed circle denotes the region boundary. The Shannon number N 2D = 42. The eigenvalues λα have been sorted to a global ranking with the best concentrated eigenfunction plotted at the top left and the 30th best in the lower right. Blue is positive and red is negative and the color axis is symmetric, but the sign is arbitrary; regions in which the absolute value is less than one hundredth of the maximum value on the domain are left white. The calculations were performed by Gauss-Legendre integration in the two-dimensional spatial domain, which sometimes leads to slight differences in the last two digits of what should be identical eigenvalues for each pair of non-circularly-symmetric eigenfunctions.
8
Simons and Plattner
and we may equally well rewrite eq. (33) as a spatial-domain eigenvalue equation: Z
D(ˆ r, ˆ r′ ) g(ˆ r′ ) dΩ′ = λg(ˆ r), R
D(ˆ r, ˆ r′ ) =
� L � X 2l + 1 l=0
4π
ˆ r ∈ Ω,
Pl (ˆ r·ˆ r′ ),
(34a)
(34b)
where Pl is the Legendre function of degree l. Eq. (34) is a homogeneous Fredholm integral equation of the second kind, with a finite-rank, symmetric, Hermitian kernel. We choose the spectral eigenfunctions of the operator in eq. (33b), whose elements are glm α , α = 1, . . . , (L + 1)2 , to satisfy the orthonormality relations L X
glm α glm β = δαβ ,
L X
glm α
lm
lm
L X
Dlm,l′ m′ gl′ m′ β = λα δαβ .
(35)
l′ m′
r) can be made orthonormal over the whole The finite set of bandlimited spatial eigensolutions g1 (ˆ r), g2 (ˆ r), . . . , g(L+1)2 (ˆ sphere Ω and orthogonal over the region R: Z
gα gβ dΩ = δαβ , Ω
Z
gα gβ dΩ = λα δαβ .
(36)
R
In the limit of a small area A → 0 and a large bandwidth L → ∞ and after a change of variables, a scaled version of eq. (34) will be given by Z
D(ξ, ξ′ ) ψ(ξ′ ) dΩ′∗ = λ ψ(ξ),
(37a)
R∗
p p (L + 1) A/4π J1 [(L + 1) A/4π kξ − ξ′ k] D(ξ, ξ ) = , 2π kξ − ξ′ k ′
(37b)
where the scaled region R∗ now has area 4π and J1 again is the first-order Bessel function of the first kind. As in the one- and two-dimensional case, the asymptotic, or “flat-Earth” eigenvalues λ1 ≥ λ2 ≥ . . . and scaled eigenfunctions ψ1 (ξ), ψ2 (ξ), . . . depend upon the maximal degree L and the area A only through what is once again a space-bandwidth product, the “spherical Shannon number”, this time given by (L+1)2
N
3D
=
X
α=1
=
Z
λα =
L l X X
Dlm,lm =
l=0 m=−l
D(ξ, ξ) dΩ∗ = (L + 1)2 R∗
A . 4π
Z
D(ˆ r, ˆ r) dΩ R
(38)
Irrespectively of the particular region of concentration that they were designed for, the complete set of bandlimited spatial Slepian eigenfunctions g1 , g2 , . . . , g(L+1)2 is a basis for bandlimited scalar processes anywhere on the surface of the unit sphere (Simons et al. 2006; Simons & Dahlen 2006). This follows directly from the fact that the spectral localization kernel (33b) is real, symmetric, and positive definite: its eigenvectors g1 lm , g2 lm , . . . , g(L+1)2 lm form an orthogonal set as we have seen. Thus the Slepian basis functions gα (ˆ r), α = 1, . . . , (L + 1)2 given by eq. (31) simply transform the same-sized limited set of spherical harmonics Ylm (ˆ r), 0 ≤ l ≤ L, −l ≤ m ≤ l that are a basis for the same space of bandlimited spherical functions with no power above the bandwidth L. The effect of this transformation is to order the resulting basis set such that the r), with eigenvalues λ ≈ 1, is concentrated in the region R, whereas the energy of the first N 3D functions, g1 (ˆ r), . . . , gN 3D (ˆ r), are concentrated in the complimentary region Ω \ R. As in the one- and remaining eigenfunctions, gN 3D +1 (ˆ r), . . . , g(L+1)2 (ˆ two-dimensional case, therefore, the reduced set of basis functions g1 , g2 , . . . , gN 3D can be regarded as a sparse, global, basis suitable to approximate bandlimited processes that are primarily localized to the region R. The dimensionality reduction is dependent on the fractional area of the region of interest. In other words, the full dimension of the space (L + 1)2 can be “sparsified” to an effective dimension of N 3D = (L + 1)2 A/(4π) when the signal of interest resides in a particular geographic region. Numerical methods for the solution of eqs (33)–(34) on completely general domains on the surface of the sphere were discussed by us elsewhere (Simons et al. 2006; Simons & Dahlen 2006, 2007). An example of Slepian functions on a geographical domain on the surface of the sphere is found in Figure 3.
Scalar and Vector Slepian Functions
9
−65° −75° −85° −95° −105°
λ = 1.000
λ = 1.000
λ = 1.000
λ = 1.000
λ = 1.000
λ = 1.000
λ = 1.000
λ = 1.000
λ = 1.000
λ = 1.000
λ = 1.000
λ = 1.000
−115° −65° −75° −85° −95° −105° −115° −65° −75° −85° −95° −105° −115° −65° −75° −85° −95° −105° −115° −30°
−15°
0°
15°
30°
−30°
−15°
0°
15°
30°
−30°
−15°
0°
15°
30°
Figure 3. Bandlimited L = 60 eigenfunctions g1 , g2 , . . . , g12 that are optimally concentrated within Antarctica. The concentration factors λ1 , λ2 , . . . , λ12 are indicated; the rounded Shannon number is N 3D = 102. The order of concentration is left to right, top to bottom. Positive values are blue and negative values are red; the sign of an eigenfunction is arbitrary. Regions in which the absolute value is less than one hundredth of the maximum value on the sphere are left white. We integrated eq. (33b) over a splined highresolution representation of the boundary, using Gauss-Legendre quadrature over the colatitudes, and analytically in the longitudinal dimension (Simons & Dahlen 2007).
2.3.2
Sturm-Liouville Character and Tridiagonal Matrix Formulation
In the special but important case in which the region of concentration is a circularly symmetric cap of colatitudinal radius Θ, centered on the North Pole, the colatitudinal parts g(θ) of the separable functions √ 2 g(θ) cos mφ if −L ≤ m < 0, g(θ, φ) = (39) g(θ) if m = 0, √2 g(θ) sin mφ if 0 < m ≤ L, which solve eq. (34), or, indeed, the fixed-order versions Z Θ D(θ, θ′ ) g(θ′ ) sin θ′ dθ′ = λg(θ), 0
D(θ, θ′ ) = 2π
L X
l=m
0 ≤ θ ≤ π,
Xlm (θ)Xlm (θ′ ),
(40a)
(40b)
10
Simons and Plattner
are identical to those of a Sturm-Liouville equation for the g(θ). In terms of µ = cos θ, � � � � dg m2 (µ − cos Θ) d g = 0, (µ − cos Θ)(1 − µ2 ) + χ + L(L + 2)µ − dµ dµ 1 − µ2
(41)
with χ 6= λ. This equation can be solved in the spectral domain by diagonalization of a simple symmetric tridiagonal matrix with a very well-behaved spectrum (Simons et al. 2006; Simons & Dahlen 2007). This matrix, whose eigenfunctions correspond to the glm of eq. (31) at constant m is given by Tll Tl l+1
=
−l(l + 1) cos Θ,
=
�
l(l + 2) − L(L + 2)
�
s
(l + 1)2 − m2 . (2l + 1)(2l + 3)
(42)
Moreover, when the region of concentration is a pair of axisymmetric polar caps of common colatitudinal radius Θ centered on the North and South Pole, the g(θ) can be obtained by solving the Sturm-Liouville equation � � � � m2 (µ2 − cos2 Θ) d dg g = 0, (43) (µ2 − cos2 Θ)(1 − µ2 ) + χ + Lp (Lp + 3)µ2 − dµ dµ 1 − µ2 where Lp = L or Lp = L − 1 depending whether the order m of the functions g(θ, φ) in eq. (39) is odd or even, and whether the bandwidth L itself is odd or even. In their spectral form the coefficients of the optimally concentrated antipodal polarcap eigenfunctions only require the numerical diagonalization of a symmetric tridiagonal matrix with analytically prescribed elements and a spectrum of eigenvalues that is guaranteed to be simple (Simons & Dahlen 2006, 2007), namely Tllp
=
Tlpl+2
=
� 2 � (l + 1)2 − m2 2l + 3 � � 2 3m2 − l(l + 1) 1 − , + [(l − 2)(l + 1) − Lp (Lp + 3)] 3 3 (2l + 3)(2l − 1) �� � � �s� (l + 2)2 − m2 (l + 1)2 − m2 l(l + 3) − Lp (Lp + 3) . 2l + 3 (2l + 5)(2l + 1)
−l(l + 1) cos2 Θ +
(44)
The concentration values λ, in turn, can be determined from the defining equations (33) or (34). The spectra of the eigenvalues χ of eqs (42) and (44) display roughly equant spacing, without the numerically troublesome plateaus of nearly equal values that characterizes the eigenvalues λ. Thus, for the special cases of symmetric single and double polar caps, the concentration problem posed in eq. (32) is not only numerically feasible also in circumstances where direct solution methods are bound to fail (Albertella et al. 1999), but essentially trivial in every situation. In practical applications, the eigenfunctions that are optimally concentrated within a polar cap can be rotated to an arbitrarily positioned circular cap on the unit sphere using standard spherical harmonic rotation formulae (Blanco et al. 1997; Dahlen & Tromp 1998; Edmonds 1996).
2.4
Vectorial Slepian Functions on the Surface of a Sphere
2.4.1
General Theory in “Three” Vectorial Dimensions
The expansion of a real-valued square-integrable vector field f (ˆ r) on the unit sphere Ω can be written as f (ˆ r) =
∞ X l X
P B C flm Plm (ˆ r) + flm Blm (ˆ r) + flm Clm (ˆ r),
(45a)
l=0 m=−l
P flm
=
Z
Ω
Plm (ˆ r) · f (ˆ r) dΩ,
B flm
=
Z
Ω
Blm (ˆ r) · f (ˆ r) dΩ,
and
C flm
=
Z
Ω
Clm (ˆ r) · f (ˆ r) dΩ,
(45b)
using real vector surface spherical harmonics (Dahlen & Tromp 1998; Sabaka et al. 2010; Gerhards 2011) that are constructed ˆ φ) ˆ and using the surface gradient from the scalar harmonics in eq. (26), as follows. In the vector spherical coordinates (ˆ r, θ, ˆ ∇1 = θˆ∂θ + φ(sin θ)−1 ∂φ , we write for l > 0 and −m ≤ l ≤ m, Plm (ˆ r)
=
Blm (ˆ r)
=
Clm (ˆ r)
=
ˆ rYlm (ˆ r), ˆ ∇1 Ylm (ˆ r) [θˆ∂θ + φ(sin θ)−1 ∂φ ]Ylm (ˆ r) p p = , l(l + 1) l(l + 1) ˆ ∂θ ]Ylm (ˆ −ˆ r × ∇1 Ylm (ˆ r) [θˆ(sin θ)−1 ∂φ − φ r) p p = , l(l + 1) l(l + 1)
(46) (47) (48)
Scalar and Vector Slepian Functions
11
B C together with the purely radial P00 = (4π)−1/2 ˆ r, and with flm = flm = 0. The remaining expansion coefficients (45b) are naturally obtained from eq. (45a) through the orthonormality relationships Z Z Z Plm · Pl′ m′ dΩ = Blm · Bl′ m′ dΩ = (49a) Clm · Cl′ m′ dΩ = δll′ δmm′ , ZΩ ZΩ ZΩ Plm · Bl′ m′ dΩ = Plm · Cl′ m′ dΩ = (49b) Blm · Cl′ m′ dΩ = 0. Ω
Ω
Ω
The vector spherical-harmonic addition theorem (Freeden & Schreiner 2009) implies the limited result l X
m=−l
Plm (ˆ r) · Plm (ˆ r) =
�
2l + 1 4π
�
=
l X
m=−l
Blm (ˆ r) · Blm (ˆ r) =
l X
m=−l
Clm (ˆ r) · Clm (ˆ r).
(50)
As before we seek to maximize the spatial concentration of a bandlimited spherical vector function g(ˆ r) =
L l X X
P B C glm Plm (ˆ r) + glm Blm (ˆ r) + glm Clm (ˆ r)
(51)
l=0 m=−l
within a certain region R, in the vectorial case by maximizing the energy ratio Z g · g dΩ λ = ZR = maximum. g · g dΩ
(52)
Ω
The maximization of eq. (52) leads to a coupled system of positive-definite spectral domain eigenvalue equations ′
l L X X
Dlm,l′ m′ glP′ m′
=
P λglm ,
0 ≤ l ≤ L,
(53a)
Blm,l′ m′ glB′ m′ + Clm,l′ m′ glC′ m′
=
B λglm ,
0 ≤ l ≤ L,
(53b)
C T B Clm,l ′ m′ gl′ m′ + Blm,l′ m′ gl′ m′
=
C λglm ,
0 ≤ l ≤ L.
(53c)
l′ =0 m′ =−l′ ′
l L X X
l′ =0 m′ =−l′ ′
l L X X
l′ =0 m′ =−l′
Of the below matrix elements that complement the equations above, eq. (54a) is identical to eq (33b), Z Z Dlm,l′ m′ = Plm · Pl′ m′ dΩ = Ylm Yl′ m′ dΩ, ZR ZR Blm,l′ m′ = Blm · Bl′ m′ dΩ = Clm · Cl′ m′ dΩ, R ZR Clm,l′ m′ = Blm · Cl′ m′ dΩ,
(54a) (54b) (54c)
R
and the transpose of eq. (54c) switches its sign. The radial vectorial concentration problem (53a)–(54a) is identical to the corresponding scalar case (33b), and can be solved separately from the tangential equations. Altogether, in the space domain, the equivalent eigenvalue equation is Z D(ˆ r, ˆ r′ ) · g(ˆ r′ ) dΩ = λ g(ˆ r), ˆ r ∈ Ω, (55a) R
D(ˆ r, ˆ r′ ) =
L l X X
Plm (ˆ r)Plm (ˆ r′ ) + Blm (ˆ r)Blm (ˆ r′ ) + Clm (ˆ r)Clm (ˆ r′ ),
(55b)
l=0 m=−l
a homogeneous Fredholm integral equation with a finite-rank, symmetric, separable, bandlimited kernel. Further reducing eq. (55) using the full version of the vectorial addition theorem does not yield much additional insight. After collecting the spheroidal (radial, consoidal) and toroidal expansion coefficients in a vector, P B C g = (. . . , glm , . . . , glm , . . . , glm , . . .)T
and the kernel elements Dlm,l′ m′ , Blm,l′ m′ and Clm,l′ m′ of eq. D K = 0 0
(54) into the submatrices D, B, and C, we assemble 0 0 B C . CT B
(56)
(57)
12
Simons and Plattner
In this new notation eq. (53) reads as an [3(L + 1)2 − 2] × [3(L + 1)2 − 2]-dimensional algebraic eigenvalue problem K g = λ g,
(58)
whose eigenvectors g1 , g2 , . . . , g3(L+1)2 −2 are mutually orthogonal in the sense gTα gβ = δαβ ,
gTα Kgβ = λα δαβ .
(59)
The associated eigenfields g1 (ˆ r), g2 (ˆ r), . . . , g3(L+1)2 −2 (ˆ r) are orthogonal over the region R and orthonormal over the whole sphere Ω: Z Z gα · gβ dΩ = δαβ , gα · gβ dΩ = λα δαβ . (60) Ω
R
The relations (60) for the spatial-domain are equivalent to their matrix counterparts (59). The eigenfield g1 (ˆ r) with the largest eigenvalue λ1 is the element in the space of bandlimited vector fields with most of its spatial energy within region R; the eigenfield g2 (ˆ r) is the next best-concentrated bandlimited function orthogonal to g1 (ˆ r) over both Ω and R; and so on. Finally, as in the scalar case, we can sum up the eigenvalues of the matrix K to define a vectorial spherical Shannon number 3(L+1)2 −2
N
vec
X
=
λα = trK =
α=1
= =
�
(Dlm,lm + Blm,lm + Clm,lm )
(61)
l=0 m=−l
Z "X L l X R
L l X X
l=0 m=−l
#
Plm (ˆ r) · Plm (ˆ r) + Blm (ˆ r) · Blm (ˆ r) + Clm (ˆ r) · Clm (ˆ r) dΩ
� A . 3(L + 1)2 − 2 4π
(62) (63)
To establish the last equality we used the relation (50). Given the decoupling of the radial from the tangential solutions that is apparent from eq. (57) we may subdivide the vectorial spherical Shannon number into a radial and a tangential one, N r = (L + 1)2 A/(4π) and N t = [2(L + 1)2 − 2]A/(4π), respectively. An example of tangential vectorial Slepian functions on a geographical domain on the surface of the sphere is found in Figure 4.
2.4.2
Sturm-Liouville Character and Tridiagonal Matrix Formulation
When the region of concentration R is a symmetric polar cap with colatitudinal radius Θ centered on the north pole, special rules apply that greatly facilitate the construction of the localization kernel (57). There are reductions of eq. (54) to some very manageable integrals that can be carried out exactly by recursion. Solutions for the polar cap can be rotated anywhere on the unit sphere using the same transformations that apply in the rotation of scalar functions (Blanco et al. 1997; Dahlen & Tromp 1998; Edmonds 1996; Freeden & Schreiner 2009). In the axisymmetric case the matrix elements (54a), (54b) and (54c) reduce to Z Θ Dlm,l′ m′ = 2π δmm′ Xlm Xl′ m sin θ dθ, (64) 0
=
Clm,l′ m′
=
Θ
� ′ Xlm Xl′′ m + m2 (sin θ)−2 Xlm Xl′ m sin θ dθ 0 p , l(l + 1) l′ (l′ + 1) Z Θ � ′ � 2π δ−mm′ m Xlm Xl′ m + Xlm Xl′′ m dθ 2π δ−mm′ mXlm (Θ)Xl′ m (Θ) p0 p =− , − l(l + 1) l′ (l′ + 1) l(l + 1) l′ (l′ + 1) 2π δmm′
Blm,l′ m′
Z
�
(65)
(66)
′ using the derivative notation Xlm = dXlm /dθ for the normalized associated Legendre functions of eq. (27). Eq. (66) can be easily evaluated. The integrals over the product terms Xlm Xl′ m in eq. (64) can be rewritten using Wigner 3j symbols (Wieczorek & Simons 2005; Simons et al. 2006; Plattner & Simons 2013) to simple integrals over Xl 2m or Xl 0 which ′ can be handled recursively (Paul 1978). Finally, in eq. (65) integrals of the type Xlm Xl′′ m , and m2 (sin θ)−2 Xlm Xl′ m can be rewritten as integrals over undifferentiated products of Legendre functions (Ilk 1983; Eshagh 2009; Plattner & Simons 2013). All in all, these computations are straightforward to carry out and lead to block-diagonal matrices at constant order m, which are relatively easily diagonalized. As this chapter went to press, Jahn & Bokor (2013b) reported the exciting discovery of a differential operator that commutes with the tangential part of the concentration operator (55), and a tridiagonal matrix formulation for the tangential vectorial concentration problem to axisymmetric domains. They achieve this feat by a change of basis by which to ′ reduce the vectorial problem to a scalar one that is separable in θ and φ, using the special functions Xlm ± m (sin θ)−1 Xlm (Sheppard & T¨ or¨ ok 1997). Hence they derive a commuting differential operator and a corresponding spectral matrix for the
Scalar and Vector Slepian Functions
13
−5°
−20°
−35°
λ = 1.000000
λ = 1.000000
λ = 0.999999
λ = 0.999999
λ = 0.999997
λ = 0.999997
λ = 0.999995
λ = 0.999995
λ = 0.999990
λ = 0.999990
λ = 0.999976
λ = 0.999976
−5°
−20°
−35°
−5°
−20°
−35°
−5°
−20°
−35°
120°
140°
160°
120°
140°
160°
120°
140°
160°
Figure 4. Twelve tangential Slepian functions g1 , g2 , . . . , g12 , bandlimited to L = 60, optimally concentrated within Australia. The concentration factors λ1 , λ2 , . . . , λ12 are indicated. The rounded tangential Shannon number N t = 112. Order of concentration is left to right, top to bottom. Color is absolute value (red the maximum) and circles with strokes indicate the direction of the eigenfield on the tangential plane. Regions in which the absolute value is less than one hundredth of the maximum absolute value on the sphere are left white.
concentration problem. By their approach, the solutions to the fixed-order tangential concentration problem are again solutions to a Sturm-Liouville problem with a very simple eigenvalue spectrum, and the calculations are always fast and stable, much as they are for the radial problem which completes the construction of vectorial Slepian functions on the sphere.
2.5
Mid-Term Summary
It is interesting to reflect, however heuristically, on the commonality of all of the above aspects of spatiospectral localization, in the slightly expanded context of reproducing-kernel Hilbert spaces (Nashed & Walter 1991; Daubechies 1992; Yao 1967; Amirbekyan et al. 2008; Kennedy & Sadeghi 2013). In one dimension, the Fourier orthonormality relation and the “reproducing” properties of the spatial delta function are given by Z ∞ Z ∞ ′ δ(t, t′ ) = (2π)−1 eiω(t−t ) dω, f (t′ ) δ(t, t′ ) dt′ = f (t). (67) −∞
In two Cartesian dimensions the equivalent relations are Z ∞ ′ δ(x, x′ ) = (2π)−2 eik·(x−x ) dk, −∞
−∞
Z
∞
−∞
f (x′ ) δ(x, x′ ) dx′ = f (x),
(68)
14
Simons and Plattner
and on the surface of the unit sphere we have, for the scalar case, � Z ∞ � X 2l + 1 Pl (ˆ r ·ˆ r′ ), f (ˆ r′ ) δ(ˆ r, ˆ r′ ) dΩ′ = f (ˆ r), δ(ˆ r, ˆ r′ ) = 4π Ω
(69)
l=0
and for the vector case, we have the sum of dyads δ(ˆ r, ˆ r′ ) =
∞ X l X
Plm (ˆ r)Plm (ˆ r′ ) + Blm (ˆ r)Blm (ˆ r′ ) + Clm (ˆ r)Clm (ˆ r′ ),
(70a)
l=0 m=−l
Z
Ω
f (ˆ r′ ) · δ(ˆ r, ˆ r′ ) dΩ′ = f (ˆ r).
(70b)
The integral-equation kernels (5b), (15b), (34b) and (55b) are all bandlimited spatial delta functions which are reproducing kernels for bandlimited functions of the types in eqs (2), (12), (31) and (51): Z W Z ∞ ′ D(t, t′ ) = (2π)−1 eiω(t−t ) dω, g(t′ )D(t, t′ ) dt′ = g(t), (71) −W −∞ Z Z ∞ ′ D(x, x′ ) = (2π)−2 eik·(x−x ) dk, g(x′ )D(x, x′ ) dx′ = g(x), (72) K
� L � X 2l + 1 D(ˆ r, ˆ r′ ) = Pl (ˆ r·ˆ r′ ), 4π l=0
D(ˆ r, ˆ r′ ) =
L l X X
−∞
Z
g(ˆ r′ )D(ˆ r, ˆ r′ ) dΩ = g(ˆ r),
(73)
r, ˆ r′ ) dΩ′ = g(ˆ r). g(ˆ r′ ) · D(ˆ
(74)
Ω
Plm (ˆ r)Plm (ˆ r′ )
l=0 m=−l
+Blm (ˆ r)Blm (ˆ r′ ) + Clm (ˆ r)Clm (ˆ r′ ),
Z
Ω
The equivalence of eq. (71) with eq. (5b) is through the Euler identity and the reproducing properties follow from the spectral forms of the orthogonality relations (67)–(68), which are self-evident by change-of-variables, and from the spectral form of eq. (69), which is eq. (29). Much as the delta functions of eqs (67)–(70) set up the Hilbert spaces of all square-integrable functions on the real line, in two-dimensional Cartesian space, and on the surface of the sphere (both scalar and vector functions), the kernels (71)–(74) induce the equivalent subspaces of bandlimited functions in their respective dimensions. Inasmuch as the Slepian functions are the integral eigenfunctions of these reproducing kernels in the sense of eqs. (5a), (15a), (34a), and (55a), they are complete bases for their band-limited subspaces (Slepian & Pollak 1961; Landau & Pollak 1961; Daubechies 1992; Flandrin 1998; Freeden et al. 1998; Plattner & Simons 2013). Therein, the N 1D , N 2D , N 3D or N vec best time- or space-concentrated members allow for sparse, approximate, expansions of signals that are spatially concentrated to the one-dimensional interval t ∈ [−T, T ] ⊂ R, the Cartesian region x ∈ R ⊂ R2 , or the spherical surface patch ˆ r ∈ R ⊂ Ω. As a corollary to this behavior, the infinite sets of exactly time- or spacelimited (and thus band-concentrated ) versions of the functions g, which are the eigenfunctions of eqs (5), (15), (34) and (55) with the domains appropriately restricted, are complete bases for square-integrable scalar functions on the intervals to which they are confined (Slepian & Pollak 1961; Landau & Pollak 1961; Simons et al. 2006; Plattner & Simons 2013). Expansions of such wideband signals in the small subset of their N 1D , N 2D , N 3D or N vec most band-concentrated members provide reconstructions which are constructive in the sense that they progressively capture all of the signal in the mean-squared sense, in the limit of letting their numbers grow to infinity. This second class of functions can be trivially obtained, up to a multiplicative constant, from the bandlimited Slepian functions g by simple time- or space limitation. While Slepian (Slepian & Pollak 1961; Slepian 1983), for this reason perhaps, never gave them a name, we have been referring to those as h (and h) in our own investigations of similar functions on the sphere (Simons et al. 2006; Simons & Dahlen 2006; Dahlen & Simons 2008; Plattner & Simons 2013).
3
PROBLEMS IN THE GEOSCIENCES AND BEYOND
Taking all of the above at face-value but referring again to the literature cited thus far for proof and additional context, we return to considerations closer to home, namely the estimation of geophysical (or cosmological) signals and/or their power spectra, from noisy and incomplete observations collected at or above the surface of the spheres “Earth” or “planet” (or from inside the sphere “sky”). We restrict ourselves to real-valued scalar measurements, contaminated by additive noise for which we shall adopt idealized models. We focus exclusively on data acquired and solutions expressed on the unit sphere. We have considered generalizations to problems involving satellite potential-field data collected at an altitude elsewhere (Simons & Dahlen 2006; Simons et al. 2009). We furthermore note that descriptions of the scalar gravitational and magnetic potential may be sufficient to capture the behavior of the corresponding gravity and magnetic vector fields, but that with vectorial Slepian functions versatile and demanding satellite data analysis problems will be able to get robustly handled even in the presence of noise that may be strongly heterogeneous spatially and/or over the individual vector components. Speaking quite generally, the two different statistical problems that arise when geomathematical scalar spherical data are being studied are, (i) how
Scalar and Vector Slepian Functions
15
to find the “best” estimate of the signal given the data, and (ii) how to construct from the data the “best” estimate of the power spectral density of the signal in question. There are problems intermediate between either case, for instance those that utilize the solutions to problems of the kind (i) to make inference about the power spectral density without properly solving any problems of kind (ii). Mostly such scenarios, e.g. in localized geomagnetic field analysis (Beggan et al. 2013) are born out of necessity or convenience. We restrict our analysis to the “pure” end-member problems. Thus, let there be some real-valued scalar data distributed on the unit sphere, consisting of “signal”, s and “noise”, n, and let there be some region of interest R ⊂ Ω, in other words, let � s(ˆ r) + n(ˆ r) if ˆ r ∈ R, d(ˆ r) = (75) unknown/undesired if ˆ r ∈ Ω \ R. We assume that the signal of interest can be expressed by way of spherical harmonic expansion as in eq. (25), and that it is, itself, a realization of a zero-mean, Gaussian, isotropic, random process, namely s(ˆ r) =
∞ X l X
slm Ylm (ˆ r),
hslm i = 0
l=0 m=−l
hslm sl′ m′ i = Sl δll′ δmm′ .
and
(76)
For illustration we furthermore assume that the noise is a zero-mean stochastic process with an isotropic power spectrum, i.e. hn(ˆ r)i = 0 and hnlm nl′ m′ i = Nl δll′ δmm′ , and that it is statistically uncorrelated with the signal. We refer to power as white when Sl = S or Nl = N , or, equivalently, when hn(ˆ r)n(ˆ r′ )i = N δ(ˆ r, ˆ r′ ). Our objectives are thus (i) to determine the best estimate sˆlm of the spherical harmonic expansion coefficients slm of the signal and (ii) to find the best estimate Sˆl for the isotropic power spectral density Sl . While in the physical world there can be no limit on bandwidth, practical restrictions force any and all of our estimates to be bandlimited to some maximum spherical harmonic degree L, thus by necessity sˆlm = 0 and Sˆl = 0 for l > L: sˆ(ˆ r) =
L l X X
sˆlm Ylm (ˆ r).
(77)
l=0 m=−l
This limitation, combined with the statements eq. (75) on the data coverage or the study region of interest, naturally leads us back to the concept of “spatiospectral concentration”, and, as we shall see, solving either problem (i) or (ii) will gain from involving the “localized” scalar Slepian functions rather than, or in addition to, the “global” spherical harmonics basis. This leaves us to clarify what we understand by “best” in this context. While we adopt the traditional statistical metrics of bias, variance, and mean-squared error to appraise the quality of our solutions (Cox & Hinkley 1974; Bendat & Piersol 2000), the resulting connections to sparsity will be real and immediate, owing to the Slepian functions being naturally instrumental in constructing efficient, consistent and/or unbiased estimates of either sˆlm or Sˆl . Thus, we define v = hˆ s2 i − hˆ s i2 ,
b = hˆ si − s,
ǫ = sˆ − s,
and
hǫ2 i = v + b2
(78)
for problem (i), where the lack of subscript indicates that we can study variance, bias and mean-squared error of the estimate of the coefficients sˆlm but also of their spatial expansion sˆ(ˆ r). For problem (ii) on the other hand, we focus on the estimate of the isotropic power spectrum at a given spherical harmonic degree l by identifying vl = hSˆl2 i − hSˆl i2 ,
bl = hSˆl i − Sl ,
ǫl = Sˆl − Sl ,
and
hǫ2l i = vl + b2l .
(79)
Depending on the application, the “best” estimate could mean the unbiased one with the lowest variance (Tegmark 1997; Tegmark et al. 1997; Bond et al. 1998; Oh et al. 1999; Hinshaw et al. 2003), it could be simply the minimum-variance estimate having some acceptable and quantifiable bias (Wieczorek & Simons 2007), or, as we would usually prefer, it would be the one with the minimum mean-squared error (Simons & Dahlen 2006; Dahlen & Simons 2008).
3.1 3.1.1
Problem (i): Signal Estimation from Spherical Data Spherical Harmonic Solution
Paraphrasing results elaborated elsewhere (Simons & Dahlen 2006), we write the bandlimited solution to the damped inverse problem Z Z s2 dΩ = minimum, (80) (s − d)2 dΩ + η ¯ R
R
where η ≥ 0 is a damping parameter, by straightforward algebraic manipulation, as ′
sˆlm =
l L X X
l′ =0 m′ =−l′
¯ lm,l′ m′ Dlm,l′ m′ + η D
�−1
Z
d Yl′ m′ dΩ,
(81)
R
¯ = Ω \ R, compliments Dlm,l′ m′ given by eq. (33b) which localizes ¯ lm,l′ m′ , the kernel that localizes to the region R where D to R. Given the eigenvalue spectrum of the latter, its inversion is inherently unstable, thus eq. (80) is an ill-conditioned
16
Simons and Plattner
inverse problem unless η > 0, as has been well known, e.g. in geodesy (Xu 1992; Sneeuw & van Gelderen 1997). Elsewhere (Simons & Dahlen 2006) we have derived exact expressions for the optimal value of the damping parameter η as a function of the signal-to-noise ratio under certain simplifying assumptions. As can be easily shown, without damping the estimate is unbiased but effectively incomputable; the introduction of the damping term stabilizes the solution at the cost of added bias. And of course when R = Ω, eq. (81) is simply the spherical harmonic transform, as in that case, eq. (33b) reduces to eq. (29), in other words, then Dlm,l′ m′ = δll′ δmm′ .
3.1.2
Slepian Basis Solution
The trial solution in the Slepian basis designed for this region of interest R, i.e. (L+1)2
sˆ(ˆ r) =
X
sˆα gα (ˆ r),
(82)
α=1
would be completely equivalent to the expression in eq. (77) by virtue of the completeness of the Slepian basis for bandlimited functions everywhere on the sphere and the unitarity of the transform (31) from the spherical harmonic to the Slepian basis. The solution to the undamped (η = 0) version of eq. (80) would then be Z sˆα = λ−1 d gα dΩ, (83) α R
which, being completely equivalent to eq. (81) for η = 0, would be computable, and biased, only when the expansion in eq. (82) were to be truncated to some finite J < (L + 1)2 to prevent the blowup of the eigenvalues λ. Assuming for simplicity of the argument that J = N 3D , the essence of the approach is now that the solution sˆ(ˆ r) =
3D N X
sˆα gα (ˆ r)
(84)
α=1
will be sparse (in achieving a bandwidth L using N 3D Slepian instead of (L + 1)2 spherical-harmonic expansion coefficients) yet good (in approximating the signal as well as possible in the mean-squared sense in the region of interest R) and of geophysical utility (assuming we are dealing with spatially localized processes that are to be extracted, e.g., from global satellite measurements) as shown by Han & Simons (2008), Simons et al. (2009), and Harig & Simons (2012).
3.2
Bias and Variance
In concluding this section let us illustrate another welcome by-product of our methodology, by writing the mean-squared error for the spherical harmonic solution (81) compared to the equivalent expression for the solution in the Slepian basis, eq. (83). We do this as a function of the spatial coordinate, in the Slepian basis for both, and, for maximum clarity of the exposition, using the contrived case when both signal and noise should be white (with power S and N , respectively) as well as bandlimited (which technically is impossible). In the former case, we get (L+1)2 2
hǫ (ˆ r)i
=
N
X
α=1
λα [λα + η(1 − λα )]−2 gα2 (ˆ r)
(85)
(L+1)2
2
+η S
X
α=1
(1 − λα )2 [λα + η(1 − λα )]−2 gα2 (ˆ r),
while in the latter, we obtain 2
hǫ (ˆ r)i = N
3D N X
α=1
(L+1)2 2 λ−1 r) α gα (ˆ
+S
X
gα2 (ˆ r).
(86)
α>N 3D
All (L + 1)2 basis functions are required to express the mean-squared estimation error, whether in eq. (85) or in eq. (86). The first term in both expressions is the variance, which depends on the measurement noise. Without damping or truncation the variance grows without bounds. Damping and truncation alleviate this at the expense of added bias, which depends on the characteristics of the signal, as given by the second term. In contrast to eq. (85), however, the Slepian expression (86) has disentangled the contributions due to noise/variance and signal/bias by projecting them onto the sparse set of well-localized and the remaining set of poorly localized Slepian functions, respectively. The estimation variance is felt via the basis functions α = 1 → N 3D that are well concentrated inside the measurement area, and the effect of the bias is relegated to those α = N 3D + 1 → (L + 1)2 functions that are confined to the region of missing data. When forming a solution to problem (i) in the Slepian basis by truncation according to eq. (84), changing the truncation level J to values lower or higher than the Shannon number N 3D amounts to navigating the trade-off space between variance,
Scalar and Vector Slepian Functions
17
bias (or “resolution”), and sparsity in a manner that is captured with great clarity by eq. (86). We refer the reader elsewhere (Simons & Dahlen 2006, 2007) for more details, and, in particular, for the case of potential fields estimated from data collected at satellite altitude.
3.3
Problem (ii): Power Spectrum Estimation from Spherical Data
Following Dahlen & Simons (2008) we will find it convenient to regard the data d(ˆ r) given in eq. (75) as having been multiplied by a unit-valued boxcar window function confined to the region R, � p ∞ X X 1 if ˆ r ∈ R, (87) bpq Ypq (ˆ r) = b(ˆ r) = 0 otherwise. p=0 q=−p
The power spectrum of the boxcar window (87) is Bp =
3.3.1
p X 1 b2pq . 2p + 1 q=−p
(88)
The Spherical Periodogram
Should we decide that an acceptable estimate of the power spectral density of the available data is nothing else but the weighted average of its spherical harmonic expansion coefficients, we would be forming the spherical analogue of what Schuster (Schuster 1898) named the “periodogram” in the context of time series analysis, namely �Z �2 � � l X 4π 1 SP ˆ d(ˆ r) Ylm (ˆ r) dΩ . Sl = (89) A 2l + 1 R m=−l
3.3.2
Bias of the Periodogram
Upon doing so we would discover that the expected value of such an estimator would be the biased quantity hSˆlSP i =
∞ X
Kll′ (Sl′ + Nl′ ),
(90)
l′ =0
where, as it is known in astrophysics and cosmology (Peebles 1973; Hauser & Peebles 1973; Hivon et al. 2002), the periodogram “coupling” matrix Kll′ =
�
4π A
�
′
l l X X 1 [Dlm,l′ m′ ]2 , 2l + 1 m=−l ′ ′
(91)
m =−l
governs the extent to which an estimate SˆlSP of Sl is influenced by spectral leakage from power in neighboring spherical harmonic degrees l′ = l ± 1, l ± 2, . . ., all the way down to 0 and up to ∞. In the case of full data coverage, R = Ω, or of a perfectly white spectrum, Sl = S, however, the estimate would be unbiased — provided the noise spectrum, if known, can be subtracted beforehand.
3.3.3
Variance of the Periodogram
The covariance of the periodogram estimator (89) would moreover be suffering from strong wideband coupling of the power spectral densities in being given by #2 "∞ ∞ l l′ X XX X 2(4π/A)2 SP Σll′ = (Sp + Np )Dlm,pq Dpq,l′ m′ . (92) (2l + 1)(2l′ + 1) m=−l ′ ′ p=0 q=0 m =−l
Even under the commonly made assumption as should the power spectrum be slowly varying within the main lobe of the coupling matrix, such coupling would be nefarious. In the “locally white” case we would have ΣSP ll′
l X 2(4π/A)2 ′ + Nl′ ) (S + N )(S = l l l (2l + 1)(2l′ + 1)
′
l X
[Dlm,l′ m′ ]2 .
(93)
m=−l m′ =−l′
Only in the limit of whole-sphere data coverage will eqs (92) or (93) reduce to ΣWS ll′ =
2 (Sl + Nl )2 δll′ , 2l + 1
(94)
18
Simons and Plattner
which is the “planetary” or “cosmic” variance that can be understood on the basis of elementary statistical considerations (Jones 1963; Knox 1995; Grishchuk & Martin 1997). The strong spectral leakage for small regions (A ≪ 4π) is highly undesirable and makes the periodogram ‘hopelessly obsolete’ (Thomson & Chave 1991), or, to put it kindly, ‘naive’ (Percival & Walden 1993), just as it is for one-dimensional time series. In principle it is possible — after subtraction of the noise bias — to eliminate the leakage bias in the periodogram estimate (89) by numerical inversion of the coupling matrix Kll′ . Such a “deconvolved periodogram” estimator is unbiased. However, its covariance depends on the inverse of the periodogram coupling matrix, which is only feasible when the region R covers most of the sphere, A ≈ 4π. For any region whose area A is significantly smaller than 4π, the periodogram coupling matrix (91) will be too ill-conditioned to be invertible. Thus, much like in problem (i) we are faced with bad bias and poor variance, both of which are controlled by the lack of localization of the spherical harmonics and their non-orthogonality over incomplete subdomains of the unit sphere. Both effects are described by the spatiospectral localization kernel defined in (33b), which, in the quadratic estimation problem (ii) appears in “squared” form in eq. (92). Undoing the effects of the wideband coupling between degrees at which we seek to estimate the power spectral density by inversion of the coupling kernel is virtually impossible, and even if we could accomplish this to remove the estimation bias, this would much inflate the estimation variance (Dahlen & Simons 2008). 3.3.4
The Spherical Multitaper Estimate
We therefore take a page out of the one-dimensional power estimation playbook of Thomson (1982) by forming the “eigenvalueweighted multitaper estimate”. We could weight single-taper estimates adaptively to minimize quality measures such as estimation variance or mean-squared error (Thomson 1982; Wieczorek & Simons 2007), but in practice, these methods tend to be rather computationally demanding. Instead we simply multiply the data d(ˆ r) by the Slepian functions or “tapers” gα (ˆ r) designed for the region of interest prior to computing power and then averaging: � �Z �2 � (L+1)2 l X X 4π 1 MT ˆ λα Sl = g (ˆ r ) d(ˆ r ) Y (ˆ r ) dΩ . (95) α lm N 3D 2l + 1 Ω α=1 m=−l
3.3.5
Bias of the Multitaper Estimate
The expected value of the estimate (95) is hSˆlMT i =
l+L X
Mll′ (Sl′ + Nl′ ),
(96)
l′ =l−L
where the eigenvalue-weighted multitaper coupling matrix, using Wigner 3-j functions (Varshalovich et al. 1988; Messiah 2000), is given by � �2 L 2l′ + 1 X l p l′ Mll′ = (2p + 1) . (97) 0 0 0 (L + 1)2 p=0
It is remarkable that this result depends only upon the chosen bandwidth L and is completely independent of the size, shape or connectivity of the region R, even as R = Ω. Moreover, every row of the matrix in eq. (97) sums to unity, which ensures ˆMT that a the multitaper spectral estimate P Sl has no leakage bias in the case of a perfectly white spectrum provided the noise MT ˆ bias is subtracted as well: hSl i − Mll′ Nl′ = S if Sl = S. 3.3.6
Variance of the Multitaper Estimate
Under the moderately colored approximation, which is more easily justified in this case because the coupling (97) is confined to a narrow band of width less than or equal to 2L+1, with L the bandwidth of the tapers, the eigenvalue-weighted multitaper covariance is � �2 2L X 1 l p l′ MT ′ ′ (2p + 1) Γp (Sl + Nl )(Sl + Nl ) , (98) Σll′ = 0 0 0 2π p=0
where, using Wigner 3-j and 6-j functions (Varshalovich et al. 1988; Messiah 2000), Γp
=
1 (N 3D )2 × ×
2L X
L X L X L L X X
(2s + 1)(2s′ + 1)(2u + 1)(2u′ + 1)
s=0 s′ =0 u=0 u′ =0
(−1)p+e (2e + 1)Be
e=0
�
s u
e p
s′ u′
��
s 0
e 0
s′ 0
��
u 0
e 0
u′ 0
��
s 0
p 0
u′ 0
��
u 0
p 0
s′ 0
�
.
(99)
Scalar and Vector Slepian Functions
19
In this expression Be , the boxcar power (88), which we note does depend on the shape of the region of interest, appears again, summed over angular degrees limited by 3-j selection rules to 0 ≤ e ≤ 2L. The sum in eq. (98) is likewise limited to degrees 0 ≤ p ≤ 2L. The effect of tapering with windows bandlimited to L is to introduce covariance between the estimates at any two different degrees l and l′ that are separated by fewer than 2L + 1 degrees. Eqs (98)–(99) are very efficiently computable, which should make them competitive with, e.g., jackknifed estimates of the estimation variance (Chave et al. 1987; Thomson & Chave 1991; Thomson 2007). The crux of the analysis lies in the fact that the matrix of the spectral covariances between single-tapered estimates is almost diagonal (Wieczorek & Simons 2007), showing that the individual estimates that enter the weighted formula (95) are almost uncorrelated statistically. This embodies the very essence of the multitaper method. It dramatically reduces the estimation variance at the cost of small increases of readily quantifiable bias.
4
PRACTICAL CONSIDERATIONS
In this section we now turn to the very practical context of sampled, e.g. geodetic, data on the sphere. We shall deal exclusively with bandlimited scalar functions, which are equally well expressed in the spherical harmonic as the Slepian basis, namely: f (ˆ r) =
L l X X
(L+1)2
flm Ylm (ˆ r) =
X
fα gα (ˆ r),
(100)
α=1
l=0 m=−l
whereby the Slepian-basis expansion coefficients are obtained as Z fα = f (ˆ r)gα (ˆ r) dΩ.
(101)
Ω
If the function of interest is spatially localized in the region R, a truncated reconstruction using Slepian functions built for the same region will constitute a very good, and sparse, local approximation to it (Simons et al. 2009): f (ˆ r) ≈
3D N X
fα gα (ˆ r),
α=1
ˆ r ∈ R.
(102)
We represent any sampled, bandlimited function f by an M -dimensional column vector f = (f1 · · · fj · · · fM )T ,
(103)
where fj = f (ˆ rj ) is the value of f at pixel j, and M is the total number of sampling locations. In the most general case the distribution of pixel centers will be completely arbitrary (Hesse et al. 2010). The special case of equal-area pixelization of a 2-D function f (ˆ r) on the unit sphere Ω is analogous to the equispaced digitization of a 1-D time series. Integrals will then be assumed to be approximated with sufficient accuracy by a Riemann sum over a dense set of pixels, Z Z M X f (ˆ r) dΩ ≈ ∆Ω fj and f 2 (ˆ r) dΩ ≈ ∆Ω f T f. (104) j=1
We have deliberately left the integration domain out of the above equations to cover both the cases of sampling over the entire unit sphere surface Ω, in which case the solid angle ∆Ω = 4π/M (case 1) as well as over an incomplete subdomain R ⊂ Ω, in which case ∆Ω = A/M , with A the area of the region R (case 2). If we collect the real spherical harmonic basis functions Ylm into an (L + 1)2 × M -dimensional matrix Y00 (ˆ r1 ) · · · Y00 (ˆ rj ) · · · Y00 (ˆ rM ) . .. , · · · Y (ˆ r ) · · · Y= (105) j lm . .. YLL (ˆ r1 )
···
YLL (ˆ rj )
···
YLL (ˆ rM )
and the spherical harmonic coefficients of the function into an (L + 1)2 × 1-dimensional vector f = ( f00 · · · flm · · · fLL )T ,
(106)
we can write the spherical harmonic synthesis in eq. (100) for sampled data without loss of generality as f = YT f .
(107)
We will adhere to the notation convention of using sans-serif fonts (e.g. f, Y) for vectors or matrices that depend on at least one spatial variable, and serifed fonts (e.g. f , D ) for those that are entirely composed of “spectral” quantities. In the case of dense, equal-area, whole-sphere sampling we have an approximation to eq. (29): YYT ≈ ∆Ω−1 I
(case 1),
(108)
20
Simons and Plattner
where the elements of the (L + 1)2 × (L + 1)2 -dimensional spectral identity matrix I are given by the Kronecker deltas δll′ δmm′ . In the case of dense, equal-area, sampling over some closed region R, we find instead an approximation to the (L + 1)2 × (L + 1)2 -dimensional “spatiospectral localization matrix”: YYT ≈ ∆Ω−1 D
(case 2),
(109)
where the elements of D are those defined in eq. (33b). Let us now introduce the (L + 1)2 × (L + 1)2 -dimensional matrix of spectral Slepian eigenfunctions by g00 1 · · · g00 α · · · g00 (L+1)2 .. . . · · · g · · · G= lm α . .. gLL 1
···
gLL α
···
(110)
gLL (L+1)2
This is the matrix that contains the eigenfunctions of the problem defined in eq. (33), which we rewrite as D G = G Λ,
(111)
where the diagonal matrix with the concentration eigenvalues is given by Λ = diag λ1 · · · λα · · · λ(L+1)2 The spectral orthogonality relations of eq. (35) are GT G = I, 2
�
.
GT D G = Λ,
(112)
(113)
2
where the elements of the (L + 1) × (L + 1) -dimensional Slepian identity matrix I are given by the Kronecker deltas δαβ . We write the Slepian functions of eq. (31) as G = GT Y
and
Y = G G,
(114)
2
where the (L + 1) × M -dimensional matrix holding the sampled spatial Slepian functions is given by g1 (ˆ r1 ) ··· g1 (ˆ rj ) ··· g1 (ˆ rM ) .. . . · · · g (ˆ r ) · · · G= α j . .. rM ) rj ) · · · g(L+1)2 (ˆ r1 ) · · · g(L+1)2 (ˆ g(L+1)2 (ˆ
(115)
Under a dense, equal-area, whole-sphere sampling, we will recover the the spatial orthogonality of eq. (36) approximately as GGT ≈ ∆Ω−1 I
(case 1),
(116)
whereas for dense, equal-area, sampling over a region R we will get, instead, G GT ≈ ∆Ω−1 Λ
(case 2).
(117)
With this matrix notation we shall revisit both estimation problems of the previous section. 4.1 4.1.1
Problem (i), Revisited Spherical Harmonic Solution
If we treat eq. (107) as a noiseless inverse problem in which the sampled data f are given but from which the coefficients f are to be determined, we find that for dense, equal-area, whole-sphere sampling, the solution ˆ f ≈ ∆Ω Y f
(case 1)
(118)
is simply the discrete approximation to the spherical harmonic analysis formula (25). For dense, equal-area, regional sampling we need to calculate ˆ f ≈ ∆Ω D−1 Yf
(case 2).
(119)
Both of these cases are simply the relevant solutions to the familiar overdetermined spherical harmonic inversion problem (Kaula 1967; Menke 1989; Aster et al. 2005) for discretely sampled data, i.e. the least-squares solution to eq. (107), ˆ f = (YYT )−1 Y f,
(120)
for the particular cases described by eqs (108)–(109). In eq. (119) we furthermore recognize the discrete version of eq. (81) with η = 0, the undamped solution to the minimum mean-squared error inverse problem posed in continuous form in eq. (80).
Scalar and Vector Slepian Functions
21
From the continuous limiting case eq. (81) we thus discover the general form that damping should take in regularizing the ill-conditioned inverse required in eqs (119)–(120). Its principal property is that it differs from the customary ad hoc practice of adding small values on the diagonal only. Finally, in the most general and admittedly most commonly encountered case of randomly scattered data we require the Moore-Penrose pseudo-inverse ˆ f = pinv(YT ) f,
(121)
which is constructed by inverting the singular value decomposition (svd) of YT with its singular values truncated beyond where they fall below a certain threshold (Xu 1998). Solving eq. (121) by truncated svd is equivalent to inverting a truncated eigenvalue expansion of the normal matrix YYT as it appears in eq. (120), as can be easily shown. 4.1.2
Slepian Basis Solution
If we collect the Slepian expansion coefficients of the function f into the (L + 1)2 × 1-dimensional vector t = ( f1 · · · fα · · · f(L+1)2 )T ,
(122)
the expansion (100) in the Slepian basis takes the form f = GT t = YT G t,
(123)
where we used eqs (113)–(114) to obtain the second equality. Comparing eq. (123) with eq. (107), we see that the Slepian expansion coefficients of a function transform to and from the spherical harmonic coefficients as: f = Gt
and
t = GT f .
(124)
Under dense, equal-area, sampling with complete coverage the coefficients in eq. (123) can be estimated from ˆ t ≈ ∆Ω G f
(case 1),
(125)
the discrete, approximate, version of eq. (101). For dense, equal-area, sampling in a limited region R we get ˆ t ≈ ∆Ω Λ−1 G f
(case 2).
(126)
As expected, both of the solutions (125)–(126) are again special cases of the overdetermined least-squares solution ˆ t = (GGT )−1 G f,
(127)
as applied to eqs (116)–(117). We encountered eq. (126) before in the continuous form of eq. (83); it solves the undamped minimum mean-squared error problem (80). The regularization of this ill-conditioned inverse problem may be achieved by truncation of the concentration eigenvalues, e.g. by restricting the size of the (L + 1)2 × (L + 1)2 -dimensional operator GGT to its first J × J subblock. Finally, in the most general, scattered-data case, we would be using an eigenvalue-truncated version of eq. (127), or, which is equivalent, form the pseudo-inverse ˆ t = pinv(GT ) f.
(128)
The solutions (118)–(120) and (125)–(127) are equivalent and differ only by the orthonormal change of basis from the spherical harmonics to the Slepian functions. Indeed, using eqs (114) and (124) to transform eq. (127) into an equation for the spherical harmonic coefficients, and comparing with eq. (120) exposes the relation G(GGT )−1 GT = (YYT )−1 ,
(129)
which is a trivial identity for case 1 (insert eqs 108, 116 and 113) and, after substituting eqs (109) and (117), entails GΛ−1 GT = D−1
(130)
for case 2, which holds by virtue of eq. (113). Eq. (129) can also be verified directly from eq. (114), which implies YYT = G(GGT ) GT .
(131)
The popular but labor-intensive procedure by which the unknown spherical harmonic expansion coefficients of a scattered data set are obtained by forming the Moore-Penrose pseudo-inverse as in eq. (121) is thus equivalent to determining the truncated Slepian solution of eq. (126) in the limit of continuous and equal-area, but incomplete data coverage. In that limit, the generic eigenvalue decomposition of the normal matrix becomes a specific statement of the Slepian problem as we encountered it before, namely YYT∆Ω = UΣ2 UT
→
D = GΛGT .
(132)
Such a connection has been previously pointed out for time series (Wingham 1992) and leads to the notion of “generalized prolate spheroidal functions” (Bronez 1988) should the “Slepian” functions be computed from a formulation of the concentration problem in the scattered data space directly, rather than being determined by sampling those obtained from solving the corresponding continuous problem, as we have described here. Above, we showed how to stabilize the inverse problem of eq. (120) by damping. We dealt with the case of continuously
22
Simons and Plattner
available data only; the form in which it appears in eq. (81) makes it clear that damping is hardly practical for scattered ¯ in addition to being sensitive to the choice data. Indeed, it requires knowledge of the complementary localization operator D, of η, whose optimal value depends implicitly on the unknown signal-to-noise ratio (Simons & Dahlen 2006). The data-driven approach taken in eq. (121) is the more sensible one (Xu 1998). We have now seen that, in the limit of continuous partial coverage, this corresponds to the optimal solution of the problem formulated directly in the Slepian basis. It is consequently advantageous to also work in the Slepian basis in case the data collected are scattered but closely collocated in some region of interest. Prior knowledge of the geometry of this region and a prior idea of the spherical harmonic bandwidth of the data to be inverted allows us to construct a Slepian basis for the situation at hand, and the problem of finding the Slepian expansion coefficients of the unknown underlying function can be solved using eqs (127)–(128). The measure within which this approach agrees with the theoretical form of eq. (126) will depend on how regularly the data are distributed within the region of study, i.e on the error in the approximation (117). But if indeed the scattered-data Slepian normal matrix GGT is nearly diagonal in its first J × J-dimensional block due to the collocated observations having been favorably, if irregularly, distributed, then eq. (126), which, strictly speaking, requires no matrix inversion, can be applied directly. If this is not the case, but the data are still collocated or we are only interested in a local approximation to the unknown signal, we can restrict G to its first J rows, prior to diagonalizing GGT or performing the svd of a partial GT as necessary to calculate eqs (127)–(128). Compared to solving eqs (120)–(121), the computational savings will still be substantial, as only when R ≈ Ω will the operator YYT be nearly diagonal. Truncation of the eigenvalues of YYT is akin to truncating the matrix GGT itself, which is diagonal or will be nearly so. With the theoretically, continuously determined, sampled Slepian functions as a parametrization, the truncated expansion is easy to obtain and the solution will be locally faithful within the region of interest R. In contrast, should we truncate YYT itself, without first diagonalizing it, we would be estimating a low-degree approximation of the signal which would have poor resolution everywhere. See Slobbe et al. (2012) for a set of examples in a slightly expanded and numerically more challenging context.
4.1.3
Bias and Variance
For completeness we briefly return to the expressions for the mean-squared estimation error of the damped spherical-harmonic and the truncated Slepian function methods, eqs. (85)–(86), which we quoted for the example of “white” signal and noise with power S and N , respectively. Introducing the (L + 1)2 × (L + 1)2 -dimensional spectral matrices H = Λ + η (I − Λ), V = N H−2 Λ,
and
B=
√
S H−1 (I − Λ),
we handily rewrite the “full” version of eq. (85) in two spatial variables as the error covariance matrix � hǫ(ˆ r)ǫ(ˆ r′ )i = GT V + η 2 B2 G.
(133a) (133b)
(134)
We subdivide the matrix with Slepian functions into the truncated set of the best-concentrated α = 1 → J and the complementary set of remaining α = J + 1 → (L + 1)2 functions, as follows � ¯ T T, G = GT G (135) ¯ and similarly separate the eigenvalues, writing ¯ Λ
= diag ( λ1 · · · λJ ) , � Λ = diag λJ +1 · · · λ(L+1)2 . ¯ Likewise, the identity matrix is split into two parts, ¯I and I. If we now also redefine ¯ √ ¯ = NΛ ¯ −1 , and B ¯ = S ¯I, V √ V = N Λ−1 , and B = S I, ¯ ¯ ¯ ¯ the equivalent version of eq. (86) is readily transformed into the full spatial error covariance matrix
(136a) (136b)
(137a) (137b)
¯ 2 G. ¯ ¯ TB hǫ(ˆ r)ǫ(ˆ r′ )i = GT V G + G (138) ¯ ¯ ¯ In selecting the Slepian basis we have thus successfully separated the effect of the variance and the bias on the mean-squared reconstruction error of a noisily observed signal. If the region of observation is a contiguous closed domain R ⊂ Ω and the truncation should take place at the Shannon number J = N 3D , we have thereby identified the variance as due to noise in the region where data are available, and the bias to signal neglected in the truncated expansion — which, in the proper Slepian basis, corresponds to the regions over which no observations exist. In practice, the truncation will happen at some J that depends on the signal-to-noise ratio (Simons & Dahlen 2006) and/or on computational considerations (Slobbe et al. 2012). Finally, we shall also apply the notions of discretely acquired data to the solutions of problem (ii), below.
Scalar and Vector Slepian Functions 4.2
23
Problem (ii), Revisited
We need two more pieces of notation in order to rewrite the expressions for the spectral estimates (89) and (95) in the “pixelbasis”. First we construct the M × M -dimensional symmetric spatial matrix collecting the fixed-degree Legendre polynomials evaluated at the angular distances between all pairs of observations points, Pl (ˆ r1 · ˆ r1 ) · · · Pl (ˆ r1 · ˆ rj ) · · · Pl (ˆ r1 · ˆ rM ) . .. � � 2l + 1 . (139) · · · P (ˆ r · ˆ r ) · · · Pl = i j l 4π . .. Pl (ˆ rM · ˆ r1 ) · · · Pl (ˆ rM · ˆ rj ) · · · Pl (ˆ rM · ˆ rM ) P The elements of Pl are thus lm=−l Ylm (ˆ ri )Ylm (ˆ rj ), by the addition theorem, eq. (30). And finally, we define Gα l , the M × M symmetric matrix with elements given by � � 2l + 1 (Gα ) = gα (ˆ ri )Pl (ˆ ri · ˆ rj )gα (ˆ rj ). (140) l ij 4π 4.2.1
The Spherical Periodogram
The expression equivalent to eq. (89) is now written as SˆlSP =
�
4π A
�
(∆Ω)2 T d Pl d, 2l + 1
(141)
whereby the column vector d contains the sampled data as in the notation for eq. (103). This lends itself easily to computation, and the statistics of eqs (90)–(93) hold, approximately, for sufficiently densely sampled data. 4.2.2
The Spherical Multitaper Estimate
Finally, the expression equivalent to eq. (95) becomes (L+1)2
SˆlMT =
X
α=1
λα
�
4π N 3D
�
(∆Ω)2 T α d Gl d. 2l + 1
(142)
Both eqs (141) and (142) are quadratic forms, earning them the nickname “quadratic spectral estimators” (Mullis & Scharf 1991). The key difference with the maximum-likelihood estimator popular in cosmology (Bond et al. 1998; Oh et al. 1999; Hinshaw et al. 2003), which can also be written as a quadratic form (Tegmark 1997), is that neither Pl nor Gα l depend on the unknown spectrum itself, and can be easily precomputed. In contrast, maximum-likelihood estimation is inherently nonlinear, requiring iteration to converge to the most probable estimate of the power spectral density (Dahlen & Simons 2008). As such, given a pixel grid, a region of interest R and a bandwidth L, eq. (142) produces a consistent localized multitaper power-spectral estimate in one step. The estimate (142) has the statistical properties that we listed earlier as eqs (96)–(99). These continue to hold when the data pixelization is fine enough to have integral expressions of the kind (104) be exact. As mentioned before, for completely irregularly and potentially non-densely distributed discrete data on the sphere, “generalized” Slepian functions (Bronez 1988) could be constructed specifically for the purpose of their power spectral estimation, and used to build the operator (140).
5
CONCLUSIONS
What is the information contained in a bandlimited set of scientific observations made over an incomplete, e.g. temporally or spatially limited sampling domain? How can this “information”, e.g. an estimate of the signal itself, or of its energy density, be determined from noisy data, and how shall it be represented? These seemingly age-old fundamental questions, which have implications beyond the scientific (Slepian 1976), had been solved — some say, by conveniently ignoring them — heuristically, by engineers, well before receiving their first satisfactory answers given in the theoretical treatment by Slepian, Landau and Pollak (Slepian & Pollak 1961; Landau & Pollak 1961, 1962); first for “continuous” time series, later generalized to the multidimensional and discrete cases (Slepian 1964, 1978; Bronez 1988). By the “Slepian functions” in the title of this contribution, we have lumped together all functions that are “spatiospectrally” concentrated, quadratically, in the original sense of Slepian. In one dimension, these are the “prolate spheroidal functions” whose popularity is as enduring as their utility. In two Cartesian dimensions, and on the surface of the unit sphere, both scalar and vectorial, their time for applications in geomathematics has come. The answers to the questions posed above are as ever relevant for the geosciences of today. There, we often face the additional complications of irregularly shaped study domains, scattered observations of noise-contaminated potential fields,
24
Simons and Plattner
perhaps collected from an altitude above the source by airplanes or satellites, and an acquisition and model-space geometry that is rarely if ever non-symmetric. Thus the Slepian functions are especially suited for geoscientific applications and to study any type of geographical information, in general. Two problems that are of particular interest in the geosciences, but also further afield, are how to form a statistically “optimal” estimate of the signal giving rise to the data, and how to estimate the power spectral density of such signal. The first, an inverse problem that is linear in the data, applies to forming mass flux estimates from time-variable gravity, e.g. by the grace mission (Harig & Simons 2012), or to the characterization of the terrestrial or planetary magnetic fields by satellites such as champ, swarm or mgs. The second, which is quadratic in the data, is of interest in studying the statistics of the Earth’s or planetary topography and magnetic fields (Lewis & Simons 2012; Beggan et al. 2013), and especially for the cross-spectral analysis of gravity and topography (Wieczorek 2008), which can yield important clues about the internal structure of the planets. The second problem is also of great interest in cosmology, where missions such as wmap and planck are mapping the cosmic microwave background radiation, which is best modeled spectrally to constrain models of the evolution of our universe. Slepian functions, as we have shown by focusing on the scalar case in spherical geometry, provide the mathematical framework to solve such problems. They are a convenient and easily obtained doubly-orthogonal mathematical basis in which to express, and thus by which to recover, signals that are geographically localized, or incompletely (and noisily) observed. For this they are much better suited than the traditional Fourier or spherical harmonic bases, and they are more “geologically intuitive” than wavelet bases in retaining a firm geographic footprint and preserving the traditional notions of frequency or spherical harmonic degree. They are furthermore extremely performant as data tapers to regularize the inverse problem of power spectral density determination from noisy and patchy observations, which can then be solved satisfactorily without costly iteration. Finally, by the interpretation of the Slepian functions as their limiting cases, much can be learned about the statistical nature of such inverse problems when the data provided are themselves scattered within a specific areal region of study.
ACKN OWL ED GMEN TS We are indebted to Tony Dahlen (1942–2007), Mark Wieczorek and Volker Michel for many enlightening discussions over the years. Dong V. Wang aided with the calculations of the Cartesian case, and Liying Wei contributed to the development of the vectorial case. Yoel Shkolnisky pointed us to the symmetric relations (22)–(23), and Korn´el Jahn shared a preprint of his most recent paper. Financial support for this work was provided by the U. S. National Science Foundation under Grants EAR-0105387, EAR-0710860, EAR-1014606, and EAR-1150145, by the Universit´e Paris Diderot–Paris 7 and the Institut de Physique du Globe de Paris in St. Maur-des-Foss´es, the Ulrich Schmucker Memorial Trust and the Swiss National Science Foundation. Computer algorithms are made available on www.frederik.net.
REFE RE NC ES Albertella, A., Sans` o, F. & Sneeuw, N., 1999. Band-limited functions on a bounded spherical domain: the Slepian problem on the sphere, J. Geodesy, 73, 436–447. Amirbekyan, A., Michel, V. & Simons, F. J., 2008. Parameterizing surface-wave tomopgraphic models with harmonic spherical splines, Geophys. J. Int., 174(2), 617–628, doi: 10.1111/j.1365–246X.2008.03809.x. Aster, R. C., Borchers, B. & Thurber, C. H., 2005. Parameter Estimation and Inverse Problems, vol. 90 of International Geophysics Series, Elsevier Academic Press, San Diego, Calif. Beggan, C. D., Saarim¨ aki, J., Whaler, K. A. & Simons, F. J., 2013. Spectral and spatial decomposition of lithospheric magnetic field models using spherical Slepian functions, Geophys. J. Int., 193(1), 136–148, 10.1093/gji/ggs122. Bendat, J. S. & Piersol, A. G., 2000. Random data: Analysis and Measurement Procedures, John Wiley, New York, 3rd edn. Blanco, M. A., Fl´ orez, M. & Bermejo, M., 1997. Evaluation of the rotation matrices in the basis of real spherical harmonics, J. Mol. Struct. (Theochem), 419, 19–27. Bond, J. R., Jaffe, A. H. & Knox, L., 1998. Estimating the power spectrum of the cosmic microwave background, Phys. Rev. D, 57(4), 2117–2137. Bronez, T. P., 1988. Spectral estimation of irregularly sampled multidimensional processes by generalized prolate spheroidal sequences, IEEE Trans. Acoust. Speech Signal Process., 36(12), 1862–1873. Chave, A. D., Thomson, D. J. & Ander, M. E., 1987. On the robust estimation of power spectra, coherences, and transfer functions, J. Geophys. Res., 92(B1), 633–648. Cohen, L., 1989. Time-frequency distributions — A review, Proc. IEEE , 77(7), 941–981. Cox, D. R. & Hinkley, D. V., 1974. Theoretical Statistics, Chapman and Hall, London, UK. Dahlen, F. A. & Simons, F. J., 2008. Spectral estimation on a sphere in geophysics and cosmology, Geophys. J. Int., 174, 774–807, doi: 10.1111/j.1365–246X.2008.03854.x. Dahlen, F. A. & Tromp, J., 1998. Theoretical Global Seismology, Princeton Univ. Press, Princeton, N. J. Daubechies, I., 1988. Time-frequency localization operators: A geometric phase space approach, IEEE Trans. Inform. Theory, 34, 605–612. Daubechies, I., 1990. The wavelet transform, time-frequency localization and signal analysis, IEEE Trans. Inform. Theory, 36(5), 961–1005.
Scalar and Vector Slepian Functions
25
Daubechies, I., 1992. Ten Lectures on Wavelets, vol. 61 of CBMS-NSF Regional Conference Series in Applied Mathematics, Society for Industrial & Applied Mathematics, Philadelphia, Penn. Daubechies, I. & Paul, T., 1988. Time-frequency localisation operators — A geometric phase space approach: II. The use of dilations, Inv. Probl., 4(3), 661–680. de Villiers, G. D., Marchaud, F. B. T. & Pike, E. R., 2003. Generalized Gaussian quadrature applied to an inverse problem in antenna theory: II. The two-dimensional case with circular symmetry, Inverse Problems, 19, 755–778. Donoho, D. L. & Stark, P. B., 1989. Uncertainty principles and signal recovery, SIAM J. Appl. Math., 49(3), 906–931. Edmonds, A. R., 1996. Angular Momentum in Quantum Mechanics, Princeton Univ. Press, Princeton, N.J. Eshagh, M., 2009. Spatially restricted integrals in gradiometric boundary value problems, Artif. Sat., 44(4), 131–148, doi: 10.2478/v10018–009–0025–4. Flandrin, P., 1998. Temps-Fr´ equence, Herm` es, Paris, 2nd edn. Freeden, W., 2010, Geomathematics: Its role, its aim, and its potential, in Handbook of Geomathematics, edited by W. Freeden, M. Z. Nashed, & T. Sonar, chap. 1, pp. 3–42, doi: 10.1007/978–3–642–01546–5 1, Springer, Heidelberg, Germany. Freeden, W. & Schreiner, M., 2009. Spherical Functions of Mathematical Geosciences: A Scalar, Vectorial, and Tensorial Setup, Springer, Berlin. Freeden, W. & Schreiner, M., 2010, Special functions in mathematical geosciences: An attempt at a categorization, in Handbook of Geomathematics, edited by W. Freeden, M. Z. Nashed, & T. Sonar, chap. 31, pp. 925–948, doi: 10.1007/978–3–642–01546–5 31, Springer, Heidelberg, Germany. Freeden, W. & Windheuser, U., 1997. Combined spherical harmonic and wavelet expansion — A future concept in Earth’s gravitational determination, Appl. Comput. Harmon. Anal., 4, 1–37. Freeden, W., Gervens, T. & Schreiner, M., 1998. Constructive Approximation on the Sphere, Clarendon Press, Oxford, UK. Gerhards, C., 2011. Spherical decompositions in a global and local framework: theory and an application to geomagnetic modeling, Intern. J. Geomath., 1(2), 205–256, doi: 10.1007/s13137–010–0011–9. Gilbert, E. N. & Slepian, D., 1977. Doubly orthogonal concentrated polynomials, SIAM J. Math. Anal., 8(2), 290–319. Grafarend, E. W., Klapp, M. & Martinec, Z., 2010, Spacetime modeling of the Earth’s gravity field by ellipsoidal harmonics, in Handbook of Geomathematics, edited by W. Freeden, M. Z. Nashed, & T. Sonar, chap. 7, pp. 159–252, doi: 10.1007/978–3–642–01546–5 7, Springer, Heidelberg, Germany. Grishchuk, L. P. & Martin, J., 1997. Best unbiased estimates for the microwave background anisotropies, Phys. Rev. D, 56(4), 1924– 1938. Gr¨ unbaum, F. A., 1981. Eigenvectors of a Toeplitz matrix: discrete version of the prolate spheroidal wave functions, SIAM J. Alg. Disc. Meth., 2(2), 136–141. Han, S.-C. & Simons, F. J., 2008. Spatiospectral localization of global geopotential fields from the Gravity Recovery and Climate Experiment (GRACE) reveals the coseismic gravity change owing to the 2004 Sumatra-Andaman earthquake, J. Geophys. Res., 113, B01405, doi: 10.1029/2007JB004927. Hanssen, A., 1997. Multidimensional multitaper spectral estimation, Signal Process., 58, 327–332. Harig, C. & Simons, F. J., 2012. Mapping Greenland’s mass loss in space and time, Proc. Natl. Acad. Sc., 109(49), 19934–19937, doi: 10.1073/pnas.1206785109. Hauser, M. G. & Peebles, P. J. E., 1973. Statistical analysis of catalogs of extragalactic objects. II. The Abell catalog of rich clusters, Astroph. J., 185, 757–785. Hesse, K., Sloan, I. H. & Womersley, R. S., 2010, Numerical integration on the sphere, in Handbook of Geomathematics, edited by W. Freeden, M. Z. Nashed, & T. Sonar, chap. 40, pp. 1187–1219, doi: 10.1007/978–3–642–01546–5 40, Springer, Heidelberg, Germany. Hinshaw, G., Spergel, D. N., Verde, L., Hill, R. S., Meyer, S. S., Barnes, C., Bennett, C. L., Halpern, M., Jarosik, N., Kogut, A., Komatsu, E., Limon, M., Page, L., Tucker, G. S., Weiland, J. L., Wollack, E. & Wright, E. L., 2003. First-year wilkinson microwave anisotropy probe (wmap) observations: The angular power spectrum, Astroph. J. Supp. Ser., 148, 135–159. Hivon, E., G´ orski, K. M., Netterfield, C. B., Crill, B. P., Prunet, S. & Hansen, F., 2002. MASTER of the cosmic microwave background anisotropy power spectrum: A fast method for statistical analysis of large and complex cosmic microwave background data sets, Astroph. J., 567, 2–17. Ilk, K. H., 1983. Ein Beitrag zur Dynamik ausgedehnter K¨ orper: Gravitationswechselwirkung, Deutsche Geod¨ atische Kommission, C(288). Jahn, K. & Bokor, N., 2012. Vector slepian basis functions with optimal energy concentration in high numerical aperture focusing, Optics Comm., 285, 2028–2038, doi: 10.1016/j.optcom.2011.11.107. Jahn, K. & Bokor, N., 2013. Solving the inverse problem of high numerical aperture focusing using vector slepian harmonics and vector Slepian multipole fields, Optics Comm., 288, 13–16, doi: 10.1016/j.optcom.2012.09.051. Jahn, K. & Bokor, N., 2013. Revisiting the concentration problem of vector fields within a spherical cap: a commuting differential operator solution, Appl. Comput. Harmon. Anal., pp. submitted, preprint available as http://arxiv.org/abs/1302.5261. Jones, R. H., 1963. Stochastic processes on a sphere, Ann. Math. Stat., 34(1), 213–218. Kaula, W. M., 1967. Theory of statistical analysis of data distributed over a sphere, Rev. Geophys., 5(1), 83–107. Kennedy, R. A. & Sadeghi, P., 2013. Hilbert Space Methods in Signal Processing, Cambridge Univ. Press, Cambridge, UK. Knox, L., 1995. Determination of inflationary observables by cosmic microwave background anisotropy experiments, Phys. Rev. D, 52(8), 4307–4318. Landau, H. J., 1965. On the eigenvalue behavior of certain convolution equations, Trans. Am. Math. Soc., 115, 242–256. Landau, H. J. & Pollak, H. O., 1961. Prolate spheroidal wave functions, Fourier analysis and uncertainty — II, Bell Syst. Tech. J., 40(1), 65–84. Landau, H. J. & Pollak, H. O., 1962. Prolate spheroidal wave functions, Fourier analysis and uncertainty — III: The dimension of the space of essentially time- and band-limited signals, Bell Syst. Tech. J., 41(4), 1295–1336. Lewis, K. W. & Simons, F. J., 2012. Local spectral variability and the origin of the Martian crustal magnetic field, Geophys. Res. Lett., 39, L18201, doi: 10.1029/2012GL052708. Mallat, S., 1998. A Wavelet Tour of Signal Processing, Academic Press, San Diego, Calif.
26
Simons and Plattner
Maniar, H. & Mitra, P. P., 2005. The concentration problem for vector fields, Int. J. Bioelectromagn., 7(1), 142–145. Martinec, Z., 2010, The forward and adjoint methods of global electromagnetic induction for CHAMP magnetic data, in Handbook of Geomathematics, edited by W. Freeden, M. Z. Nashed, & T. Sonar, chap. 19, pp. 565–624, doi: 10.1007/978–3–642–01546–5 19, Springer, Heidelberg, Germany. Menke, W., 1989. Geophysical Data Analysis: Discrete Inverse Theory, vol. 45 of International Geophysics Series, Academic Press, San Diego, Calif., Rev. edn. Messiah, A., 2000. Quantum Mechanics, Dover, New York. Michel, V., 2010, Tomography: Problems and multiscale solutions, in Handbook of Geomathematics, edited by W. Freeden, M. Z. Nashed, & T. Sonar, chap. 32, pp. 949–972, doi: 10.1007/978–3–642–01546–5 32, Springer, Heidelberg, Germany. Mitra, P. P. & Maniar, H., 2006. Concentration maximization and local basis expansions (LBEX) for linear inverse problems, IEEE Trans. Biomed Eng., 53(9), 1775–1782. Mullis, C. T. & Scharf, L. L., 1991, Quadratic estimators of the power spectrum, in Advances in Spectrum Analysis and Array Processing, edited by S. Haykin, vol. 1, chap. 1, pp. 1–57, Prentice-Hall, Englewood Cliffs, N. J. Nashed, M. Z. & Walter, G. G., 1991. General sampling theorems for functions in Reproducing Kernel Hilbert Spaces, Math. Control Signals Syst., 4, 363–390. Oh, S. P., Spergel, D. N. & Hinshaw, G., 1999. An efficient technique to determine the power spectrum from cosmic microwave background sky maps, Astroph. J., 510, 551–563. Olsen, N., Hulot, G. & Sabaka, T. J., 2010, Sources of the geomagnetic field and the modern data that enable their investigation, in Handbook of Geomathematics, edited by W. Freeden, M. Z. Nashed, & T. Sonar, chap. 5, pp. 105–124, doi: 10.1007/978–3–642–01546– 5 5, Springer, Heidelberg, Germany. Paul, M. K., 1978. Recurrence relations for integrals of associated Legendre functions, Bull. G´ eod., 52, 177–190. Peebles, P. J. E., 1973. Statistical analysis of catalogs of extragalactic objects. I. Theory, Astroph. J., 185, 413–440. Percival, D. B. & Walden, A. T., 1993. Spectral analysis for physical applications, multitaper and conventional univariate techniques, Cambridge Univ. Press, New York. Plattner, A. & Simons, F. J., 2013. Spatiospectral concentration of vector fields on a sphere, Appl. Comput. Harmon. Anal., p. doi:10.1016/j.acha.2012.12.001. Plattner, A., Simons, F. J. & Wei, L., 2012, Analysis of real vector fields on the sphere using Slepian functions, in 2012 IEEE Statistical Signal Processing Workshop (SSP’12), IEEE. Riedel, K. S. & Sidorenko, A., 1995. Minimum bias multiple taper spectral estimation, IEEE Trans. Signal Process., 43(1), 188–195. Sabaka, T. J., Hulot, G. & Olsen, N., 2010, Mathematical properties relevant to geomagnetic field modeling, in Handbook of Geomathematics, edited by W. Freeden, M. Z. Nashed, & T. Sonar, chap. 17, pp. 503–538, doi: 10.1007/978–3–642–01546–5 17, Springer, Heidelberg, Germany. Schuster, A., 1898. An investigation of hidden periodicities with application to a supposed 26-day period of meteorological phenomena, Terr. Magn., 3, 13–41. Sheppard, C. J. R. & T¨ or¨ ok, P., 1997. Efficient calculation of electromagnetic diffraction in optical systems using a multipole expansion, J. Mod. Optics, 44(4), 803–818, doi: 10.1080/09500349708230696. Shkolnisky, Y., 2007. Prolate spheroidal wave functions on a disc — Integration and approximation of two-dimensional bandlimited functions, Appl. Comput. Harmon. Anal., 22, 235–256, doi: 10.1016/j.acha.2006.07.002. Simons, F. J., 2010, Slepian functions and their use in signal estimation and spectral analysis, in Handbook of Geomathematics, edited by W. Freeden, M. Z. Nashed, & T. Sonar, chap. 30, pp. 891–923, doi: 10.1007/978–3–642–01546–5 30, Springer, Heidelberg, Germany. Simons, F. J. & Dahlen, F. A., 2006. Spherical Slepian functions and the polar gap in geodesy, Geophys. J. Int., 166, 1039–1061, doi: 10.1111/j.1365–246X.2006.03065.x. Simons, F. J. & Dahlen, F. A., 2007, A spatiospectral localization approach to estimating potential fields on the surface of a sphere from noisy, incomplete data taken at satellite altitudes, in Wavelets XII , edited by D. Van de Ville, V. K. Goyal, & M. Papadakis, vol. 6701, pp. 670117, doi: 10.1117/12.732406, SPIE. Simons, F. J. & Wang, D. V., 2011. Spatiospectral concentration in the Cartesian plane, Intern. J. Geomath., 2(1), 1–36, doi: 10.1007/s13137–011–0016–z. Simons, F. J., Zuber, M. T. & Korenaga, J., 2000. Isostatic response of the Australian lithosphere: Estimation of effective elastic thickness and anisotropy using multitaper spectral analysis, J. Geophys. Res., 105(B8), 19163–19184, doi: 10.1029/2000JB900157. Simons, F. J., Dahlen, F. A. & Wieczorek, M. A., 2006. Spatiospectral concentration on a sphere, SIAM Rev., 48(3), 504–536, doi: 10.1137/S0036144504445765. Simons, F. J., Hawthorne, J. C. & Beggan, C. D., 2009, Efficient analysis and representation of geophysical processes using localized spherical basis functions, in Wavelets XIII , edited by V. K. Goyal, M. Papadakis, & D. Van de Ville, vol. 7446, pp. 74460G, doi: 10.1117/12.825730, SPIE. Slepian, D., 1964. Prolate spheroidal wave functions, Fourier analysis and uncertainty — IV: Extensions to many dimensions; generalized prolate spheroidal functions, Bell Syst. Tech. J., 43(6), 3009–3057. Slepian, D., 1976. On bandwidth, Proc. IEEE , 64(3), 292–300. Slepian, D., 1978. Prolate spheroidal wave functions, Fourier analysis and uncertainty — V: The discrete case, Bell Syst. Tech. J., 57, 1371–1429. Slepian, D., 1983. Some comments on Fourier analysis, uncertainty and modeling, SIAM Rev., 25(3), 379–393. Slepian, D. & Pollak, H. O., 1961. Prolate spheroidal wave functions, Fourier analysis and uncertainty — I, Bell Syst. Tech. J., 40(1), 43–63. Slepian, D. & Sonnenblick, E., 1965. Eigenvalues associated with prolate spheroidal wave functions of zero order, Bell Syst. Tech. J., 44(8), 1745–1759. Slobbe, D. C., Simons, F. J. & Klees, R., 2012. The spherical Slepian basis as a means to obtain spectral consistency between mean sea level and the geoid, J. Geodesy, 86(8), 609–628, doi: 10.1007/s00190–012–0543–x. Sneeuw, N. & van Gelderen, M., 1997, The polar gap, in Geodetic boundary value problems in view of the one centimeter geoid, edited by F. Sans` o & R. Rummel, vol. 65 of Lecture Notes in Earth Sciences, pp. 559–568, Springer, Berlin.
Scalar and Vector Slepian Functions
27
Tegmark, M., 1997. How to measure CMB power spectra without losing information, Phys. Rev. D, 55(10), 5895–5907. Tegmark, M., Taylor, A. N. & Heavens, A. F., 1997. Karhunen-Lo` eve eigenvalue problems in cosmology: How should we tackle large data sets?, Astroph. J., 480(1), 22–35. Thomson, D. J., 1982. Spectrum estimation and harmonic analysis, Proc. IEEE , 70(9), 1055–1096. Thomson, D. J., 2007. Jackknifing multitaper spectrum estimates, IEEE Signal Process. Mag., 20, 20–30, doi: 0.1109/MSP.2007.4286561. Thomson, D. J. & Chave, A. D., 1991, Jackknifed error estimates for spectra, coherences, and transfer functions, in Advances in Spectrum Analysis and Array Processing, edited by S. Haykin, vol. 1, chap. 2, pp. 58–113, Prentice-Hall, Englewood Cliffs, N. J. Tricomi, F. G., 1970. Integral Equations, Interscience, New York, 5th edn. Varshalovich, D. A., Moskalev, A. N. & Kherso´ nskii, V. K., 1988. Quantum theory of angular momentum, World Scientific, Singapore. Wieczorek, M. A., 2008. Constraints on the composition of the martian south polar cap from gravity and topography, Icarus, 196(2), 506–517, doi: 10.1016/j.icarus.2007.10.026. Wieczorek, M. A. & Simons, F. J., 2005. Localized spectral analysis on the sphere, Geophys. J. Int., 162(3), 655–675, doi: 10.1111/j.1365– 246X.2005.02687.x. Wieczorek, M. A. & Simons, F. J., 2007. Minimum-variance spectral analysis on the sphere, J. Fourier Anal. Appl., 13(6), 665–692, doi: 10.1007/s00041–006–6904–1. Wingham, D. J., 1992. The reconstruction of a band-limited function and its Fourier transform from a finite number of samples at arbitrary locations by Singular Value Decomposition, IEEE Trans. Signal Process., 40(3), 559–570, doi: 10.1109/78.120799. Xu, P., 1992. Determination of surface gravity anomalies using gradiometric observables, Geophys. J. Int., 110, 321–332. Xu, P., 1998. Truncated SVD methods for discrete linear ill-posed problems, Geophys. J. Int., 135(2), 505–514, doi: 10.1046/j.1365– 246X.1998.00652.x. Yao, K., 1967. Application of reproducing kernel Hilbert spaces — Bandlimited signal models, Inform. Control , 11(4), 429–444.