Feb 1, 2007 - Stated another way, the vast majority of votes in a roll call matrix are .... 4. Scaling Roll Call Votes with wnominate in R. 3. Estimate β (if k=1) and ...
Journal of Statistical Software
JSS
MMMMMM YYYY, Volume VV, Issue II.
http://www.jstatsoft.org/
Scaling Roll Call Votes with wnominate in R Keith Poole
Jeffrey Lewis
James Lo
Royce Carroll
University of Georgia
University of California, Los Angeles
University of Mannheim
Rice University
Abstract This paper presents a software package designed to estimate Poole and Rosenthal wnominate scores in R. The package uses a logistic regression model to analyze political choice data, usually (though not exclusively) from a legislative setting. In contrast to other scaling methods, wnominate explicitly assumes probabilistic voting based on a spatial utility function, where the parameters of the utility function and the spatial coordinates of the legislators and the votes can all be estimated on the basis of observed voting behavior. Building on the wnominate software written by Poole in Fortran, the new package facilitates easier data input and manipulation, generates bootstrapped standard errors, and includes a new suite of graphics functions to display the results. We demonstrate the functionality of this package by conducting a natural experiment using roll calls — an experiment which is greatly simplified by the data manipulation capabilities of the wnominate package in R.
Keywords: multivariate, R, roll call, scaling, wnominate.
1. Introduction Legislative roll call analysis has enjoyed a long history in political science, dating back to the work of A. Lawrence Lowell in 1902 (Lowell 1902). In analyzing a roll call matrix containing hundreds of legislators and hundreds or even thousands of votes, procedures that are able to reduce the dimensionality of the data matrix can be helpful in uncovering patterns in voting. As MacRae pointed out as early as 1958 (MacRae 1958), “one way to try to account for political choices is to imagine that each chooser occupies a fixed position in a space of one or more dimensions, and to suppose that every choice presented to him is a choice between two or more points in that space.” The essence of MacRae’s statement suggests that one can think of a roll call matrix as being the result of two different sets of variables — an ideal point for each legislator that repre-
2
Scaling Roll Call Votes with wnominate in R
sents their vote preference or ideology, and separate yea and nay locations for each roll call. Legislators are assumed to have an ideal point on each dimension, along with single-peaked and symmetric preferences. The utility of a yea or nay vote can then be thought of as a function of the distance between the legislator’s ideal point and the yea/nay locations, along with an idiosyncratic utility shock or “error term.” Legislators are then assumed to maximize their utility by voting for the bill outcome that minimizes the distance between the yea/nay location and their ideal point, subject to a stochastic random utility component (McFadden 1973). This multidimensional spatial model was formally proposed by Hinich and Ordeshook (Cahoon, Hinich, and Ordeshook 1976; Ordeshook 1976; Hinich and Pollard 1981) and developed in depth by Hinich and his colleagues (Enelow and Hinich 1984; Hinich and Munger 1994, 1997). The Hinich-Ordeshook spatial model of voting embodies the key insight of Philip Converse ((Converse 1964)). According to Converse, a belief system can be thought of as a set of beliefs that are often observed to be bundled together. Taking the current US Congress as an example, a legislator who favors raising the minimum wage and a federally funded universal health care system is also likely to support affirmative action, higher taxes, and lower defense spending. Empirically, a belief system containing high levels of ‘constraint’ means that given one or two issue positions from a legislator, we are able to predict many other seemingly unrelated issue positions. When applied to roll call data, the existence of constraint has a straightforward geometric interpretation, suggesting that the issues lie on a low-dimensional hyperplane. Stated another way, the vast majority of votes in a roll call matrix are classified correctly using cutlines derived from only one or two issue dimensions. Although a number of different procedures (Poole 2000; Heckman and Snyder 1997; Clinton, Jackman, and Rivers 2004) have been developed to fit the Hinich-Ordeshook spatial model to Congressional roll call votes, the wnominate model remains among the most popular. 1 Fitting such a model allows us to recover estimates of the legislator ideal points and yea/nay locations of a roll call matrix, and these results can themselves be subjected to further analysis. wnominate has been widely applied to study polarization in American politics (McCarty, Poole, and Rosenthal 2006) and party discipline (McCarty, Poole, and Rosenthal 2001), among other topics. Outside of the setting of the US Congress, the model has been used to study voting in the United Nations (Voeten 2001), and the California state legislature (Masket 2007). This package estimates Poole and Rosenthal wnominate scores from roll call votes supplied though a rollcall object from package pscl (Jackman 2009).2 The R (R Development Core Team 2009) version of wnominate computes ideal points using the same Fortran code base as the previous wnom9707 software, and is available from the Comprehensive R Archive Network at http://CRAN.R-project.org/package=wnominate. It improves upon the earlier software in three ways. First, it is now considerably easier to input new data for estimation, as the current software no longer relies exclusively on the old .ord file format for data input. Secondly, the software now allows users to generate standard errors for their ideal point estimates using a parametric bootstrap. Finally, wnominate includes a full suite of graphics functions to facilitate easier interpretation of the results. wnominate scores are based on the spatial model of voting. Let s denote the number of 1
See Poole and Rosenthal (1985) for a discussion comparing wnominate scores to the Guttman scaling procedure that historically preceeded it. 2 Production of this package, wnominate, is supported by NSF Grant SES-0611974.
Journal of Statistical Software
3
policy dimensions, which are indexed by k = 1, . . . , s; let p denote the number of legislators (i = 1, . . . , p; and q denote the number of roll call votes (j = 1, . . . , q. Let xi be the ideal point of legislator i, a vector of length s. Each roll call vote is represented by vectors of length s, zjy and zjn , where y and n stand for the policy outcomes associated with Yea and Nay, respectively. Legislator i’s utility for outcome y on roll call j is Uijy = uijy + �ijy " Ps uijy = β exp −
(1)
2 2 k=1 wk dijyk
#
2
(2)
where uijy represents the deterministic part of the legislator’s utility while �ijy represents the stochastic component. The d2ijyk term in the exponent is the Euclidean distance between a legislator’s ideal point xi and the Yea bill location zjyk ; namely, d2ijy =
s X
(xik − zjyk )2
(3)
k=1
Weight w and β are estimated but set with initial values of 0.5 and 15 respectively. β can be thought of as a signal-to-noise ratio, where as β increases in value, the deterministic portion of the utility function overwhelms the stochastic portion. In multiple dimensions, β is only estimated for the first dimension and is thereafter kept constant. For dimensions 2 to s, the corresponding wk is estimated, with the starting value of wk set at 0.5 each time. The stochastic element in the utility, �, is assumed to follow an extreme value distribution. This allows us to express the probability that legislator i votes for outcome y on roll call j as: Pr(Yea) = Pijy =
exp(uijy ) exp(uijy ) + exp(uijn )
(4)
Extending this even further, by replacing y with the index 1 and n with the index 2, and then allowing l to be the index for y and n, we can express the likelihood function to be maximized as: p Y q Y 2 Y C L= Pijlijl (5) i=1 j=1 l=1
where Cijl = 1 if choice l is the actual choice of legislator i on roll call j and is zero otherwise. In estimating the outcome points for each bill, wnominate estimates and reports the outcome points in terms of their midpoint and the distance between them; namely, zjy = zmj − dj
and zjn = zmj + dj
where zmj is the midpoint and dj = (zjy − zjn )/2. To conduct this estimation, the wnominate algorithm has three basic steps: 1. Estimate zmjk and djk , conditional on xik , β, and wk . 2. Estimate xik , conditional on zmjk , djk , β, and wk .
(6)
4
Scaling Roll Call Votes with wnominate in R 3. Estimate β (if k=1) and wk (if k=2,...,s), conditional on zmjk , djk , and xik .
These steps form a global iteration, which explains the acronym W-NOMINATE—Weighted Nominal Three-Step Estimation. The procedure repeats until the z, x, and d parameters all correlate at 0.99 or better with the set estimated on the previous global iteration.
2. Usage Overview In conducting the estimate, wnominate requires several inputs in addition to the roll call matrix, most of which are set by default. First, one must fix a cutoff level (the lop argument) in terms of the proportion of voters voting with the minority side that determines whether a given roll call in included. Levels that are set too high, such as 0.1, worsen legislator estimates by failing to allow for enough differentiation between extremists and moderates. In contrast, levels that are set too low, such as 0.01, lead to the inclusion of near-unanimous votes that contain little information about member locations. The default is set at 0.025. Secondly, wnominate requires the specification of an initial value of β, which by default is set at 15. This functions as a signal-to-noise ratio3 , and in general should not be modified. As with any common scaling method, the polarities of the estimated coordinates in wnominate are arbitrary. wnominate requires the specification of a legislator to be positive in each dimension. The argument (the polarity argument) is used to orient the estimated results in the desired direction. In general, users will likely wish to orient conservatives on the right and liberals on the left, so ‘positive’ in this case generally means conservative. The polarity can be specified in a number of ways, though the recommended procedure here is to specify polarities using the row numbers of the legislators designated to be positive. No default arguments are set for the polarity argument. Finally, wnominate allows the user to specify the number of trials that they wish to use to bootstrap standard errors. By default, wnominate will not conduct a bootstrap, and hence will not calculate standard errors. In general, we recommend that at least 50 bootstrap trials be used to obtain reasonable standard errors. Users are cautioned that use of the bootstrap will lengthen the amount of time needed to conduct the estimation by a considerable amount. On a 1.67 HGz computer running Windows Vista with 2 GB of memory, 50 bootstrap trials on the 90th Senate in two dimensions (a roll call matrix with 102 legislators and 519 roll calls) took 61 minutes to complete. The estimation time required for all estimates is roughly proportional to O(legislators · rollcalls). To input data into wnominate, we make use of Simon Jackman’s pscl package (Jackman 2009), which contains support for objects of class rollcall. The rollcall object simply acts as a container holding all the key components of a roll call data set in a standardized manner. Readers are advised to look at the documentation of pscl for further information. rollcall objects can be generated in two different ways for use with wnominate. First, users can simply take an .ord file and format it as a rollcall object using the function readKH. Secondly, users can generate a vote matrix of their own in a spreadsheet and format it into a rollcall object using the function rollcall. 4 Each of these cases are supported by a 3
β
The quantity β also controls the maximum choice probability, which is eβe+1 . 4 A third option is to manually generate a rollcall object with known latent values using the generateTestData function for estimation. However, this is intended for Monte Carlo testing purposes only
Journal of Statistical Software
5
similar sequence of function calls, as shown in the diagram below: .ord file
readKH()
−→
rollcall object
vote matrix
rollcall()
rollcall object
−→
wnominate()
−→
wnominate()
−→
wnominate object wnominate object
The rollcall object is input to wnominate and the results of the estimation are output to a wnominate object. This object in turn can then be analyzed using the plot and summary methods built into the package, including: • plot.coords: Plots ideal points in one or two dimensions. • plot.angles: Plots a histogram of cut lines. • plot.cutlines: Plots a specified percentage of cut lines (a Coombs mesh). • plot.skree: Plots a skree plot with the first 20 eigenvalues. • plot.nomObject: S3 method for a wnominate object that combines the four plots described above. • summary.nomObject: S3 method for a wnominate object that summarizes the estimates. Examples of the two cases described here, as well as an example of how the package can be used to conduct natural experiments using roll calls, are presented in the following sections. Before proceeding to the examples however, it should be noted that three types of roll call matrices are not estimated well (or at all) by wnominate. First, roll call matrices with perfect voting are poorly estimated in wnominate because metric information cannot be recovered in the absence of voting error. Secondly, roll call matrices that are too small (and hence have too little information to recover) are also poorly estimated. Finally, in roll call matrices where the legislators can be partitioned off into distinct groups with no linking legislators serving across partitions, wnominate is unable to estimate the problem because no information exists in the data to allow members across distinct groups to be placed in the same ideological space.
3. W-NOMINATE with ORD files This is the use case that the majority of wnominate users are likely to fall into. Roll call votes in a fixed width .ord format for all US Congresses are stored online for download at: • http://www.voteview.com/ • http://adric.sscnet.ucla.edu/rollcall/ (latest Congress only, updates votes in real time) wnominate takes rollcall objects from Simon Jackman’s pscl package as input. The pscl package includes a function, readKH, that takes an .ord file and automatically transforms it into a rollcall object as desired. Using the 90th Senate as an example, we access a local copy of the roll call file as follows: and is not discussed further in this paper.
6
Scaling Roll Call Votes with wnominate in R
R> library("wnominate") R> sen90 sen90 Source: Number of Legislators: Number of Votes:
ftp://voteview.com/sen90kh.ord 102 596
Using the following codes to represent roll call votes: Yea: 1 2 3 Nay: 4 5 6 Abstentions: 7 8 9 Not In Legislature: 0 Legislator-specific variables: [1] "state" "icpsrState" "cd" "icpsrLegis" "party" [6] "partyCode" Detailed information is available via the summary function. Although we will not do so in this example, we could easily subset the roll calls to apply wnominate only to a subset of votes – a function not built into the earlier version of wnominate. Suppose for example that we were interested in applying wnominate only to bills that pertained in some way to agriculture. Keith Poole and Howard Rosenthal’s Voteview (Poole, Rosenthal, and Shor 2000) software allows us to quickly determine which bills in the 90th Senate pertain to agriculture.5 Using this information, we could create a vector of roll calls that we wish to select, then select for them in the rollcall object. In doing so, we also need to take care to update the variable in the rollcall object that counts the total number of bills. The code to do this is not executed, but is nevertheless included here as an example: > selector sen90$m sen90$votes rownames(sen90$votes)[1:12] [1] "JOHNSON (D USA)" "SPARKMAN (D AL)" [5] "BARTLETT (D AK)" "HAYDEN (D AZ)" [9] "MCCLELLAN (D AR)" "KUCHEL (R CA)"
"HILL (D AL)" "FANNIN (R AZ)" "MURPHY (R CA)"
R> result legisdata fix(legisdata) For those interested in just the ideal points, a much better way to do this is to use the summary() function: R> summary(result) SUMMARY OF W-NOMINATE OBJECT ---------------------------Number of Legislators: Number of Votes: Number of Dimensions: Predicted Yeas: Predicted Nays: Correct Classifiction: APRE: GMP:
102 (0 legislators deleted) 519 (77 votes deleted) 2 20197 of 23899 (84.5%) predictions correct 18942 of 22541 (84%) predictions correct 80.45% 84.28% 0.349 0.476 0.659 0.706
The first 10 legislator estimates are: coord1D coord2D JOHNSON (D USA) -0.452 -0.147 SPARKMAN (D AL) 0.231 0.706 HILL (D AL) 0.423 0.848 GRUENING (D AK) -0.717 0.697
Journal of Statistical Software
●
−1.0
0.0
0.5
1.0
90
130
170
7
10 13 16 19
Dimension
1.0 0.5 0.0
4
●●● ●●●●●●●●●●●●●
Second Dimension
Cutting Lines
3
4
60
Skree Plot
2 1 1
●
30
Angle in Degrees
● ●
0
First Dimension
●
Eigenvalue
50 0 10
●
30
D R
−1.0
0.5 0.0
● ● ● ● ● ●● ●● ● ●
Count
1.0
● ●● ● ● ●● ● ●● ● ● ● ●● ●● ●● ● ● ● ●● ●● ● ● ● ● ● ●● ● ● ●● ●● ●● ●● ●●● ● ● ●● ●
Cutting Line Angles
−1.0
Second Dimension
W−NOMINATE Coordinates
9
−1.0
0.0
0.5
1.0
First Dimension
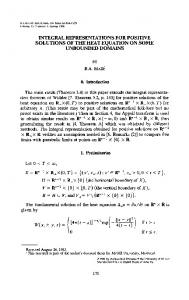
Figure 1: Summary Plot of 90th Senate W-NOMINATE Scores BARTLETT (D AK) HAYDEN (D AZ) FANNIN (R AZ) FULBRIGHT (D AR) MCCLELLAN (D AR) KUCHEL (R CA)
-0.440 0.015 0.826 0.035 0.629 -0.075
0.502 0.849 -0.238 0.688 0.569 -0.572
result can also be plotted, with a basic summary plot achieved as follows as shown Figure 1. This basic plot splits the window into 4 parts and calls plot.coords, plot.angles, plot.skree, and plot.cutlines sequentially. Each of these four functions can also be called individually. In this example, the coordinate plot on the top left plots each legislator with their party affiliation. A unit circle is included to illustrate how wnominate scores are constrained to lie within a unit circle. The cutting angle histogram shows that most votes are well classified by a single dimension and are around 90◦ , although there are a number around 30◦ as well. The skree plot shows the first 20 eigenvalues, and the rapid decline after the second eigenvalue suggests that a two-dimensional model describes the voting behavior of the 90th Senate well. The final plot shows 50 random cutlines, and can be modified to show any
10
Scaling Roll Call Votes with wnominate in R
1.0
W−NOMINATE Coordinates ● ●
●
●
●
●
● ●
● ● ●● ● ● ● ● ● ●●● ● ● ● ● ● ● ● ● ● ● ●● ● ● ● ●● ● ●● ● ● ●●
● ●
D R
● ● ●
● ● ●
● ● ●
●
●
−0.5
0.0
●
●
●
● ●●
●
−1.0
Second Dimension
0.5
●
●
−1.0
−0.5
0.0
0.5
1.0
First Dimension
Figure 2: 90th Senate W-NOMINATE Scores with Cutline for the 58th vote desired number of cutlines as necessary. R> plot(result) NULL Three things should be noted about the use of the plot functions. First, the functions always plot the results from the first two dimensions, but the dimensions used (as well as titles and subheadings) can all be changed by the user if, for example, they wish to plot dimensions 2 and 3 instead. Secondly, plots of one dimensional wnominate objects work somewhat differently than in two dimensions. Finally, plot.coords can be modified to include cutlines from whichever votes the user desires. The cutline of the 14th agricultural vote (corresponding to the 58th actual vote) from the 90th Senate with ideal points is plotted below in Figure 2, showing that the vote largely broke down along partisan lines. R> par(mfrow = c(1, 1)) R> plot.coords(result, cutline = 58)
Journal of Statistical Software
11
4. W-NOMINATE with an arbitrary vote matrix This section describes an example of wnominate being used for roll call data not already in .ord format. The example here is drawn from the first three sessions of the United Nations, discussed further as Figure 5.8 in Keith Poole’s Spatial Models of Parliamentary Voting ((Poole 2005)). To create a rollcall object for use with wnominate, one ideally should have at least three things: • data: A matrix of votes from some source. The matrix should be arranged as a legislators × votes matrix. Previous versions of wnominate required that Yeas be coded as 1, Nays as 6, and missing votes as 9. In this package however, Yeas, Nays and missing votes can be coded arbitrarily. • legis.names: A vector of names for each member in the vote matrix. • Optional Argument: A vector describing the party or party-like memberships for the legislator, to be stored in legis.data as the variable party. The wnominate package includes all three of these items for the United Nations, which can be loaded and browsed with the code shown below. The data comes from Eric Voeten at George Washington University. In practice, one would prepare a roll call data set in a spreadsheet, like the one available at http://www.voteview.com/UN.csv, and read it into R using read.csv. Here, we simply access the local copy of the data on the package: R> R> R> R>
1 2 3 4 5
rm(list = ls(all = TRUE)) data("UN") UN R> R> R>
UNnames R> R> + R> + R> R>
17
font.main = 2, pch = 20) seByrd data for (k in 105:108) data[[k]] buildbigmatrix
a